| Param | Original file | Final file |
|---|---|---|
| Filename | modeM0/AS1C06_002T06_9000004708_32439cztM0_level2.evt | modeM0/AS1C06_002T06_9000004708_32439cztM0_level2_quad_clean.evt |
| Size (bytes) | 440,697,600 | 95,552,640 |
| Size | 420.3 MB | 91.1 MB |
| Events in quadrant A | 2,152,792 | 673,478 |
| Events in quadrant B | 5,529,838 | 623,982 |
| Events in quadrant C | 2,410,647 | 654,375 |
| Events in quadrant D | 2,957,784 | 635,396 |
| Mode SS | |||
|---|---|---|---|
| Quadrant | BADHDUFLAG | Total packets | Discarded packets |
| A | 0 | 90 | 0 |
| B | 0 | 90 | 0 |
| C | 0 | 90 | 0 |
| D | 0 | 90 | 0 |
| Mode M0 | |||
|---|---|---|---|
| Quadrant | BADHDUFLAG | Total packets | Discarded packets |
| A | 0 | 9042 | 0 |
| B | 0 | 19470 | 0 |
| C | 0 | 9841 | 0 |
| D | 0 | 11538 | 0 |
| Mode M9 | |||
|---|---|---|---|
| Quadrant | BADHDUFLAG | Total packets | Discarded packets |
| A | 0 | 8 | 0 |
| B | 0 | 7 | 0 |
| C | 0 | 7 | 0 |
| D | 0 | 7 | 0 |
| Quadrant | Total seconds | Saturated seconds | Saturation percentage |
|---|---|---|---|
| A | 4358 | 25 | 0.573658% |
| B | 4358 | 835 | 19.160165% |
| C | 4358 | 128 | 2.937127% |
| D | 4358 | 218 | 5.002295% |
Noise dominated data is calculated using 1-second bins in cleaned event files. If a bin has >2000 counts, and if more than 50% of those come from <1% of pixels, then it is considered to be noise-dominated and hence unusable.
| Quadrant | # 1 sec bins | Bins with >0 counts | Bins with >2000 counts | High rate bins dominated by noise | Noise dominated (total time) | Noise dominated (detector-on time) | Marked lightcurve |
|---|---|---|---|---|---|---|---|
| A | 4378 | 4359 | 0 | 0 | 0.00% | 0.00% | 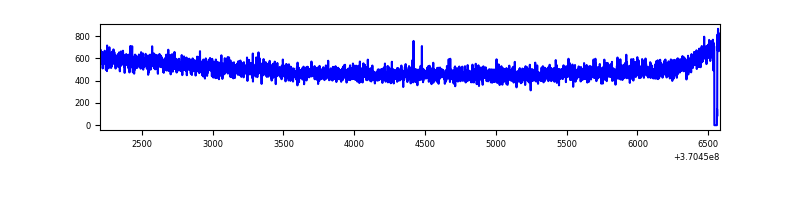 |
| B | 4378 | 4359 | 541 | 541 | 12.36% | 12.41% | 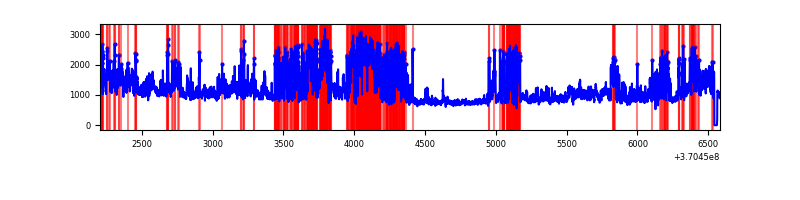 |
| C | 4378 | 4359 | 0 | 0 | 0.00% | 0.00% | 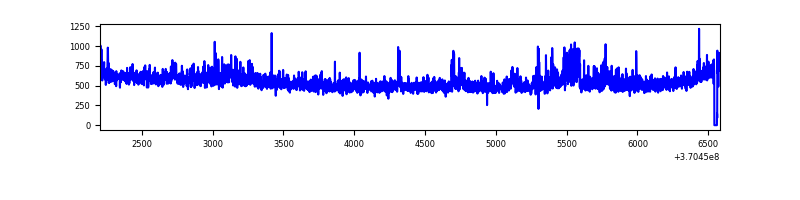 |
| D | 4378 | 4359 | 154 | 154 | 3.52% | 3.53% | 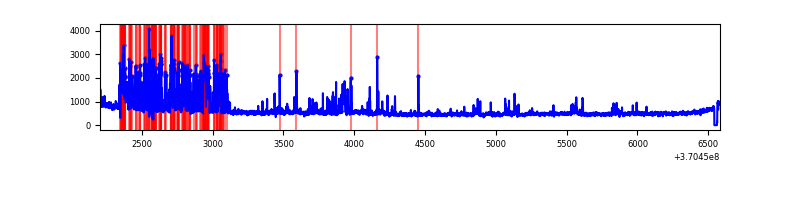 |
Top three noisy pixels from each quadrant. If the there are fewer than three noisy pixels in the level2.evt file, extra rows are filled as -1
| Pixel properties | Quadrant properties | ||||||
|---|---|---|---|---|---|---|---|
| Quadrant | DetID | PixID | Counts | Sigma | Mean | Median | Sigma |
| A | 13 | 254 | 8994 | 76.4 | 556 | 546 | 110.6 |
| A | 13 | 6 | 7470 | 62.62 | 556 | 546 | 110.6 |
| A | 3 | 137 | 4839 | 38.82 | 556 | 546 | 110.6 |
| B | 4 | 80 | 2017898 | 21025.06 | 522 | 511 | 96.0 |
| B | 6 | 159 | 1233392 | 12848.99 | 522 | 511 | 96.0 |
| B | 0 | 190 | 99319 | 1029.77 | 522 | 511 | 96.0 |
| C | 14 | 238 | 128384 | 1026.91 | 541 | 545 | 124.5 |
| C | 14 | 67 | 70802 | 564.36 | 541 | 545 | 124.5 |
| C | 14 | 254 | 56789 | 451.8 | 541 | 545 | 124.5 |
| D | 12 | 233 | 381860 | 3014.48 | 537 | 522 | 126.5 |
| D | 1 | 47 | 300307 | 2369.8 | 537 | 522 | 126.5 |
| D | 8 | 195 | 163869 | 1291.26 | 537 | 522 | 126.5 |
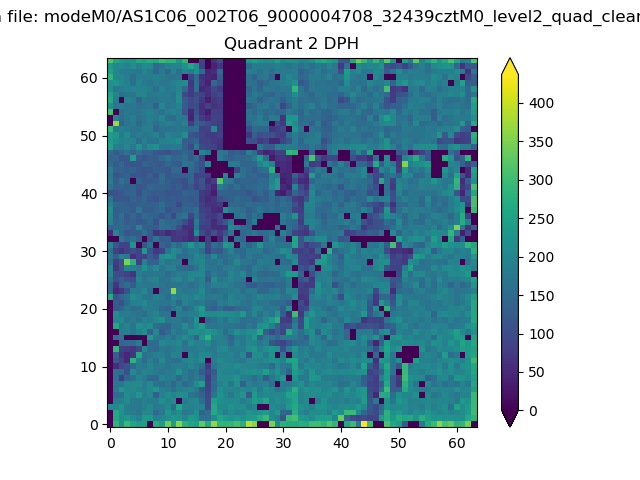
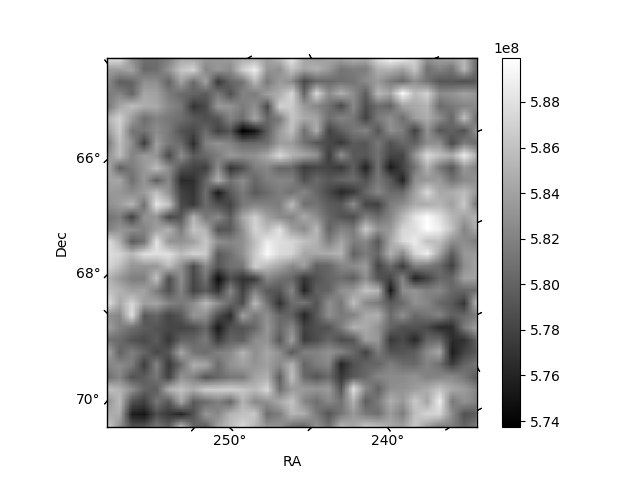
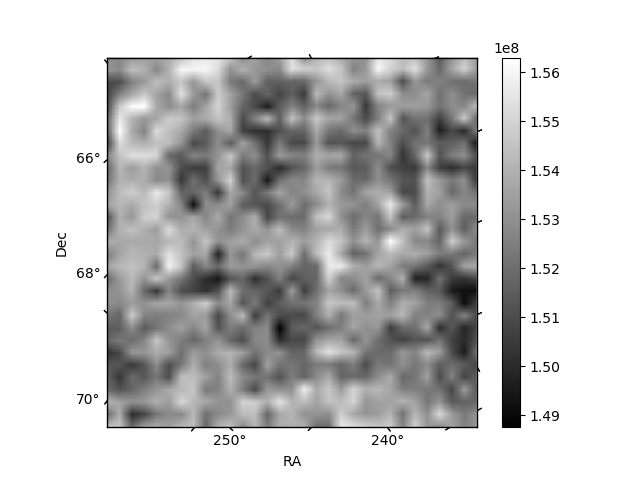
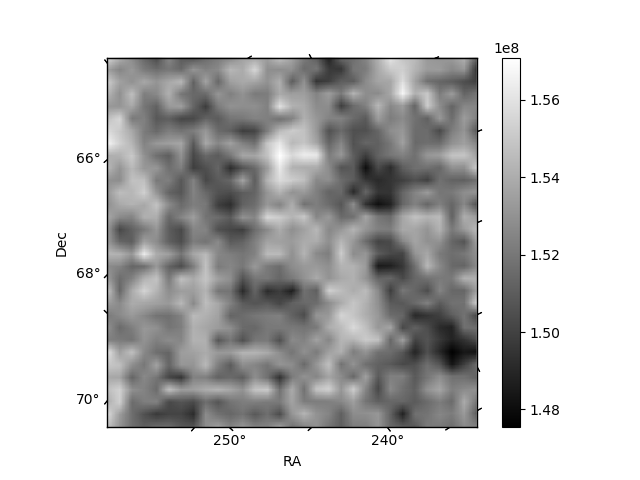
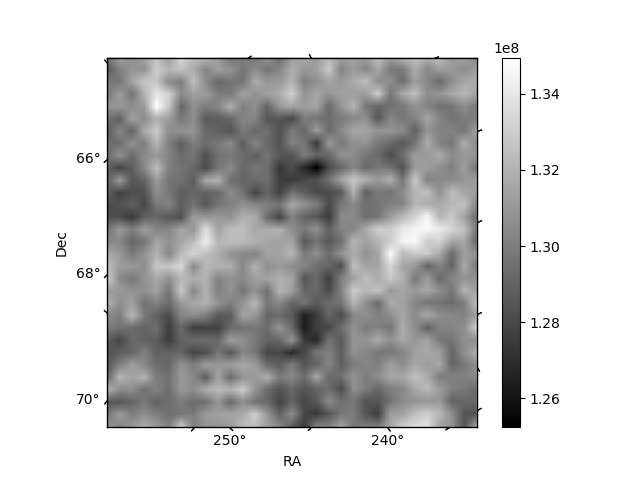
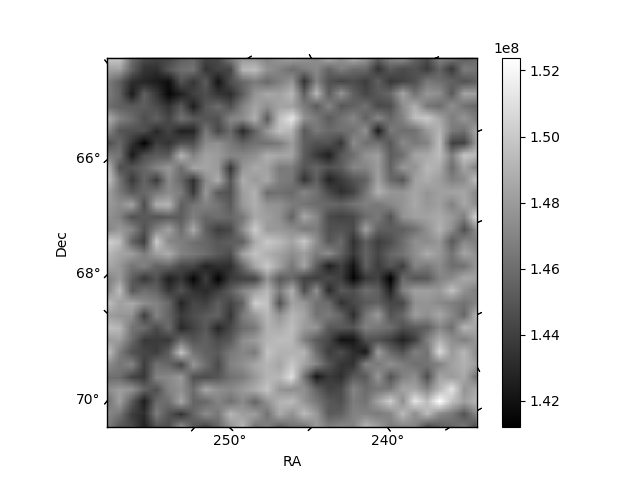
Histogram calculated using DETX and DETY for each event in the final _common_clean file
| Quadrant A | 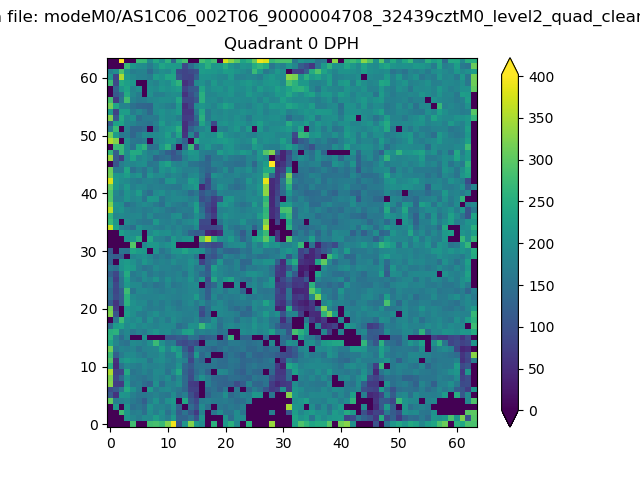 |
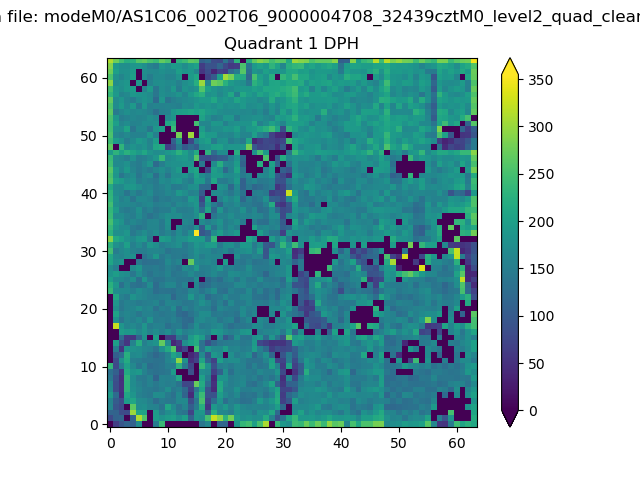 |
Quadrant B |
|---|---|---|---|
| Quadrant D | 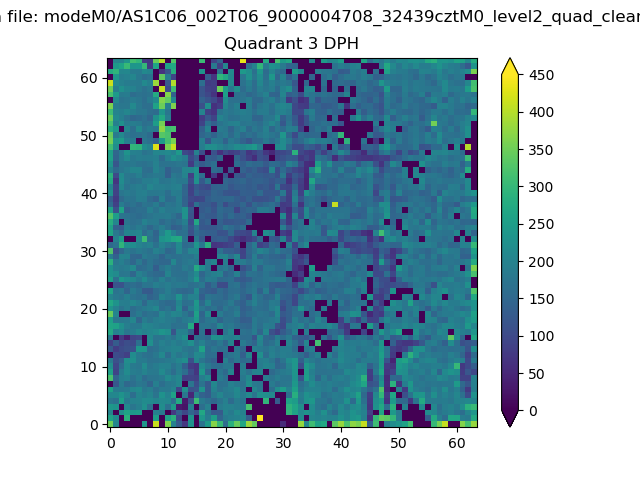 |
 |
Quadrant C |
| Plot type | Count rate plots | Images |
|---|---|---|
| Comparison with Poisson distribution Blue bars denote a histogram of data divided into 1 sec bins. Red curve is a Poisson curve with rate = median count rate of data. |
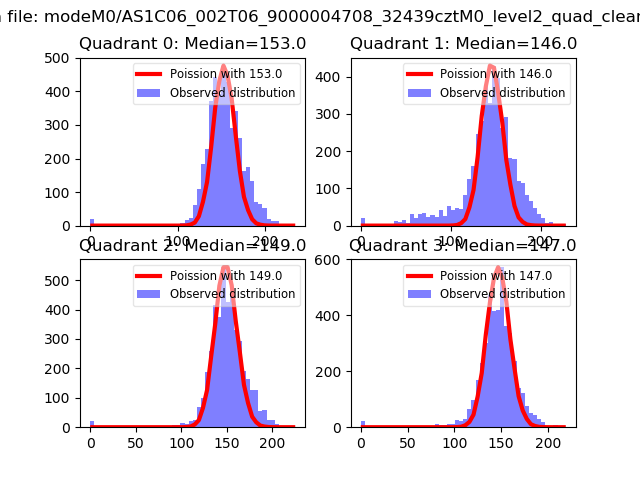 |
 |
| Quadrant-wise count rates Data is divided into 100 sec bins |
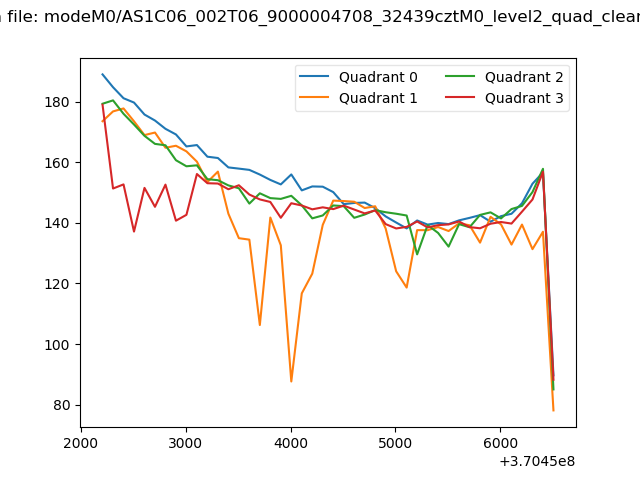 |
|
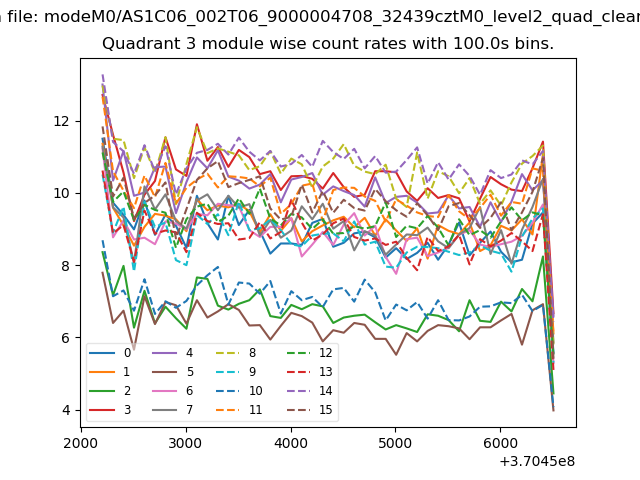
| Module-wise count rates for Quadrant A Data is divided into 100 sec bins |
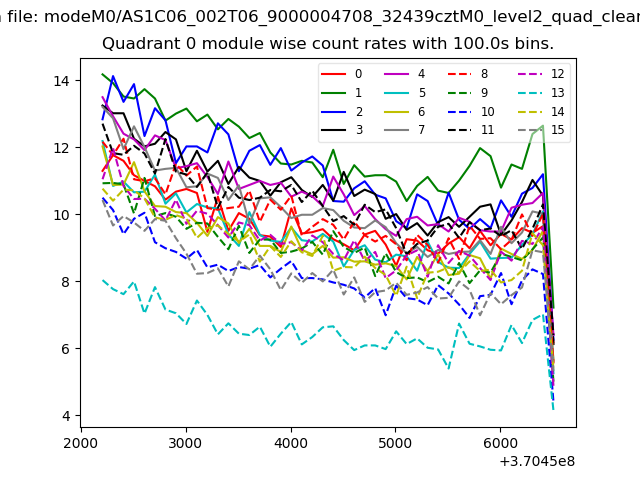 |
 |
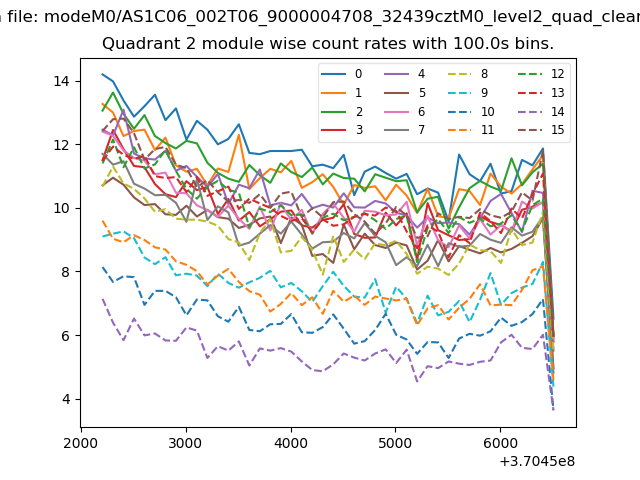
| Module-wise count rates for Quadrant B Data is divided into 100 sec bins |
 |
 |
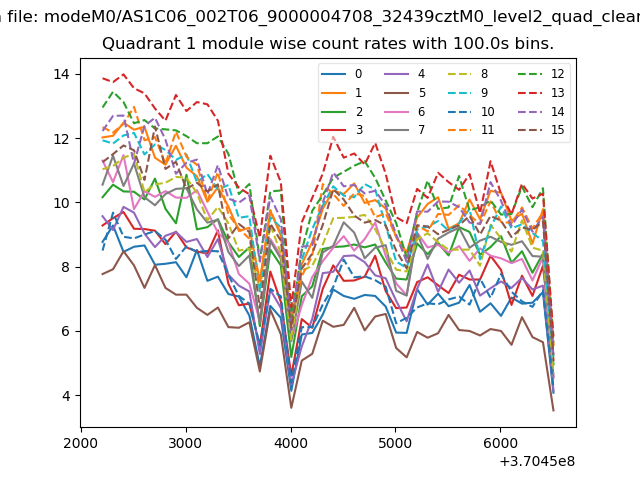
| Module-wise count rates for Quadrant C Data is divided into 100 sec bins |
 |
 |
| Module-wise count rates for Quadrant D Data is divided into 100 sec bins |
 |
 |
| Parameter | Plot |
|---|---|
| CZT HV Monitor | 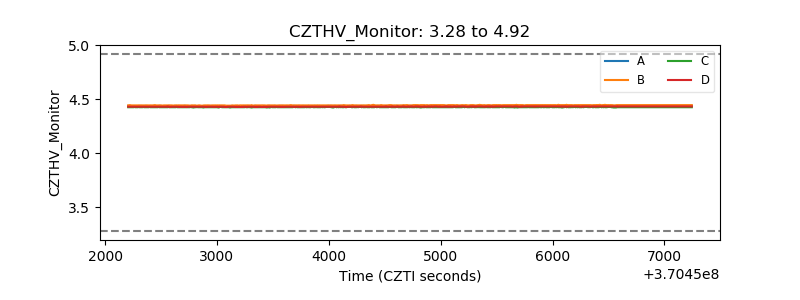 |
| D_VDD | 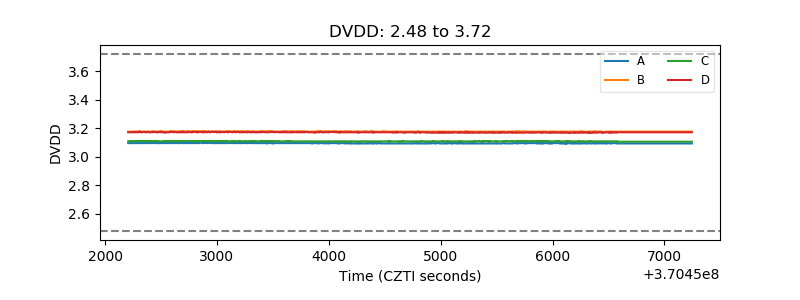 |
| Temperature 1 | 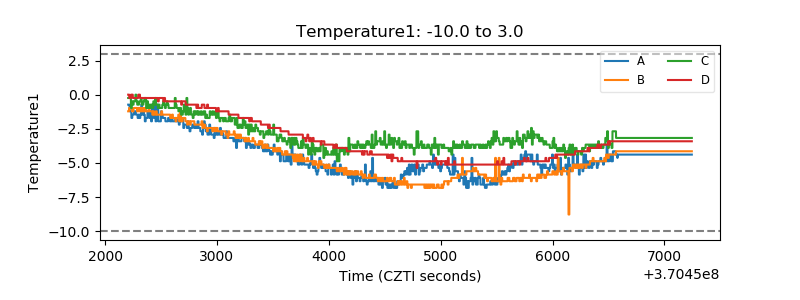 |
| Veto HV Monitor | 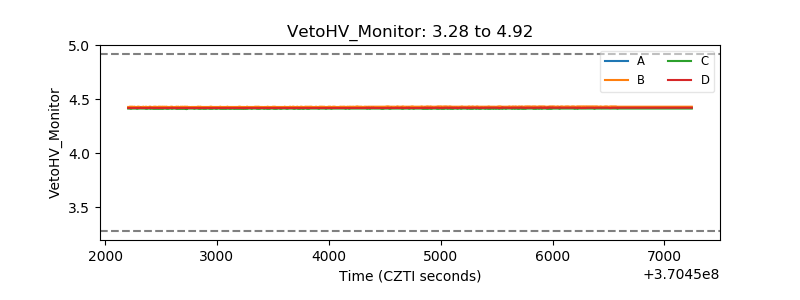 |
| Veto LLD | 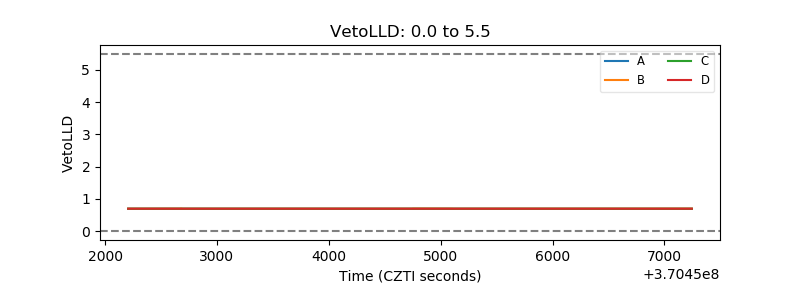 |
| Alpha Counter | 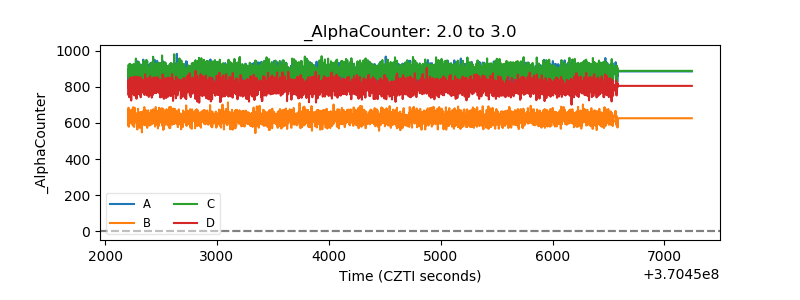 |
| _CPM_Rate | 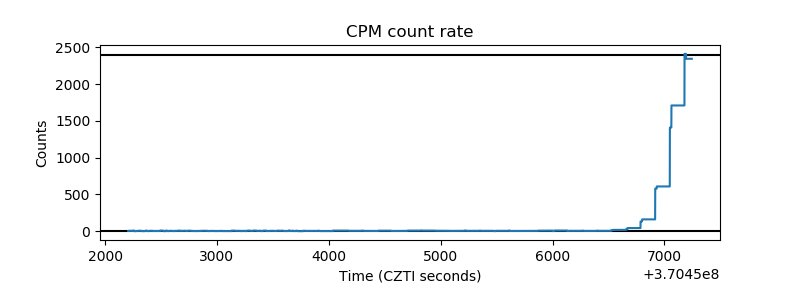 |
| CZT Counter | 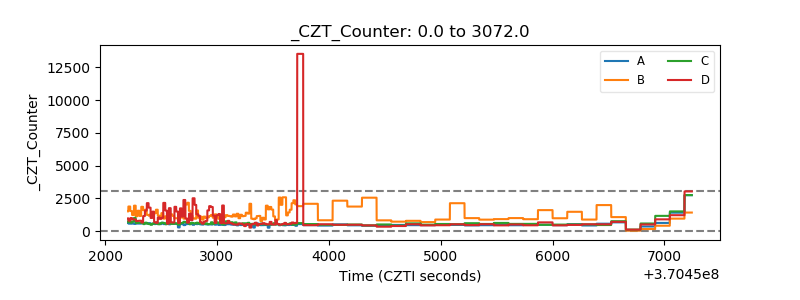 |
| +2.5 Volts monitor |  |
| +5 Volts monitor | 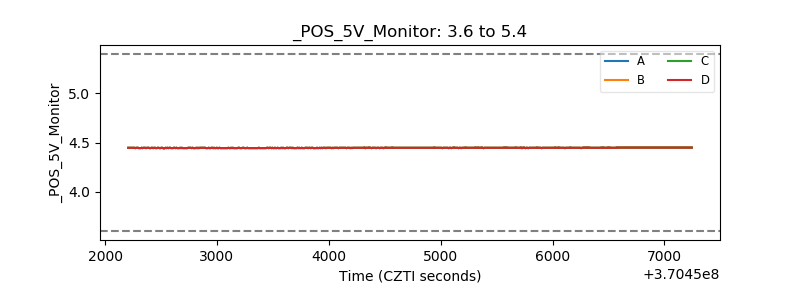 |
| _ROLL_ROT | 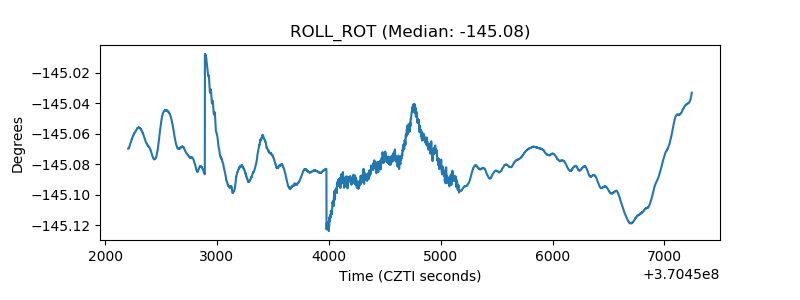 |
| _Roll_DEC | 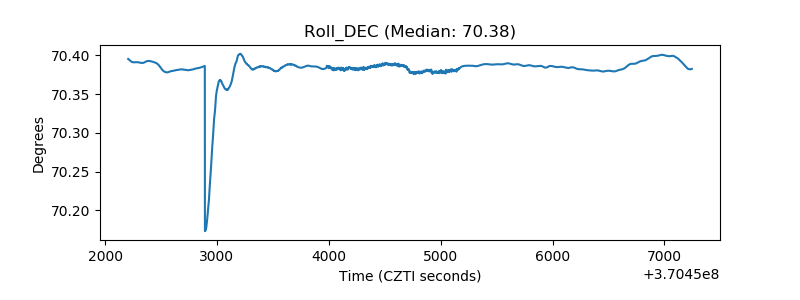 |
| _Roll_RA | 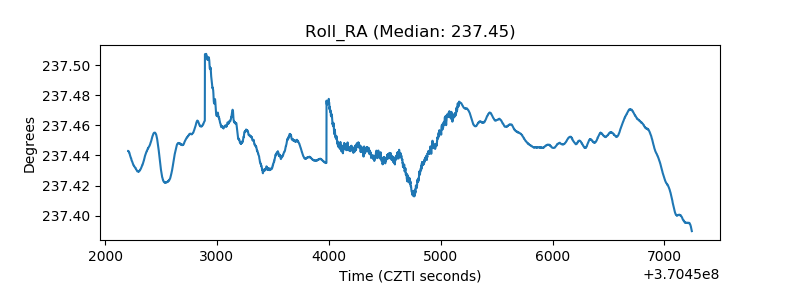 |
| Veto Counter | 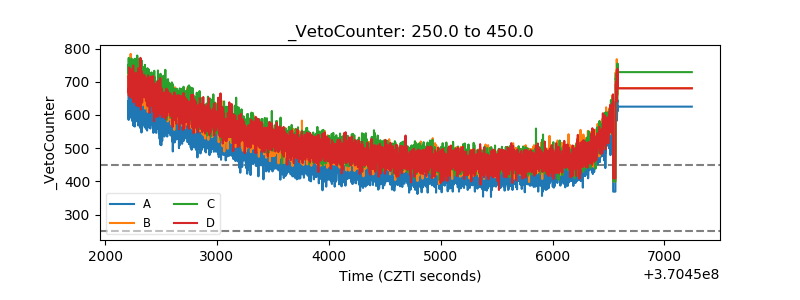 |