| Param | Original file | Final file |
|---|---|---|
| Filename | modeM0/AS1A10_057T03_9000004722cztM0_level2.fits | modeM0/AS1A10_057T03_9000004722cztM0_level2_quad_clean.evt |
| Size (bytes) | 1,060,257,600 | 772,047,360 |
| Size | 1011.1 MB | 736.3 MB |
| Events in quadrant A | 6,370,130 | 4,107,655 |
| Events in quadrant B | 6,065,576 | 4,100,054 |
| Events in quadrant C | 6,254,832 | 4,059,387 |
| Events in quadrant D | 5,343,332 | 3,064,483 |
| Mode M0 | |||
|---|---|---|---|
| Quadrant | BADHDUFLAG | Total packets | Discarded packets |
| A | 0 | 341234 | 0 |
| B | 0 | 375719 | 0 |
| C | 0 | 330804 | 0 |
| D | 0 | 592838 | 0 |
| Mode M9 | |||
|---|---|---|---|
| Quadrant | BADHDUFLAG | Total packets | Discarded packets |
| A | 0 | 475 | 0 |
| B | 0 | 473 | 0 |
| C | 0 | 471 | 0 |
| D | 0 | 539 | 0 |
| Mode SS | |||
|---|---|---|---|
| Quadrant | BADHDUFLAG | Total packets | Discarded packets |
| A | 0 | 2354 | 0 |
| B | 0 | 2348 | 0 |
| C | 0 | 2352 | 0 |
| D | 0 | 2672 | 0 |
| Quadrant | Total seconds | Saturated seconds | Saturation percentage |
|---|---|---|---|
| A | 113462 | 11570 | 10.197247% |
| B | 113373 | 12430 | 10.963810% |
| C | 113343 | 9730 | 8.584562% |
| D | 128926 | 36691 | 28.458961% |
Noise dominated data is calculated using 1-second bins in cleaned event files. If a bin has >2000 counts, and if more than 50% of those come from <1% of pixels, then it is considered to be noise-dominated and hence unusable.
| Quadrant | # 1 sec bins | Bins with >0 counts | Bins with >2000 counts | High rate bins dominated by noise | Noise dominated (total time) | Noise dominated (detector-on time) | Marked lightcurve |
|---|---|---|---|---|---|---|---|
| A | 209260 | 113089 | 0 | 0 | 0.00% | 0.00% | 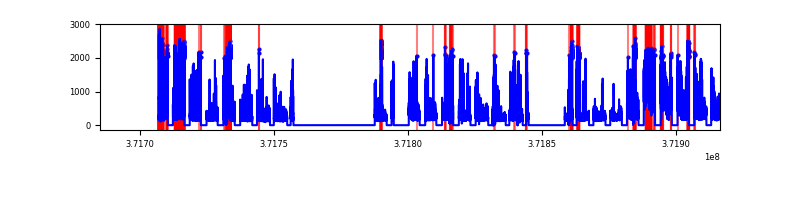 |
| B | 209199 | 113302 | 0 | 0 | 0.00% | 0.00% |  |
| C | 209106 | 113180 | 0 | 0 | 0.00% | 0.00% |  |
| D | 231112 | 127893 | 0 | 0 | 0.00% | 0.00% | 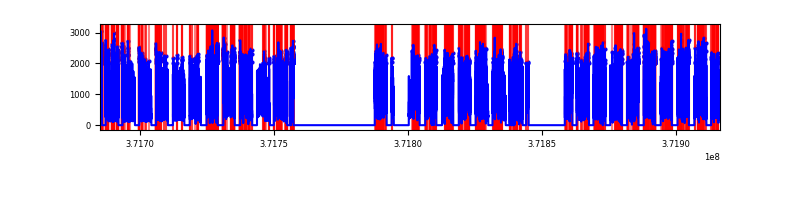 |
Top three noisy pixels from each quadrant. If the there are fewer than three noisy pixels in the level2.evt file, extra rows are filled as -1
| Pixel properties | Quadrant properties | ||||||
|---|---|---|---|---|---|---|---|
| Quadrant | DetID | PixID | Counts | Sigma | Mean | Median | Sigma |
| A | 7 | 110 | 5377 | 9.53 | 1674 | 1585 | 397.8 |
| A | 9 | 19 | 5160 | 8.99 | 1674 | 1585 | 397.8 |
| A | 14 | 95 | 4494 | 7.31 | 1674 | 1585 | 397.8 |
| B | 2 | 9 | 5149 | 11.74 | 1626 | 1569 | 304.9 |
| B | 3 | 80 | 4758 | 10.46 | 1626 | 1569 | 304.9 |
| B | 5 | 128 | 4527 | 9.7 | 1626 | 1569 | 304.9 |
| C | 1 | 81 | 5638 | 9.89 | 1665 | 1574 | 410.9 |
| C | 3 | 202 | 5005 | 8.35 | 1665 | 1574 | 410.9 |
| C | 3 | 203 | 4978 | 8.29 | 1665 | 1574 | 410.9 |
| D | 6 | 67 | 4162 | 6.77 | 1545 | 1411 | 406.2 |
| D | 11 | 66 | 4136 | 6.71 | 1545 | 1411 | 406.2 |
| D | 4 | 160 | 4110 | 6.64 | 1545 | 1411 | 406.2 |
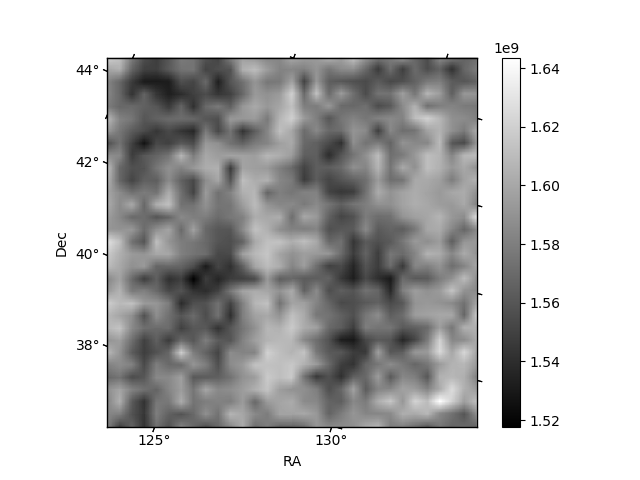
Histogram calculated using DETX and DETY for each event in the final _common_clean file
| Quadrant A | 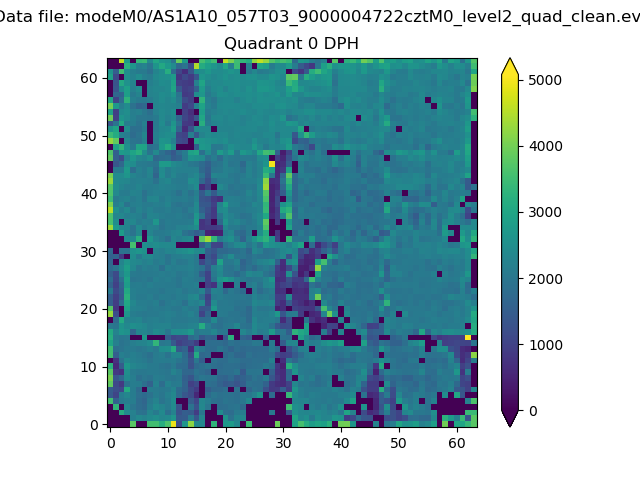 |
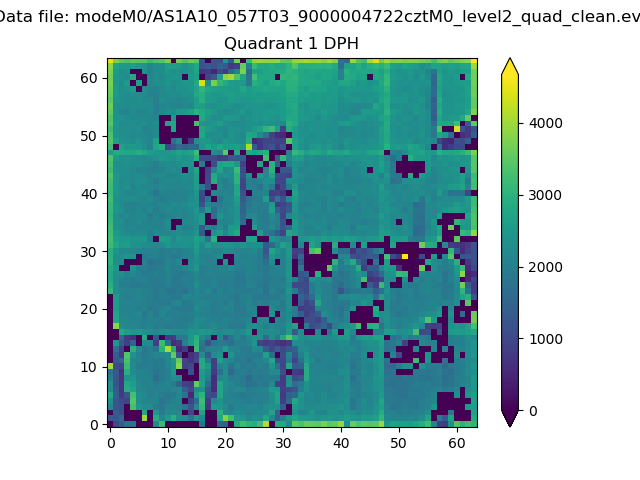 |
Quadrant B |
|---|---|---|---|
| Quadrant D |  |
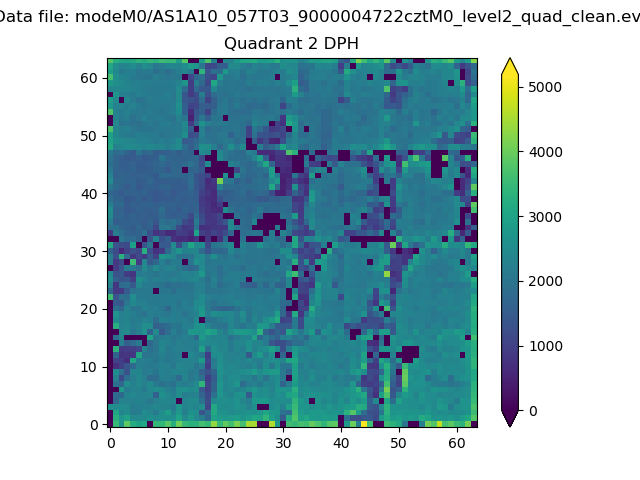 |
Quadrant C |
| Plot type | Count rate plots | Images |
|---|---|---|
| Comparison with Poisson distribution Blue bars denote a histogram of data divided into 1 sec bins. Red curve is a Poisson curve with rate = median count rate of data. |
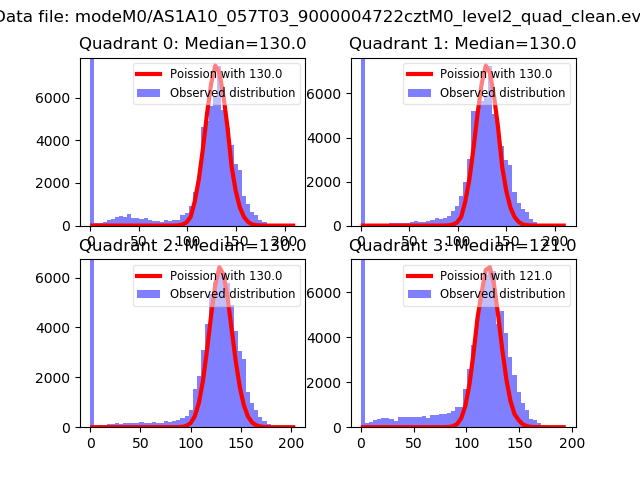 |
 |
| Quadrant-wise count rates Data is divided into 100 sec bins |
 |
|
| Module-wise count rates for Quadrant A Data is divided into 100 sec bins |
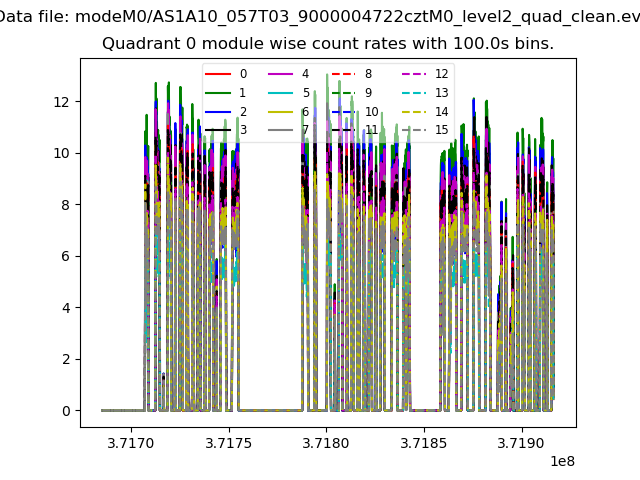 |
 |
| Module-wise count rates for Quadrant B Data is divided into 100 sec bins |
 |
 |
| Module-wise count rates for Quadrant C Data is divided into 100 sec bins |
 |
 |
| Module-wise count rates for Quadrant D Data is divided into 100 sec bins |
 |
 |
| Parameter | Plot |
|---|---|
| CZT HV Monitor | 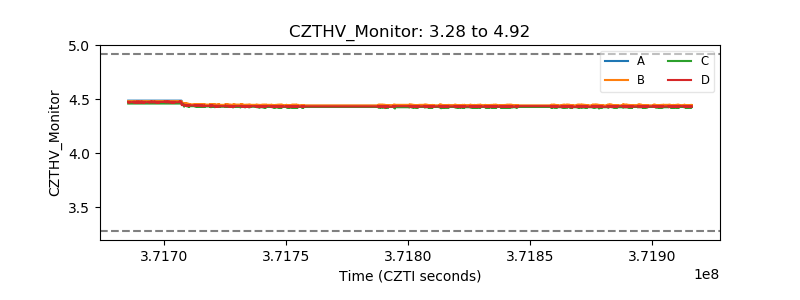 |
| D_VDD |  |
| Temperature 1 |  |
| Veto HV Monitor |  |
| Veto LLD |  |
| Alpha Counter |  |
| _CPM_Rate |  |
| CZT Counter |  |
| +2.5 Volts monitor |  |
| +5 Volts monitor | 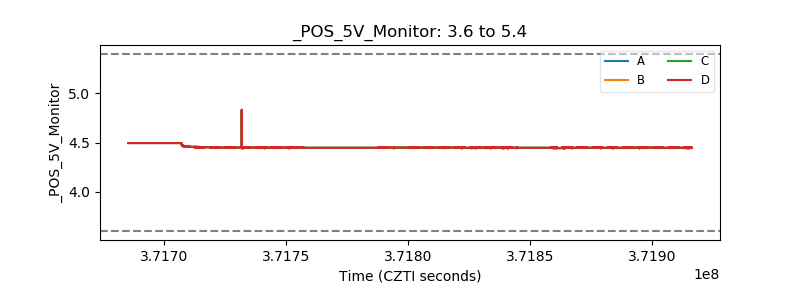 |
| _ROLL_ROT | 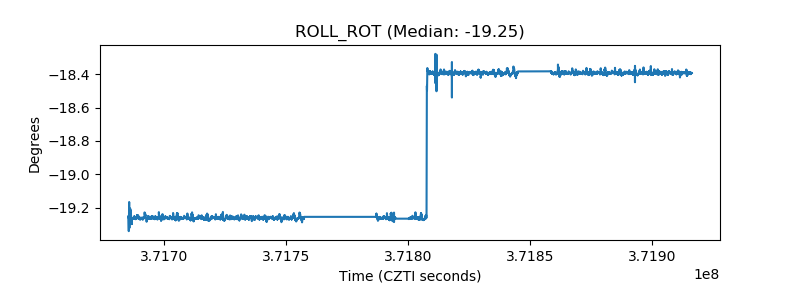 |
| _Roll_DEC |  |
| _Roll_RA | 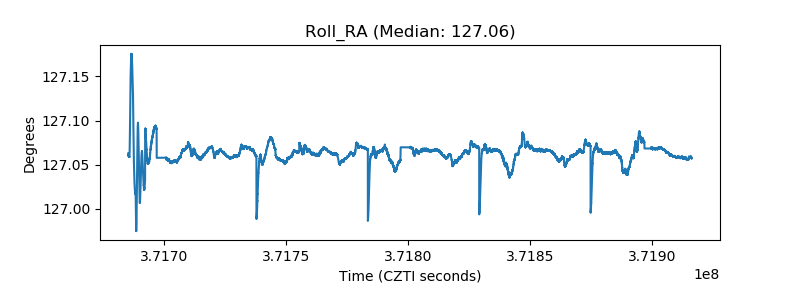 |
| Veto Counter |  |