| Param | Original file | Final file |
|---|---|---|
| Filename | modeM0/AS1A10_057T03_9000004722_32654cztM0_level2.evt | modeM0/AS1A10_057T03_9000004722_32654cztM0_level2_quad_clean.evt |
| Size (bytes) | 1,256,244,480 | 103,440,960 |
| Size | 1.2 GB | 98.6 MB |
| Events in quadrant A | 4,426,133 | 358,217 |
| Events in quadrant B | 9,582,176 | 250,235 |
| Events in quadrant C | 8,956,494 | 226,666 |
| Events in quadrant D | 14,521,435 | 1,716,101 |
| Mode M0 | |||
|---|---|---|---|
| Quadrant | BADHDUFLAG | Total packets | Discarded packets |
| A | 0 | 16214 | 3 |
| B | 0 | 31514 | 2 |
| C | 0 | 29640 | 2 |
| D | 0 | 56550 | 5 |
| Mode M9 | |||
|---|---|---|---|
| Quadrant | BADHDUFLAG | Total packets | Discarded packets |
| A | 0 | 20 | 0 |
| B | 0 | 20 | 0 |
| C | 0 | 19 | 0 |
| D | 0 | 82 | 0 |
| Mode SS | |||
|---|---|---|---|
| Quadrant | BADHDUFLAG | Total packets | Discarded packets |
| A | 0 | 92 | 0 |
| B | 0 | 90 | 0 |
| C | 0 | 90 | 0 |
| D | 0 | 412 | 0 |
| Quadrant | Total seconds | Saturated seconds | Saturation percentage |
|---|---|---|---|
| A | 4512 | 448 | 9.929078% |
| B | 4451 | 3478 | 78.139744% |
| C | 4401 | 3205 | 72.824358% |
| D | 20003 | 986 | 4.929261% |
Noise dominated data is calculated using 1-second bins in cleaned event files. If a bin has >2000 counts, and if more than 50% of those come from <1% of pixels, then it is considered to be noise-dominated and hence unusable.
| Quadrant | # 1 sec bins | Bins with >0 counts | Bins with >2000 counts | High rate bins dominated by noise | Noise dominated (total time) | Noise dominated (detector-on time) | Marked lightcurve |
|---|---|---|---|---|---|---|---|
| A | 6424 | 4512 | 396 | 396 | 6.16% | 8.78% | 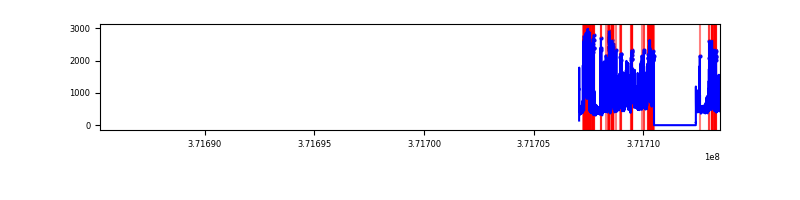 |
| B | 6363 | 4451 | 3242 | 3242 | 50.95% | 72.84% | 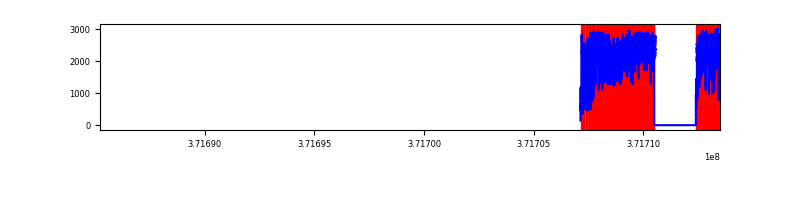 |
| C | 6270 | 4358 | 2776 | 2776 | 44.27% | 63.70% | 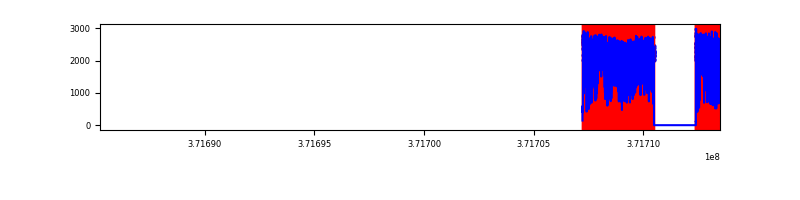 |
| D | 28275 | 20007 | 943 | 943 | 3.34% | 4.71% |  |
Top three noisy pixels from each quadrant. If the there are fewer than three noisy pixels in the level2.evt file, extra rows are filled as -1
| Pixel properties | Quadrant properties | ||||||
|---|---|---|---|---|---|---|---|
| Quadrant | DetID | PixID | Counts | Sigma | Mean | Median | Sigma |
| A | 1 | 39 | 1383315 | 12935.88 | 534 | 524 | 106.9 |
| A | 1 | 25 | 648719 | 6063.8 | 534 | 524 | 106.9 |
| A | 1 | 23 | 182451 | 1701.91 | 534 | 524 | 106.9 |
| B | 3 | 43 | 5161262 | 78069.39 | 335 | 329 | 66.1 |
| B | 3 | 250 | 927774 | 14029.45 | 335 | 329 | 66.1 |
| B | 10 | 191 | 912150 | 13793.11 | 335 | 329 | 66.1 |
| C | 8 | 35 | 3836189 | 49785.93 | 317 | 318 | 77.0 |
| C | 8 | 163 | 1832395 | 23778.6 | 317 | 318 | 77.0 |
| C | 8 | 147 | 891843 | 11571.14 | 317 | 318 | 77.0 |
| D | 12 | 222 | 2076526 | 4018.79 | 2216 | 2173 | 516.2 |
| D | 8 | 195 | 852477 | 1647.35 | 2216 | 2173 | 516.2 |
| D | 12 | 6 | 812014 | 1568.96 | 2216 | 2173 | 516.2 |
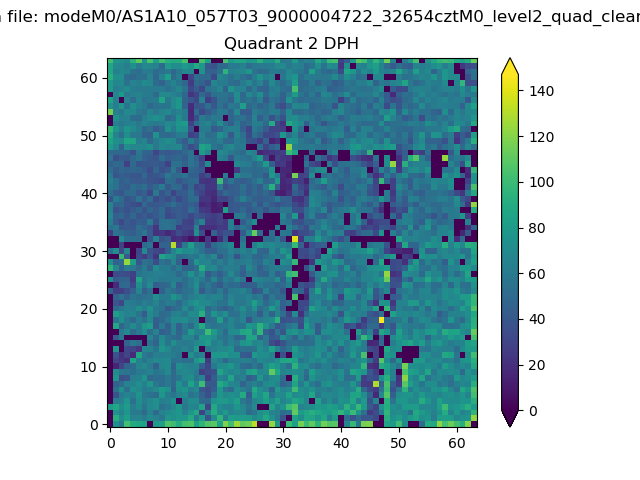
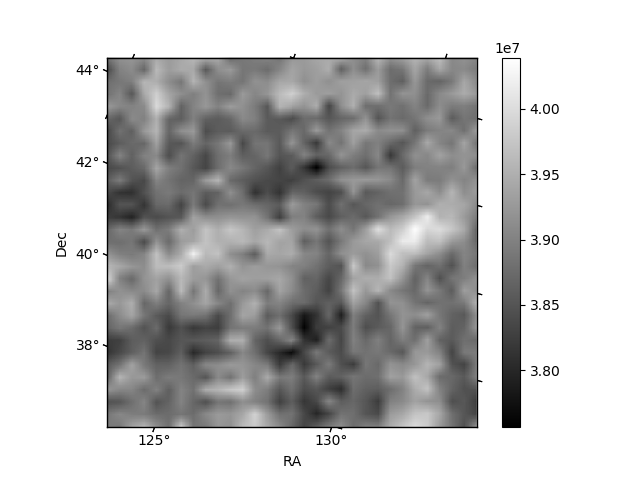
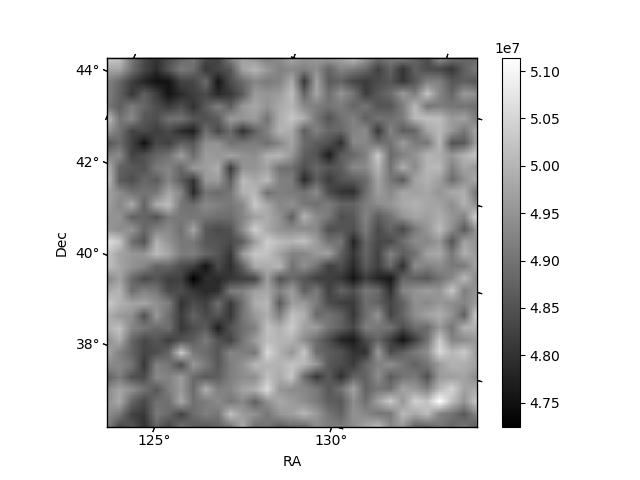
Histogram calculated using DETX and DETY for each event in the final _common_clean file
| Quadrant A | 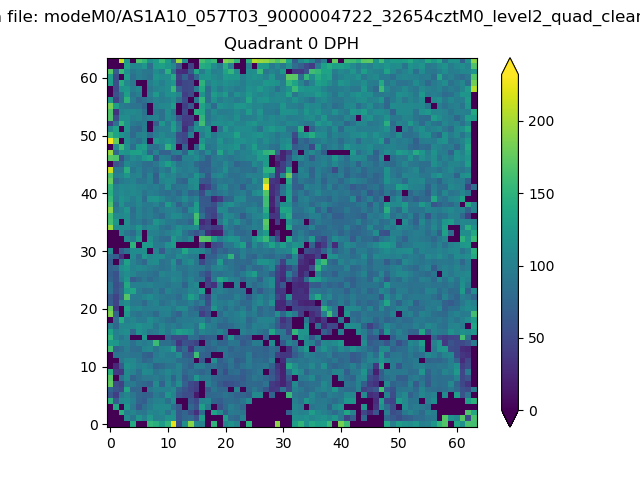 |
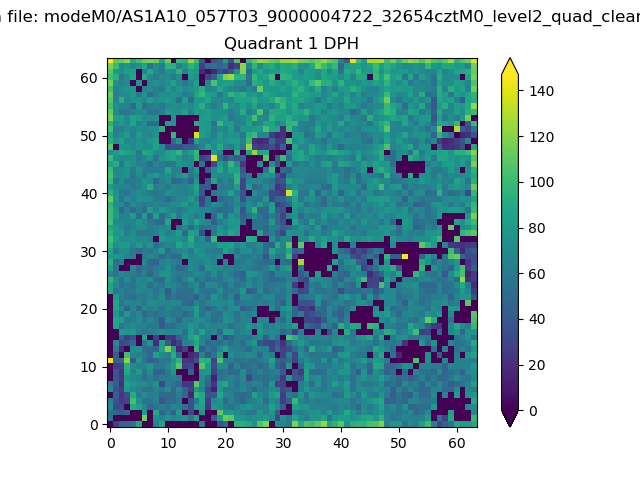 |
Quadrant B |
|---|---|---|---|
| Quadrant D | 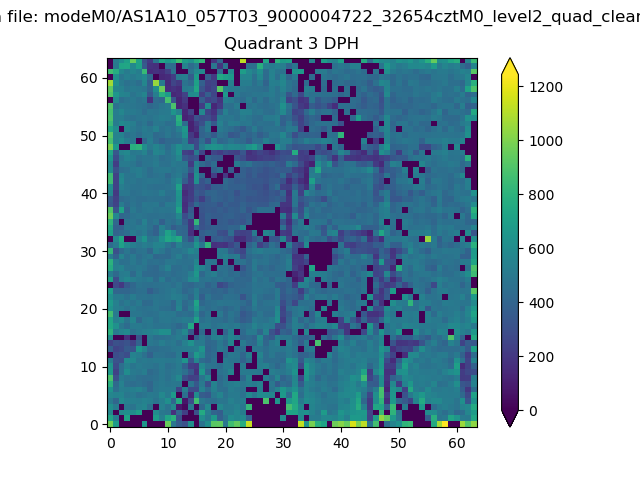 |
 |
Quadrant C |
| Plot type | Count rate plots | Images |
|---|---|---|
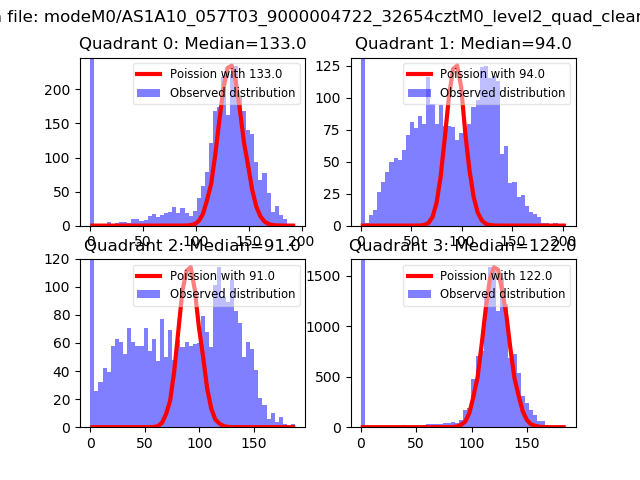
| Comparison with Poisson distribution Blue bars denote a histogram of data divided into 1 sec bins. Red curve is a Poisson curve with rate = median count rate of data. |
 |
 |
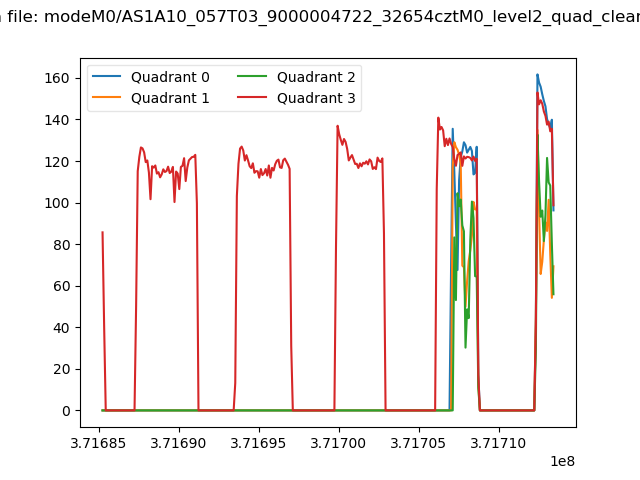
| Quadrant-wise count rates Data is divided into 100 sec bins |
 |
|
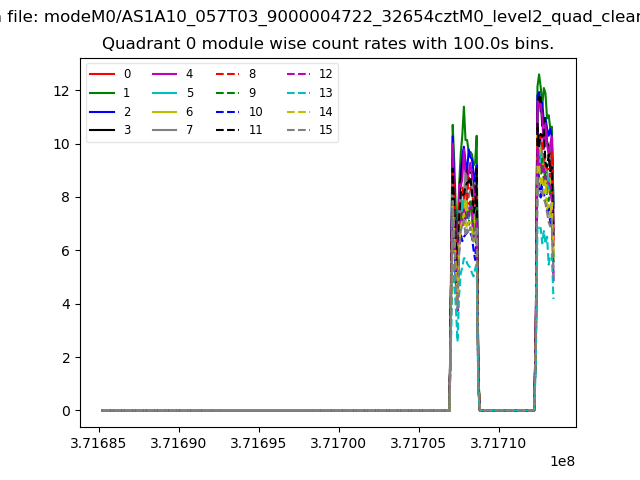
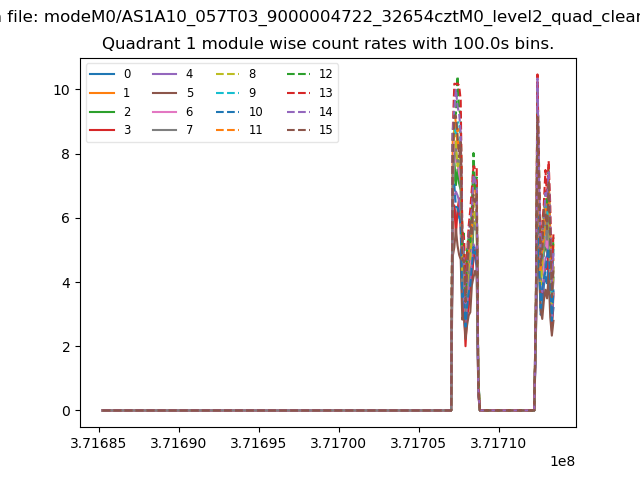
| Module-wise count rates for Quadrant A Data is divided into 100 sec bins |
 |
 |
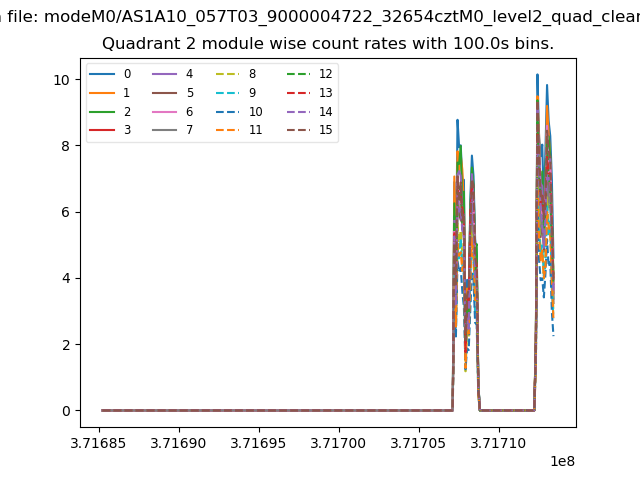
| Module-wise count rates for Quadrant B Data is divided into 100 sec bins |
 |
 |
| Module-wise count rates for Quadrant C Data is divided into 100 sec bins |
 |
 |
| Module-wise count rates for Quadrant D Data is divided into 100 sec bins |
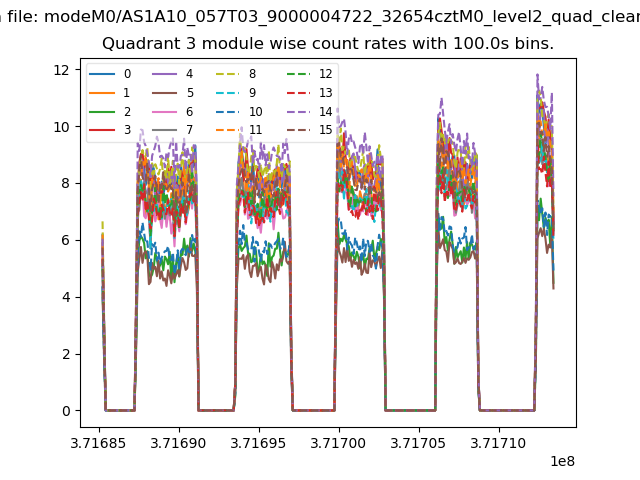 |
 |
| Parameter | Plot |
|---|---|
| CZT HV Monitor |  |
| D_VDD | 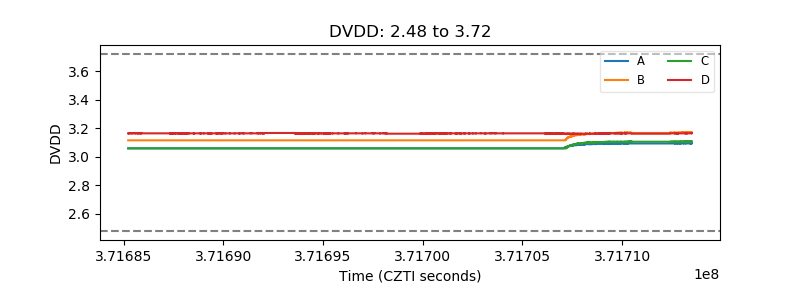 |
| Temperature 1 |  |
| Veto HV Monitor | 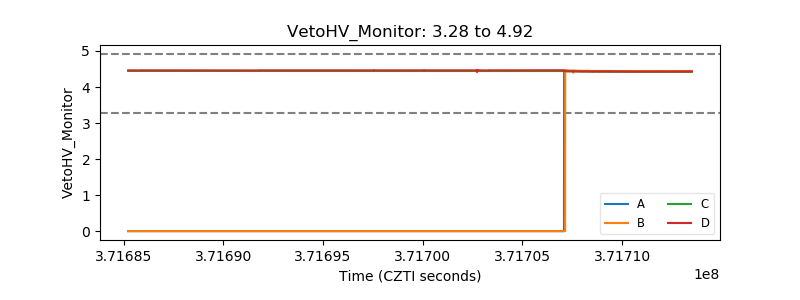 |
| Veto LLD |  |
| Alpha Counter | 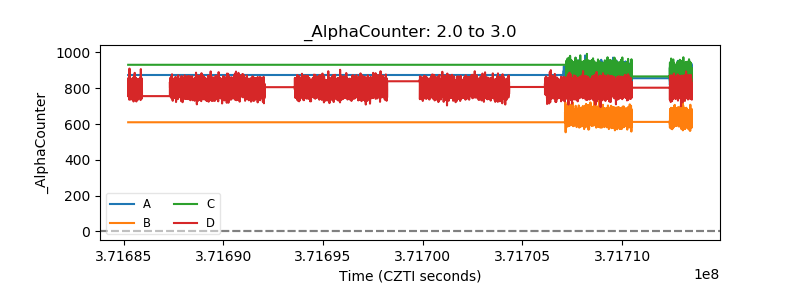 |
| _CPM_Rate | 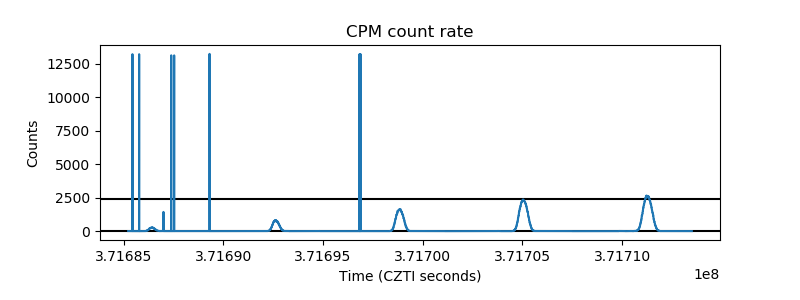 |
| CZT Counter | 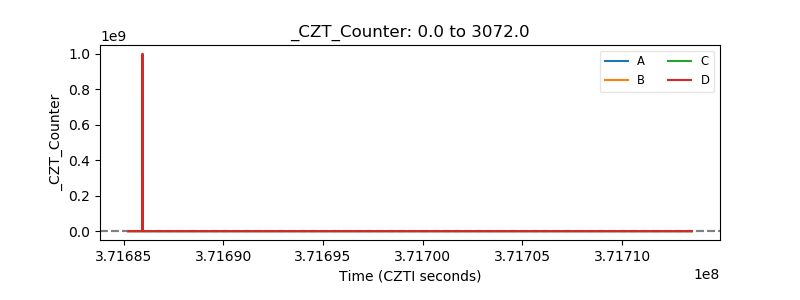 |
| +2.5 Volts monitor |  |
| +5 Volts monitor | 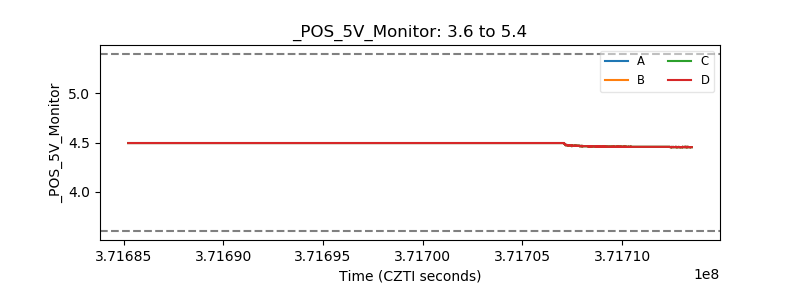 |
| _ROLL_ROT | 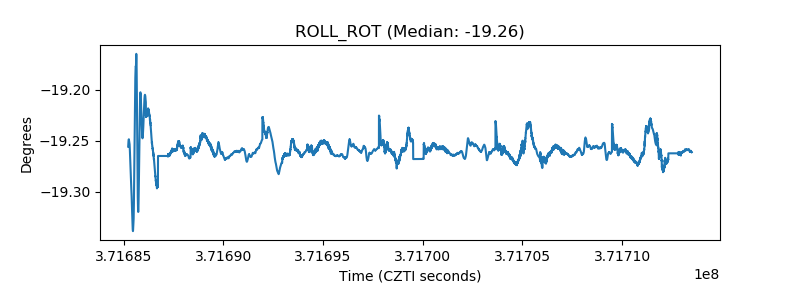 |
| _Roll_DEC | 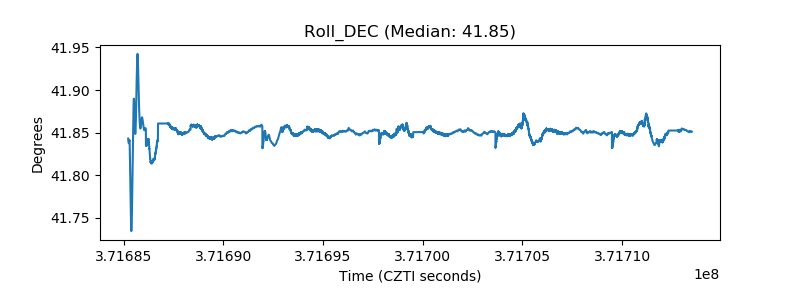 |
| _Roll_RA | 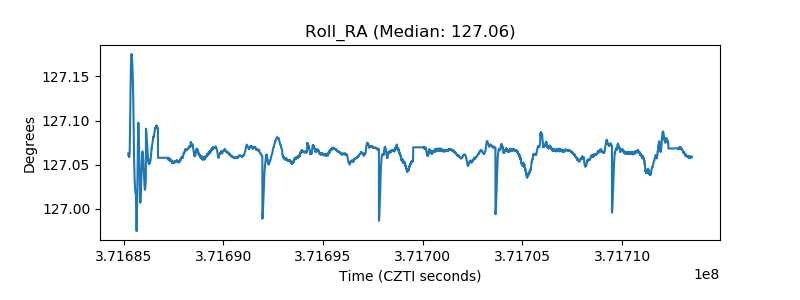 |
| Veto Counter | 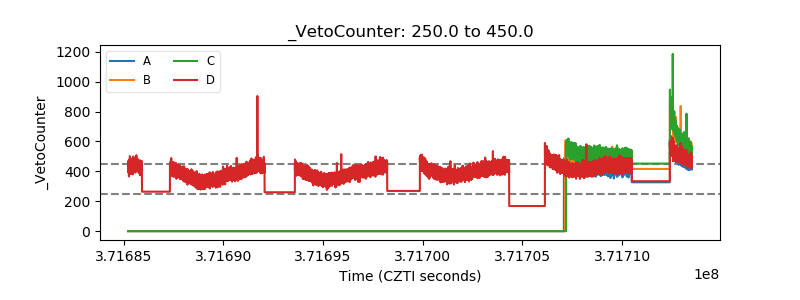 |