| Param | Original file | Final file |
|---|---|---|
| Filename | modeM0/AS1A10_057T03_9000004722_32655cztM0_level2.evt | modeM0/AS1A10_057T03_9000004722_32655cztM0_level2_quad_clean.evt |
| Size (bytes) | 942,174,720 | 57,430,080 |
| Size | 898.5 MB | 54.8 MB |
| Events in quadrant A | 5,035,681 | 413,488 |
| Events in quadrant B | 10,093,468 | 297,907 |
| Events in quadrant C | 9,085,630 | 283,117 |
| Events in quadrant D | 3,987,937 | 396,177 |
| Mode M0 | |||
|---|---|---|---|
| Quadrant | BADHDUFLAG | Total packets | Discarded packets |
| A | 0 | 18254 | 2 |
| B | 0 | 33418 | 1 |
| C | 0 | 30350 | 1 |
| D | 0 | 15099 | 1 |
| Mode M9 | |||
|---|---|---|---|
| Quadrant | BADHDUFLAG | Total packets | Discarded packets |
| A | 0 | 20 | 0 |
| B | 0 | 20 | 0 |
| C | 0 | 20 | 0 |
| D | 0 | 20 | 0 |
| Mode SS | |||
|---|---|---|---|
| Quadrant | BADHDUFLAG | Total packets | Discarded packets |
| A | 0 | 102 | 0 |
| B | 0 | 102 | 0 |
| C | 0 | 102 | 0 |
| D | 0 | 102 | 0 |
| Quadrant | Total seconds | Saturated seconds | Saturation percentage |
|---|---|---|---|
| A | 4935 | 537 | 10.881459% |
| B | 4935 | 3239 | 65.633232% |
| C | 4935 | 2781 | 56.352584% |
| D | 4935 | 351 | 7.112462% |
Noise dominated data is calculated using 1-second bins in cleaned event files. If a bin has >2000 counts, and if more than 50% of those come from <1% of pixels, then it is considered to be noise-dominated and hence unusable.
| Quadrant | # 1 sec bins | Bins with >0 counts | Bins with >2000 counts | High rate bins dominated by noise | Noise dominated (total time) | Noise dominated (detector-on time) | Marked lightcurve |
|---|---|---|---|---|---|---|---|
| A | 6969 | 4936 | 480 | 480 | 6.89% | 9.72% | 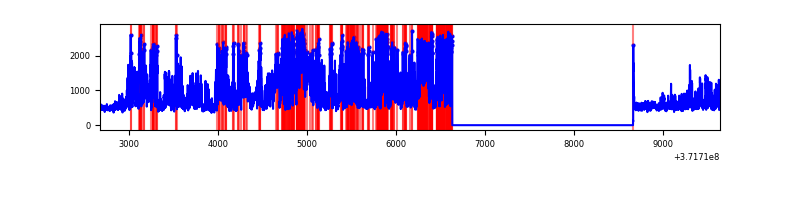 |
| B | 6969 | 4936 | 3151 | 3151 | 45.21% | 63.84% | 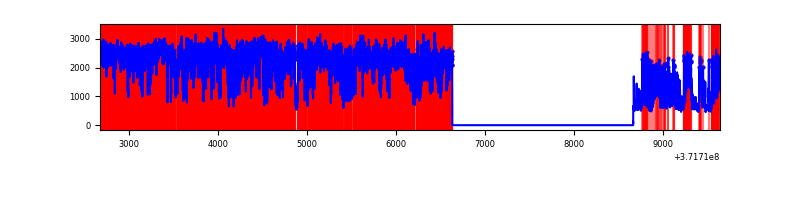 |
| C | 6969 | 4936 | 2430 | 2430 | 34.87% | 49.23% | 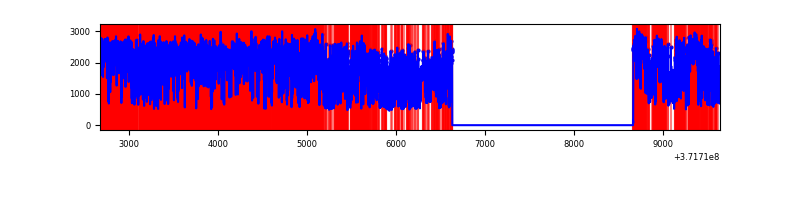 |
| D | 6969 | 4936 | 303 | 303 | 4.35% | 6.14% | 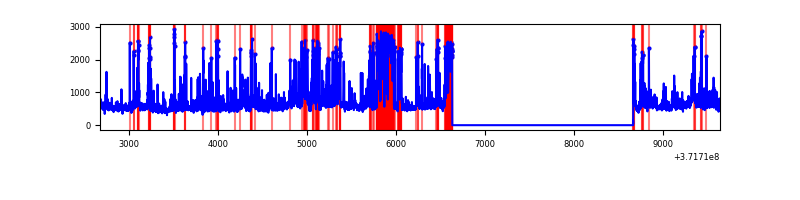 |
Top three noisy pixels from each quadrant. If the there are fewer than three noisy pixels in the level2.evt file, extra rows are filled as -1
| Pixel properties | Quadrant properties | ||||||
|---|---|---|---|---|---|---|---|
| Quadrant | DetID | PixID | Counts | Sigma | Mean | Median | Sigma |
| A | 1 | 39 | 2519354 | 21071.44 | 602 | 592 | 119.5 |
| A | 1 | 23 | 115521 | 961.47 | 602 | 592 | 119.5 |
| A | 15 | 249 | 17823 | 144.15 | 602 | 592 | 119.5 |
| B | 3 | 43 | 6577338 | 78105.35 | 444 | 436 | 84.2 |
| B | 3 | 34 | 335561 | 3979.85 | 444 | 436 | 84.2 |
| B | 3 | 220 | 227880 | 2701.06 | 444 | 436 | 84.2 |
| C | 8 | 35 | 3732498 | 35048.63 | 447 | 451 | 106.5 |
| C | 8 | 147 | 1720939 | 16157.55 | 447 | 451 | 106.5 |
| C | 10 | 9 | 459266 | 4308.85 | 447 | 451 | 106.5 |
| D | 2 | 249 | 701281 | 5210.24 | 573 | 562 | 134.5 |
| D | 2 | 250 | 347129 | 2576.92 | 573 | 562 | 134.5 |
| D | 8 | 195 | 279111 | 2071.17 | 573 | 562 | 134.5 |
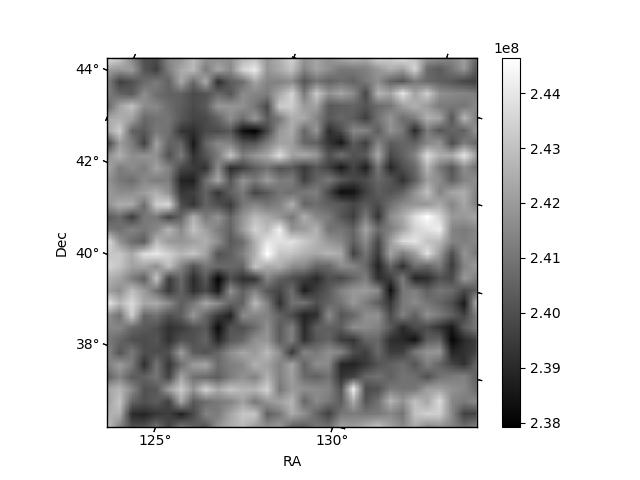
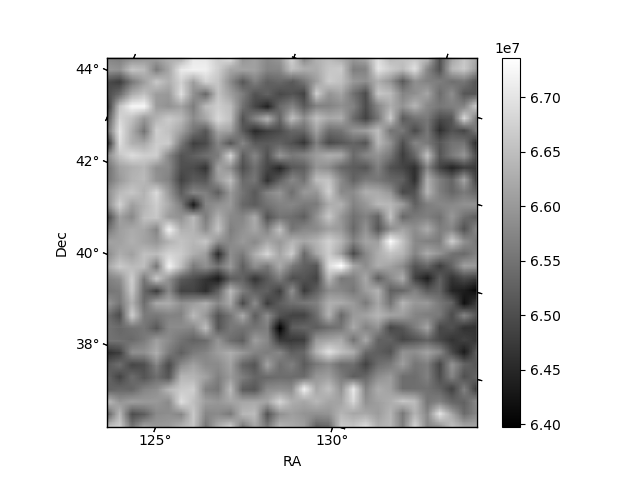
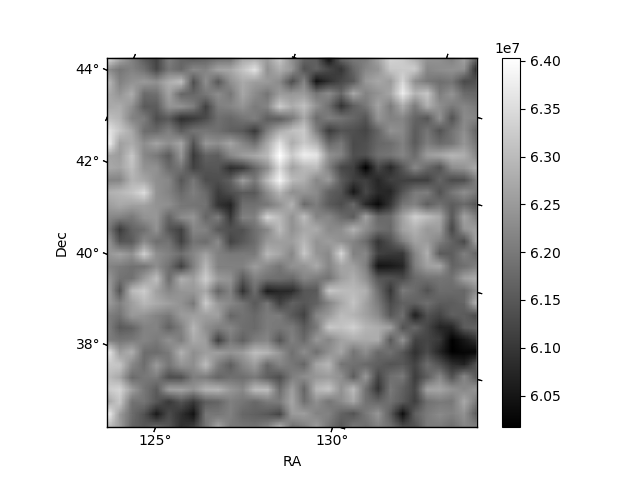
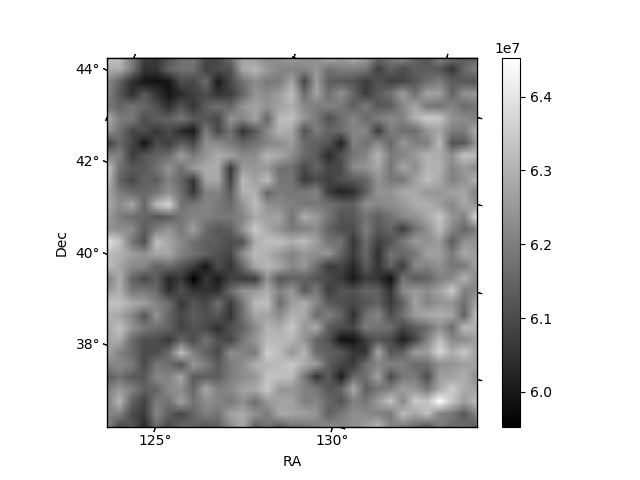
Histogram calculated using DETX and DETY for each event in the final _common_clean file
| Quadrant A | 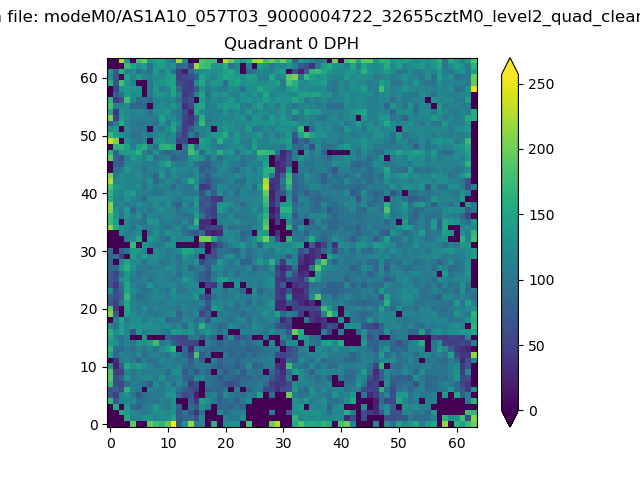 |
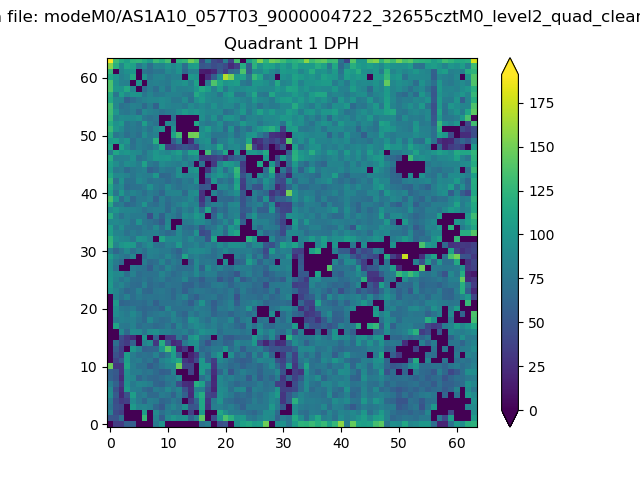 |
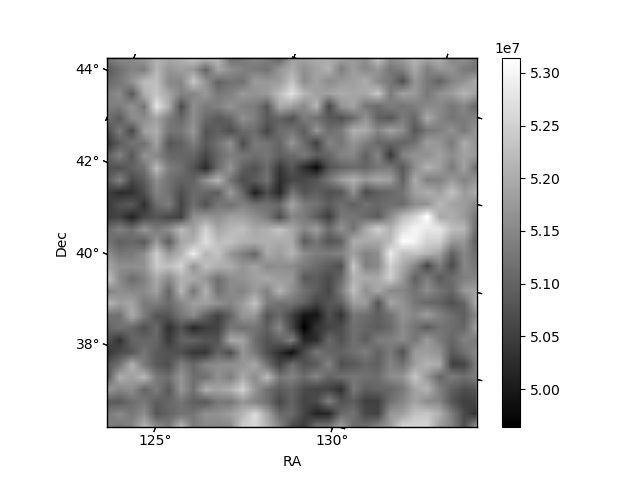
Quadrant B |
|---|---|---|---|
| Quadrant D |  |
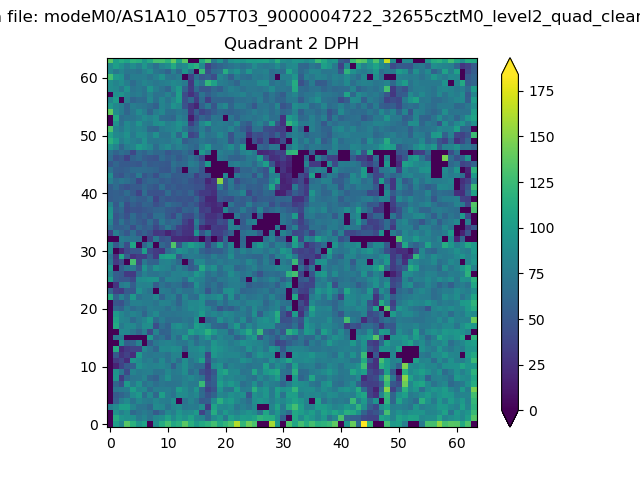 |
Quadrant C |
| Plot type | Count rate plots | Images |
|---|---|---|
| Comparison with Poisson distribution Blue bars denote a histogram of data divided into 1 sec bins. Red curve is a Poisson curve with rate = median count rate of data. |
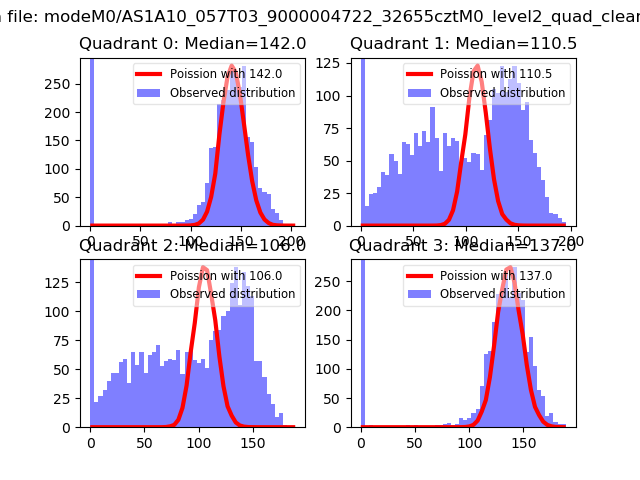 |
 |
| Quadrant-wise count rates Data is divided into 100 sec bins |
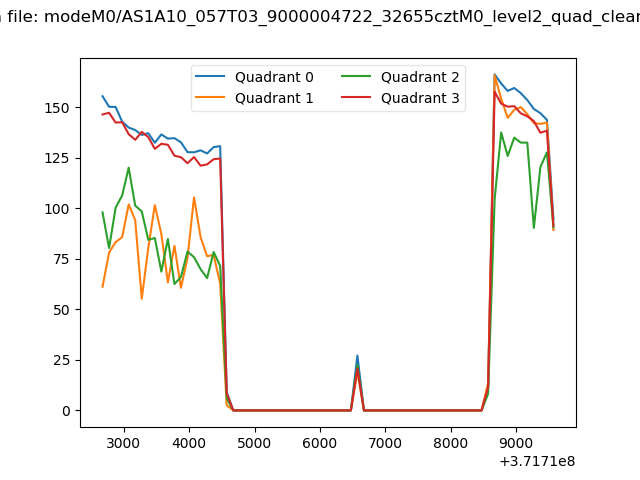 |
|
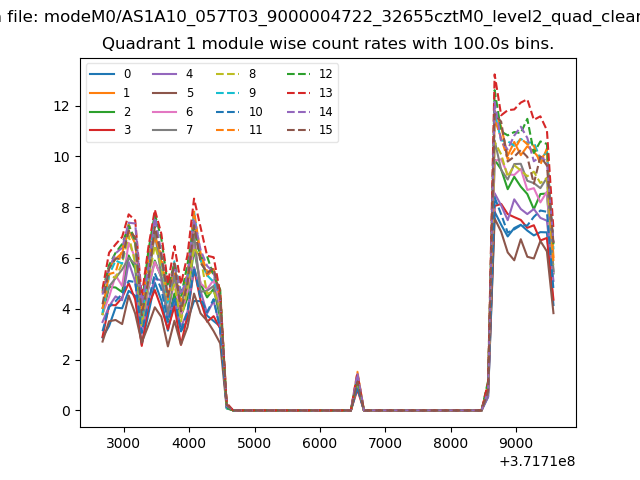
| Module-wise count rates for Quadrant A Data is divided into 100 sec bins |
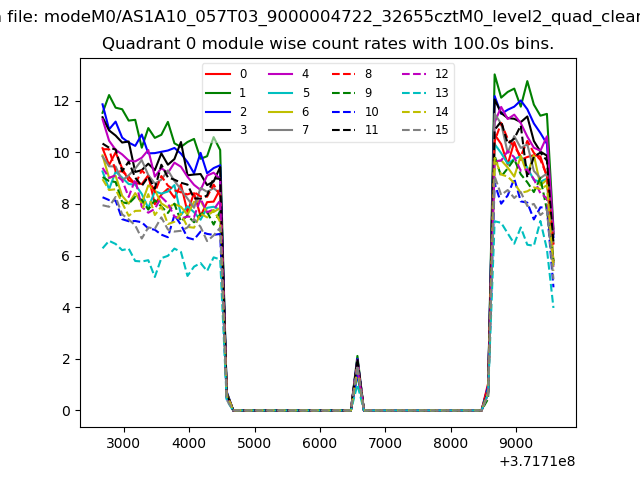 |
 |
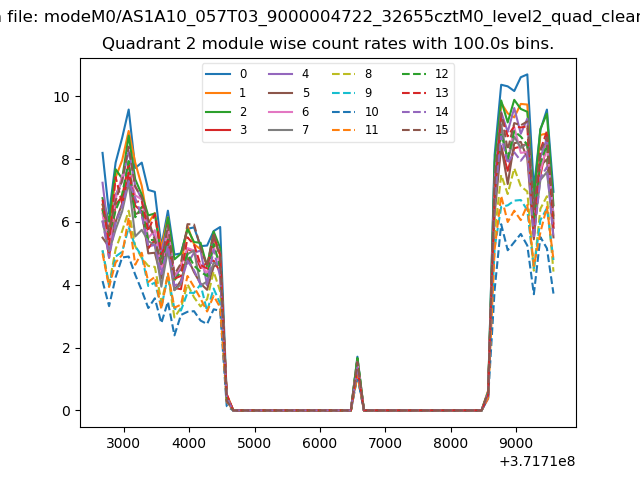
| Module-wise count rates for Quadrant B Data is divided into 100 sec bins |
 |
 |
| Module-wise count rates for Quadrant C Data is divided into 100 sec bins |
 |
 |
| Module-wise count rates for Quadrant D Data is divided into 100 sec bins |
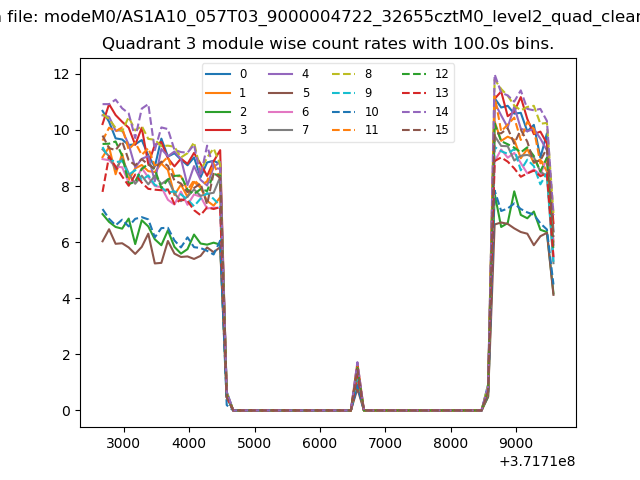 |
 |
| Parameter | Plot |
|---|---|
| CZT HV Monitor | 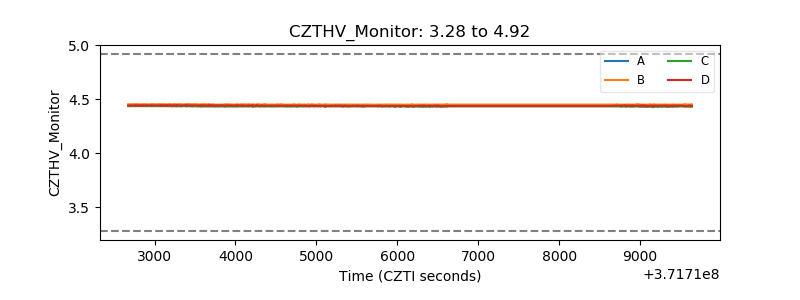 |
| D_VDD | 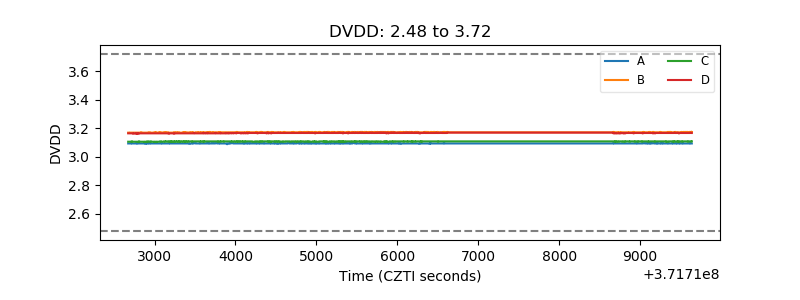 |
| Temperature 1 | 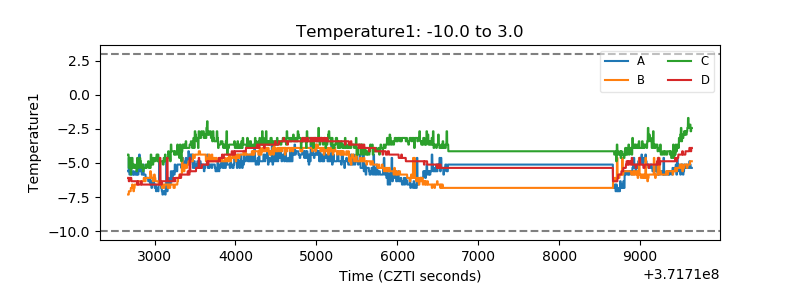 |
| Veto HV Monitor |  |
| Veto LLD |  |
| Alpha Counter | 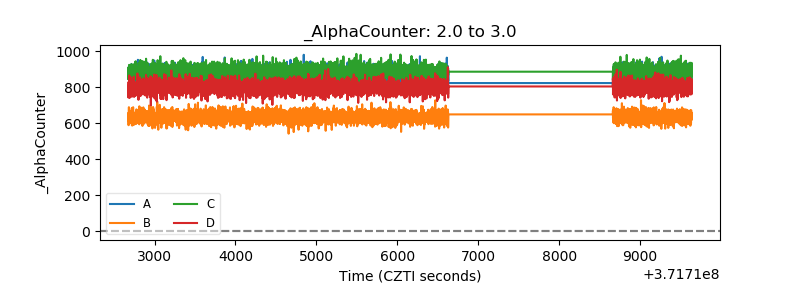 |
| _CPM_Rate | 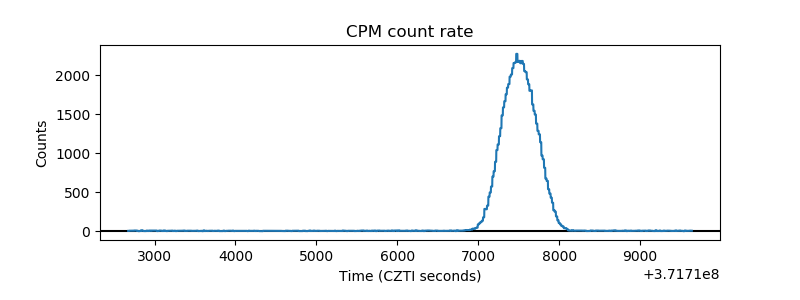 |
| CZT Counter | 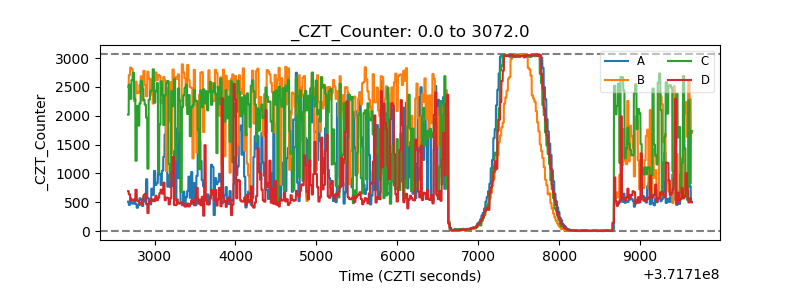 |
| +2.5 Volts monitor |  |
| +5 Volts monitor | 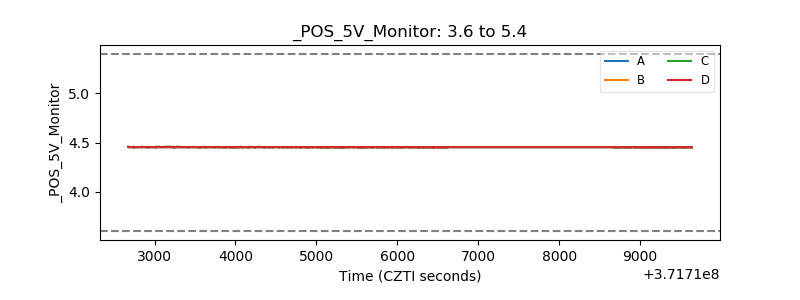 |
| _ROLL_ROT | 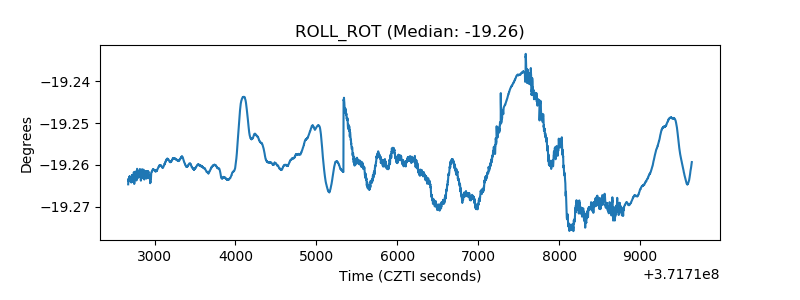 |
| _Roll_DEC | 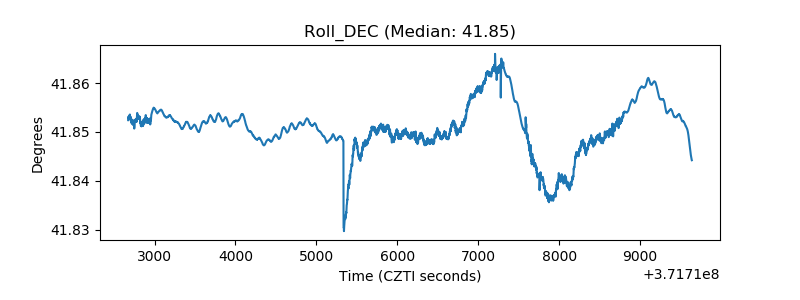 |
| _Roll_RA | 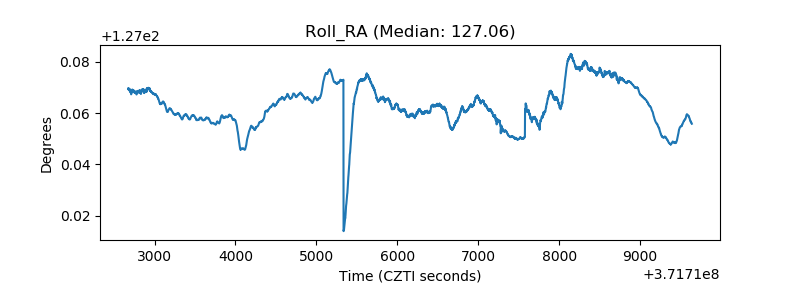 |
| Veto Counter |  |