| Param | Original file | Final file |
|---|---|---|
| Filename | modeM0/AS1A10_057T03_9000004722_32656cztM0_level2.evt | modeM0/AS1A10_057T03_9000004722_32656cztM0_level2_quad_clean.evt |
| Size (bytes) | 737,199,360 | 62,956,800 |
| Size | 703.0 MB | 60.0 MB |
| Events in quadrant A | 2,986,740 | 433,090 |
| Events in quadrant B | 7,223,027 | 399,380 |
| Events in quadrant C | 6,221,636 | 380,027 |
| Events in quadrant D | 5,562,237 | 346,175 |
| Mode M0 | |||
|---|---|---|---|
| Quadrant | BADHDUFLAG | Total packets | Discarded packets |
| A | 0 | 11828 | 3 |
| B | 0 | 24926 | 2 |
| C | 0 | 21995 | 2 |
| D | 0 | 20098 | 2 |
| Mode M9 | |||
|---|---|---|---|
| Quadrant | BADHDUFLAG | Total packets | Discarded packets |
| A | 0 | 24 | 0 |
| B | 0 | 24 | 0 |
| C | 0 | 24 | 0 |
| D | 0 | 25 | 0 |
| Mode SS | |||
|---|---|---|---|
| Quadrant | BADHDUFLAG | Total packets | Discarded packets |
| A | 0 | 100 | 0 |
| B | 0 | 100 | 0 |
| C | 0 | 100 | 0 |
| D | 0 | 100 | 0 |
| Quadrant | Total seconds | Saturated seconds | Saturation percentage |
|---|---|---|---|
| A | 4944 | 25 | 0.505663% |
| B | 4944 | 1489 | 30.117314% |
| C | 4944 | 950 | 19.215210% |
| D | 4944 | 966 | 19.538835% |
Noise dominated data is calculated using 1-second bins in cleaned event files. If a bin has >2000 counts, and if more than 50% of those come from <1% of pixels, then it is considered to be noise-dominated and hence unusable.
| Quadrant | # 1 sec bins | Bins with >0 counts | Bins with >2000 counts | High rate bins dominated by noise | Noise dominated (total time) | Noise dominated (detector-on time) | Marked lightcurve |
|---|---|---|---|---|---|---|---|
| A | 7066 | 4945 | 20 | 20 | 0.28% | 0.40% | 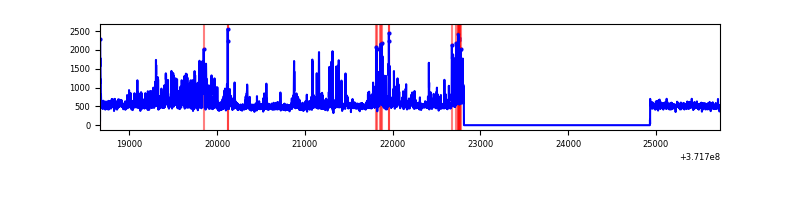 |
| B | 7066 | 4945 | 1352 | 1352 | 19.13% | 27.34% | 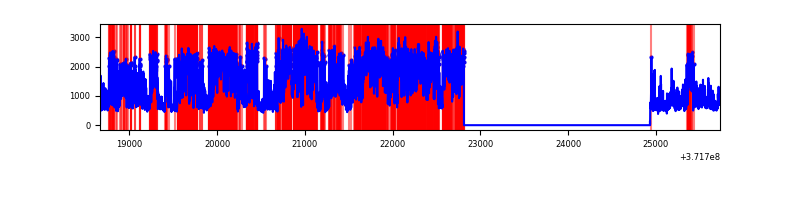 |
| C | 7066 | 4945 | 878 | 878 | 12.43% | 17.76% | 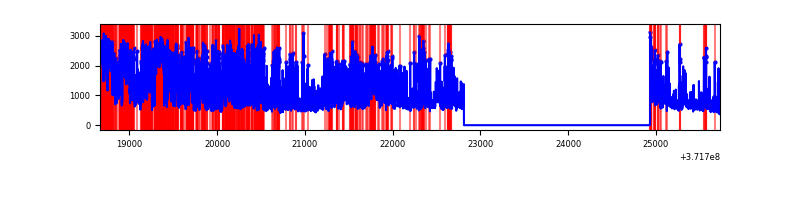 |
| D | 7066 | 4945 | 921 | 921 | 13.03% | 18.62% | 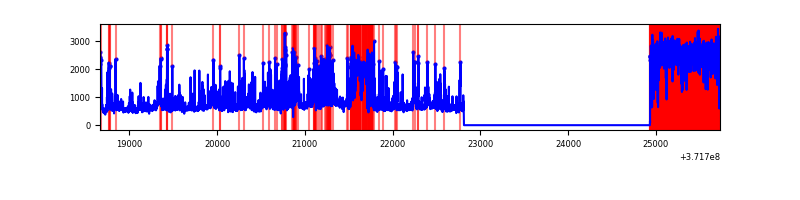 |
Top three noisy pixels from each quadrant. If the there are fewer than three noisy pixels in the level2.evt file, extra rows are filled as -1
| Pixel properties | Quadrant properties | ||||||
|---|---|---|---|---|---|---|---|
| Quadrant | DetID | PixID | Counts | Sigma | Mean | Median | Sigma |
| A | 1 | 39 | 479013 | 3842.74 | 628 | 619 | 124.5 |
| A | 1 | 23 | 17881 | 138.65 | 628 | 619 | 124.5 |
| A | 15 | 233 | 15123 | 116.5 | 628 | 619 | 124.5 |
| B | 3 | 43 | 3407402 | 31487.12 | 578 | 569 | 108.2 |
| B | 3 | 26 | 408433 | 3769.62 | 578 | 569 | 108.2 |
| B | 3 | 234 | 398069 | 3673.83 | 578 | 569 | 108.2 |
| C | 8 | 35 | 1187570 | 9016.37 | 562 | 567 | 131.6 |
| C | 8 | 147 | 709671 | 5386.29 | 562 | 567 | 131.6 |
| C | 10 | 9 | 645027 | 4895.26 | 562 | 567 | 131.6 |
| D | 7 | 80 | 1596848 | 12499.72 | 547 | 537 | 127.7 |
| D | 8 | 195 | 511304 | 3999.5 | 547 | 537 | 127.7 |
| D | 12 | 218 | 329631 | 2576.93 | 547 | 537 | 127.7 |
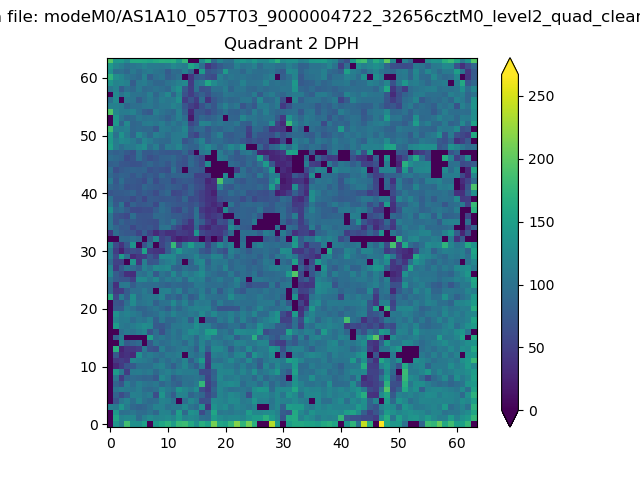
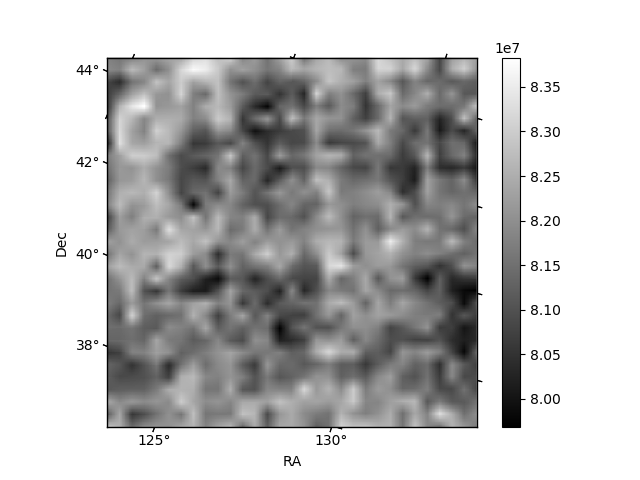
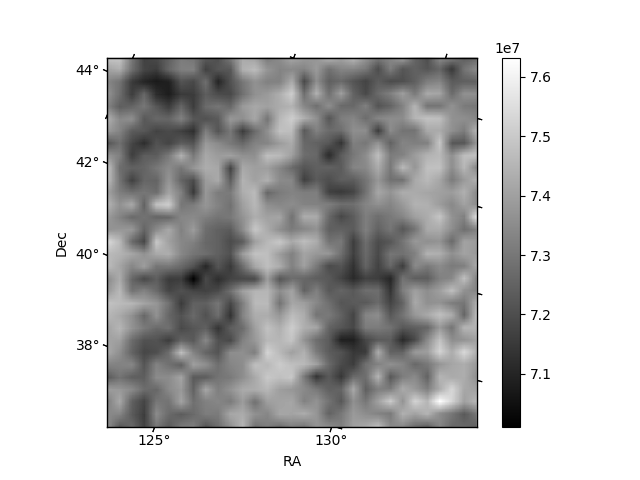
Histogram calculated using DETX and DETY for each event in the final _common_clean file
| Quadrant A | 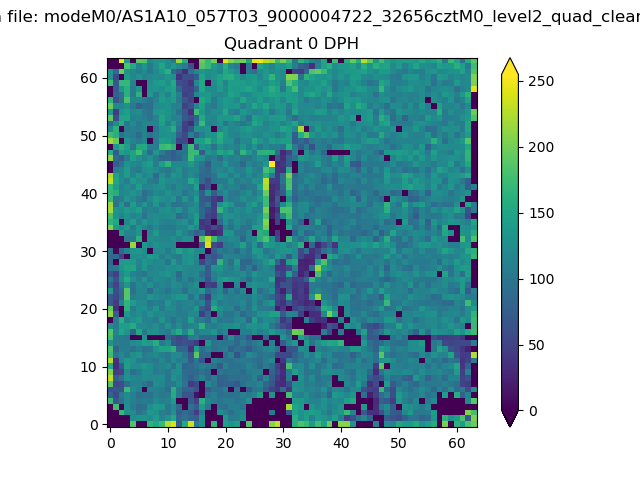 |
 |
Quadrant B |
|---|---|---|---|
| Quadrant D |  |
 |
Quadrant C |
| Plot type | Count rate plots | Images |
|---|---|---|
| Comparison with Poisson distribution Blue bars denote a histogram of data divided into 1 sec bins. Red curve is a Poisson curve with rate = median count rate of data. |
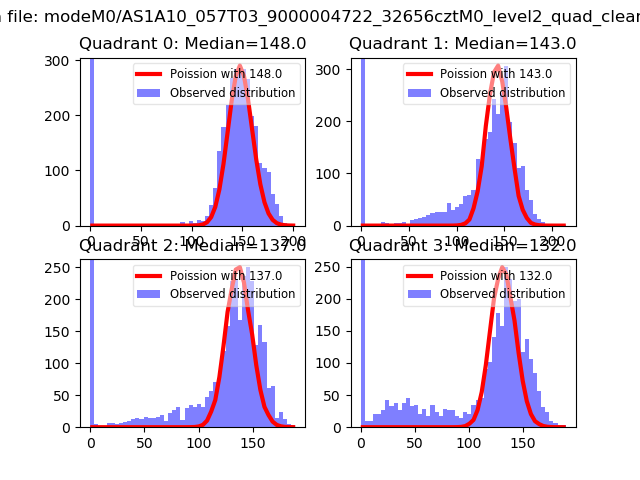 |
 |
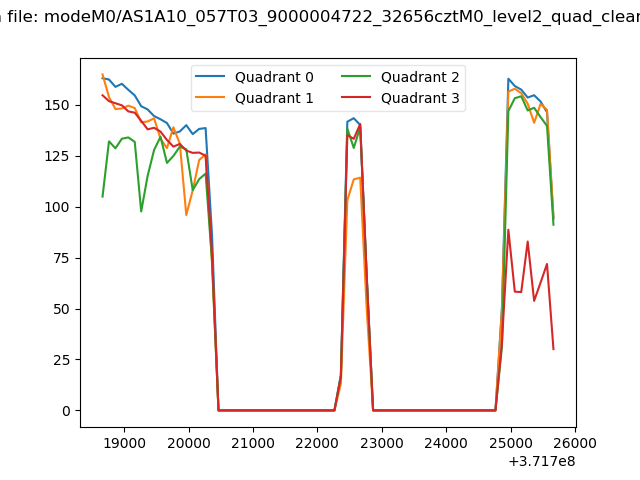
| Quadrant-wise count rates Data is divided into 100 sec bins |
 |
|
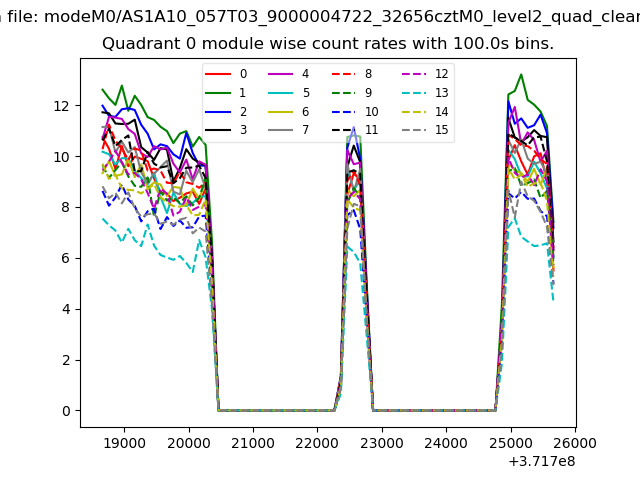
| Module-wise count rates for Quadrant A Data is divided into 100 sec bins |
 |
 |
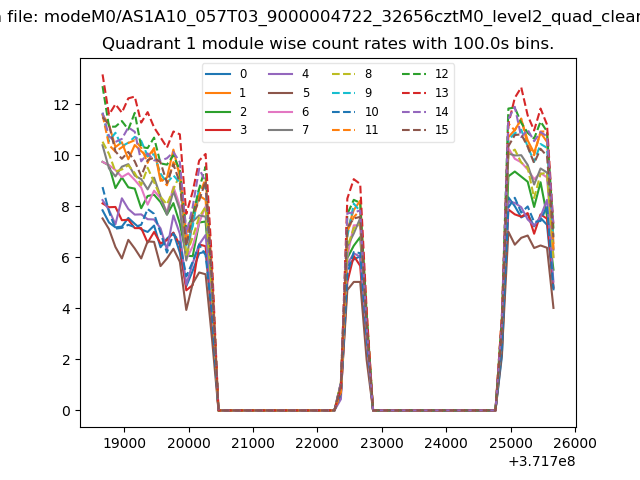
| Module-wise count rates for Quadrant B Data is divided into 100 sec bins |
 |
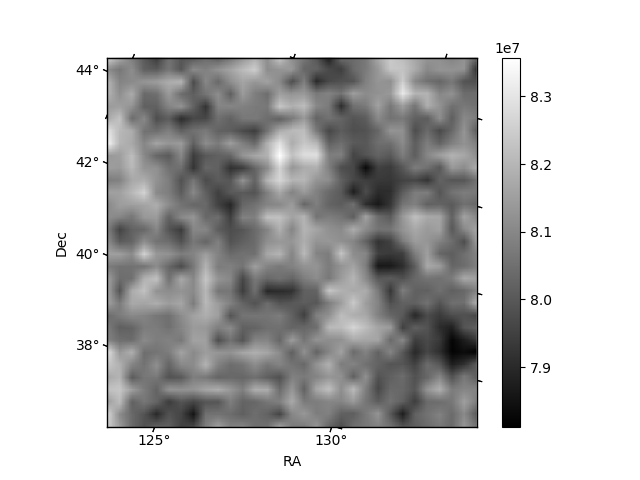 |
| Module-wise count rates for Quadrant C Data is divided into 100 sec bins |
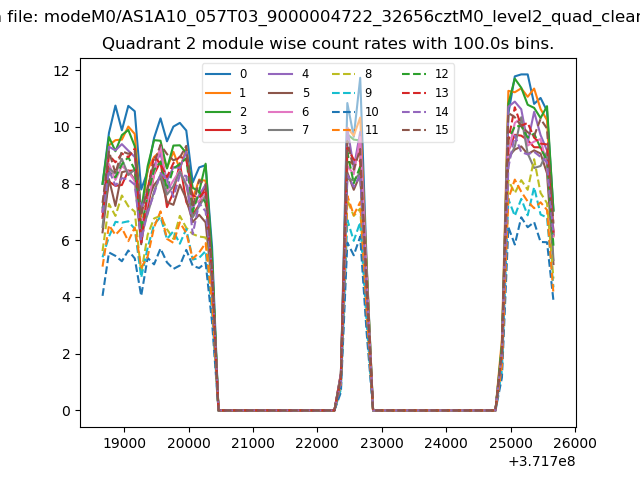 |
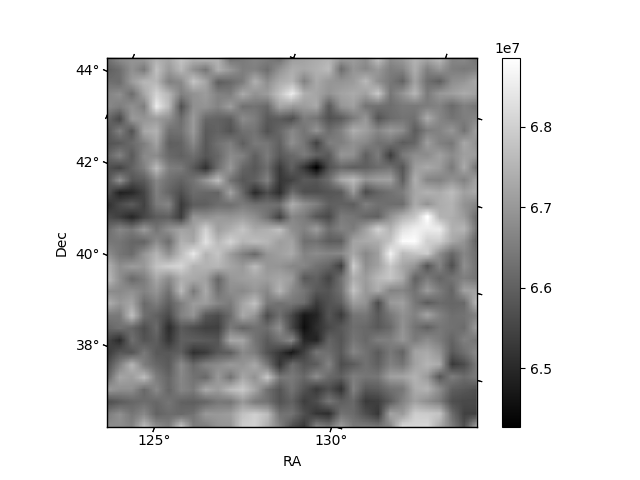 |
| Module-wise count rates for Quadrant D Data is divided into 100 sec bins |
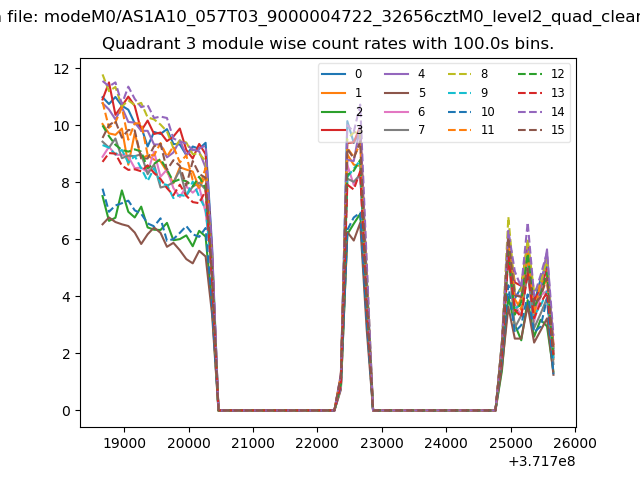 |
 |
| Parameter | Plot |
|---|---|
| CZT HV Monitor |  |
| D_VDD | 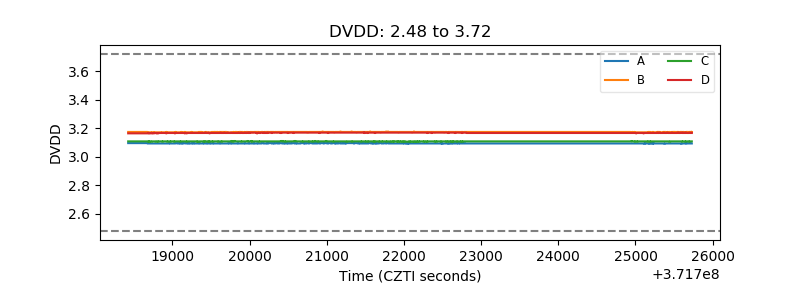 |
| Temperature 1 |  |
| Veto HV Monitor | 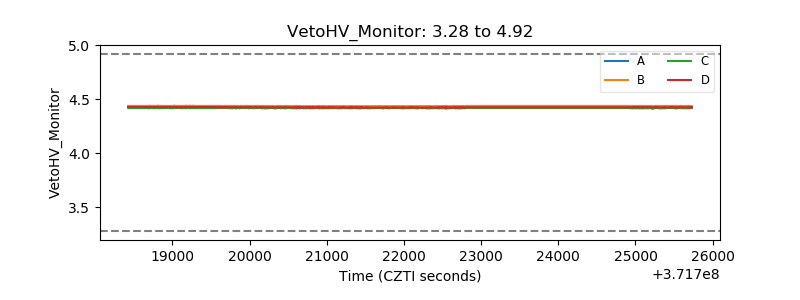 |
| Veto LLD | 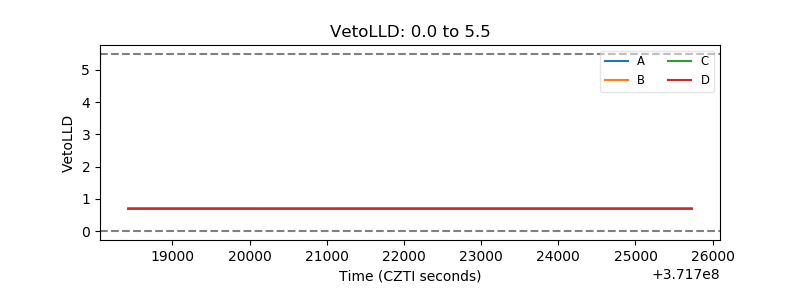 |
| Alpha Counter | 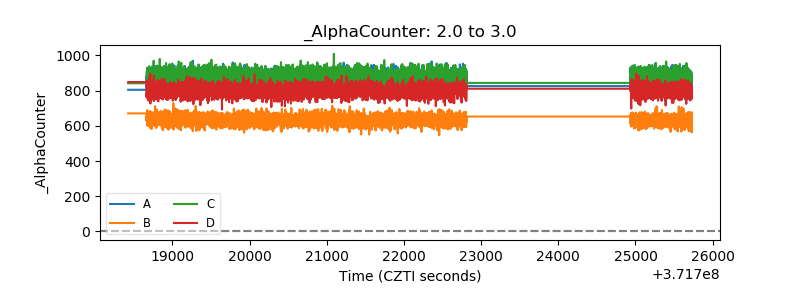 |
| _CPM_Rate | 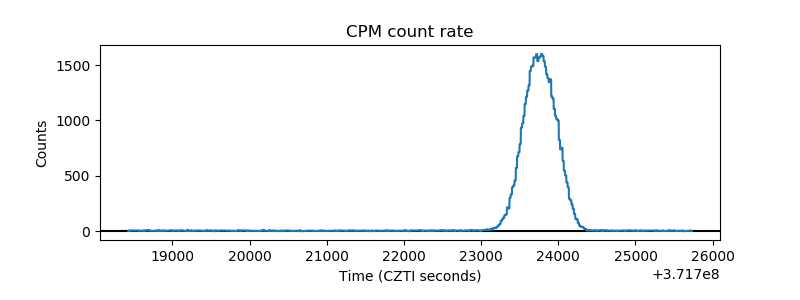 |
| CZT Counter | 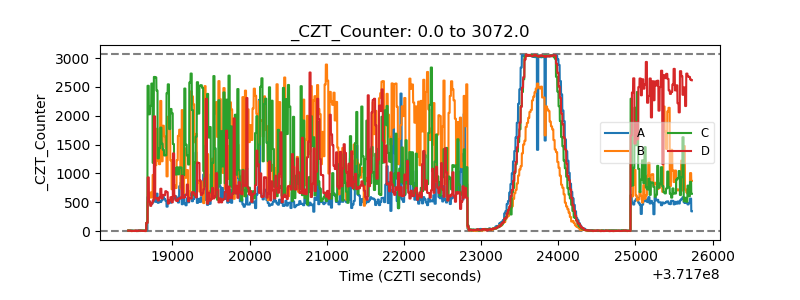 |
| +2.5 Volts monitor |  |
| +5 Volts monitor | 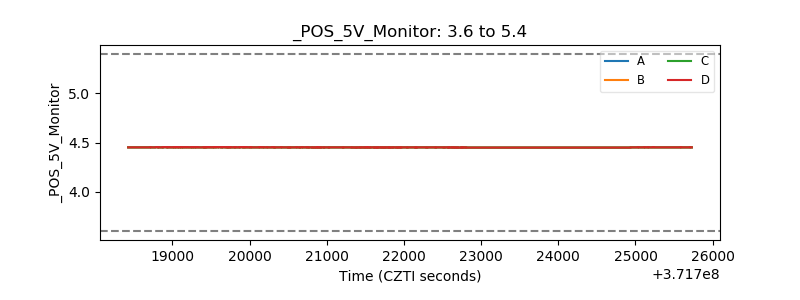 |
| _ROLL_ROT | 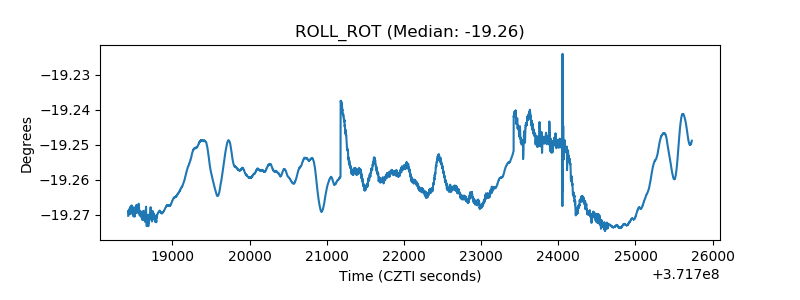 |
| _Roll_DEC | 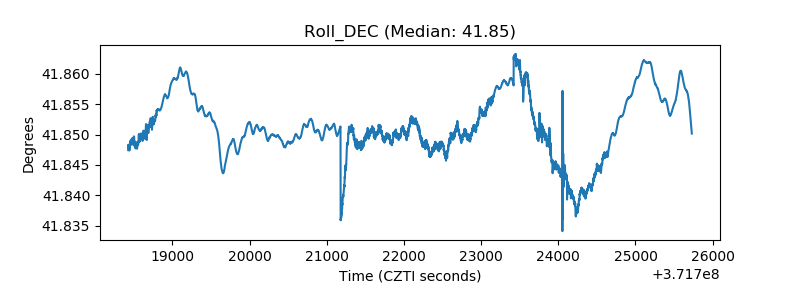 |
| _Roll_RA | 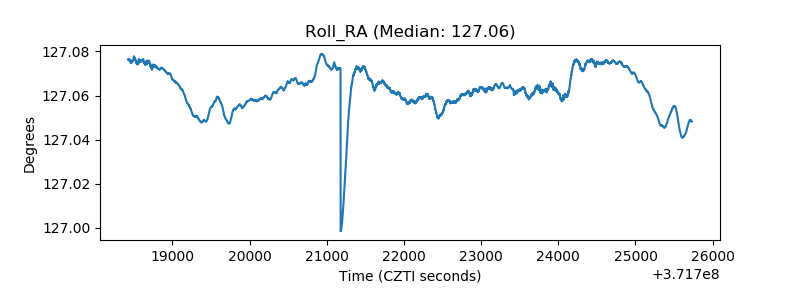 |
| Veto Counter | 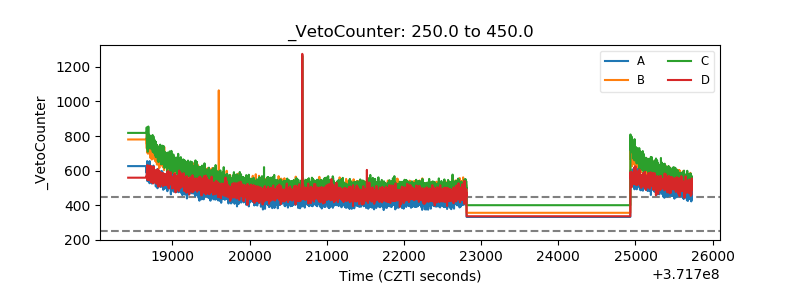 |