| Param | Original file | Final file |
|---|---|---|
| Filename | modeM0/AS1A10_057T03_9000004722_32657cztM0_level2.evt | modeM0/AS1A10_057T03_9000004722_32657cztM0_level2_quad_clean.evt |
| Size (bytes) | 731,361,600 | 59,760,000 |
| Size | 697.5 MB | 57.0 MB |
| Events in quadrant A | 3,153,177 | 395,278 |
| Events in quadrant B | 5,404,556 | 402,831 |
| Events in quadrant C | 4,760,125 | 389,352 |
| Events in quadrant D | 8,502,498 | 278,114 |
| Mode M0 | |||
|---|---|---|---|
| Quadrant | BADHDUFLAG | Total packets | Discarded packets |
| A | 0 | 12160 | 3 |
| B | 0 | 19558 | 2 |
| C | 0 | 17582 | 2 |
| D | 0 | 28735 | 2 |
| Mode M9 | |||
|---|---|---|---|
| Quadrant | BADHDUFLAG | Total packets | Discarded packets |
| A | 0 | 21 | 0 |
| B | 0 | 21 | 0 |
| C | 0 | 21 | 0 |
| D | 0 | 21 | 0 |
| Mode SS | |||
|---|---|---|---|
| Quadrant | BADHDUFLAG | Total packets | Discarded packets |
| A | 0 | 100 | 0 |
| B | 0 | 100 | 0 |
| C | 0 | 100 | 0 |
| D | 0 | 100 | 0 |
| Quadrant | Total seconds | Saturated seconds | Saturation percentage |
|---|---|---|---|
| A | 4884 | 242 | 4.954955% |
| B | 4884 | 570 | 11.670762% |
| C | 4884 | 527 | 10.790336% |
| D | 4885 | 2159 | 44.196520% |
Noise dominated data is calculated using 1-second bins in cleaned event files. If a bin has >2000 counts, and if more than 50% of those come from <1% of pixels, then it is considered to be noise-dominated and hence unusable.
| Quadrant | # 1 sec bins | Bins with >0 counts | Bins with >2000 counts | High rate bins dominated by noise | Noise dominated (total time) | Noise dominated (detector-on time) | Marked lightcurve |
|---|---|---|---|---|---|---|---|
| A | 7037 | 4885 | 227 | 227 | 3.23% | 4.65% | 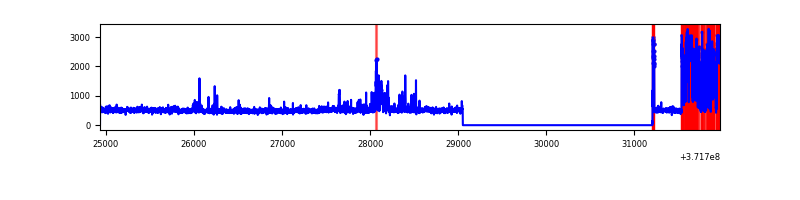 |
| B | 7037 | 4885 | 475 | 475 | 6.75% | 9.72% | 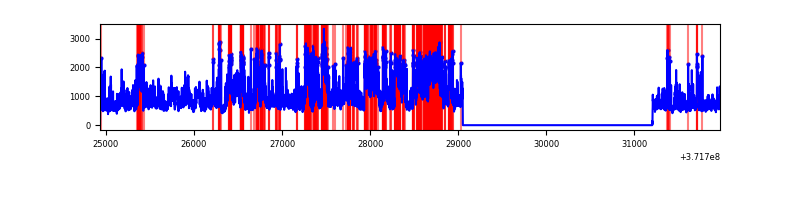 |
| C | 7037 | 4885 | 387 | 387 | 5.50% | 7.92% | 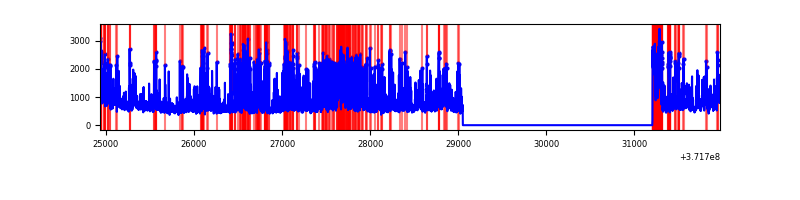 |
| D | 7038 | 4886 | 2169 | 2169 | 30.82% | 44.39% | 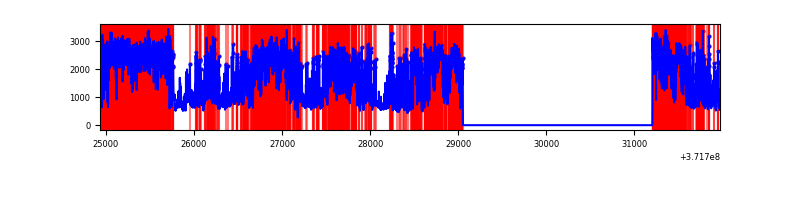 |
Top three noisy pixels from each quadrant. If the there are fewer than three noisy pixels in the level2.evt file, extra rows are filled as -1
| Pixel properties | Quadrant properties | ||||||
|---|---|---|---|---|---|---|---|
| Quadrant | DetID | PixID | Counts | Sigma | Mean | Median | Sigma |
| A | 15 | 249 | 627335 | 5271.32 | 599 | 589 | 118.9 |
| A | 1 | 39 | 116974 | 978.87 | 599 | 589 | 118.9 |
| A | 9 | 191 | 45070 | 374.11 | 599 | 589 | 118.9 |
| B | 3 | 43 | 1656671 | 14793.73 | 597 | 587 | 111.9 |
| B | 3 | 220 | 328128 | 2925.91 | 597 | 587 | 111.9 |
| B | 0 | 219 | 195511 | 1741.25 | 597 | 587 | 111.9 |
| C | 8 | 35 | 921670 | 6959.03 | 564 | 567 | 132.4 |
| C | 8 | 147 | 498831 | 3764.44 | 564 | 567 | 132.4 |
| C | 0 | 10 | 430482 | 3248.05 | 564 | 567 | 132.4 |
| D | 7 | 80 | 2209440 | 19573.28 | 479 | 468 | 112.9 |
| D | 12 | 222 | 1930990 | 17105.98 | 479 | 468 | 112.9 |
| D | 2 | 250 | 589488 | 5219.19 | 479 | 468 | 112.9 |
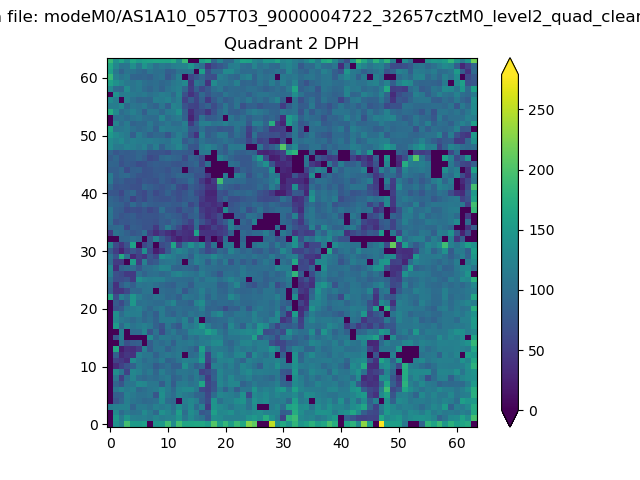
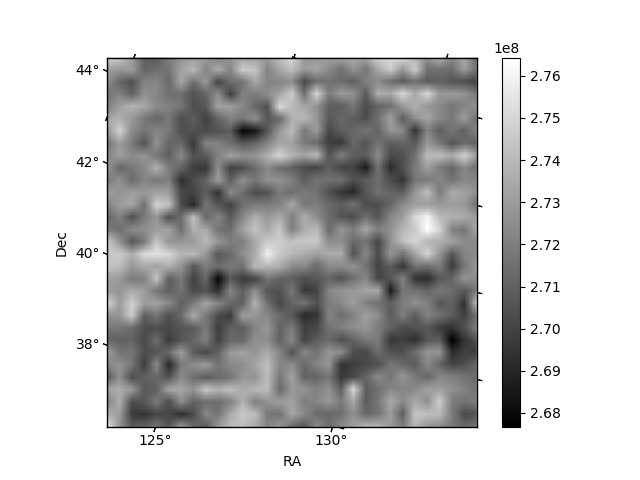
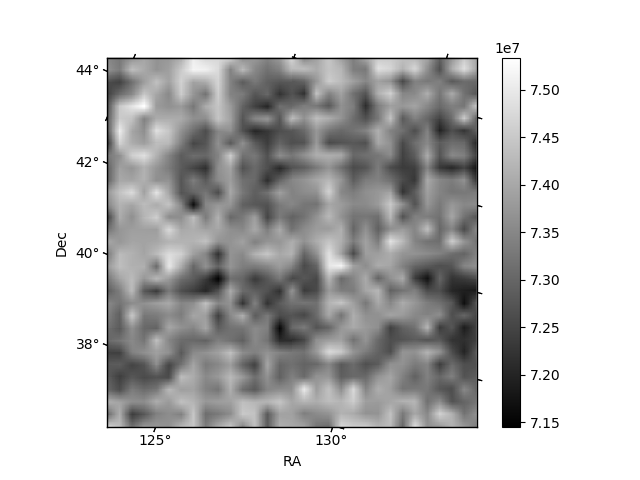
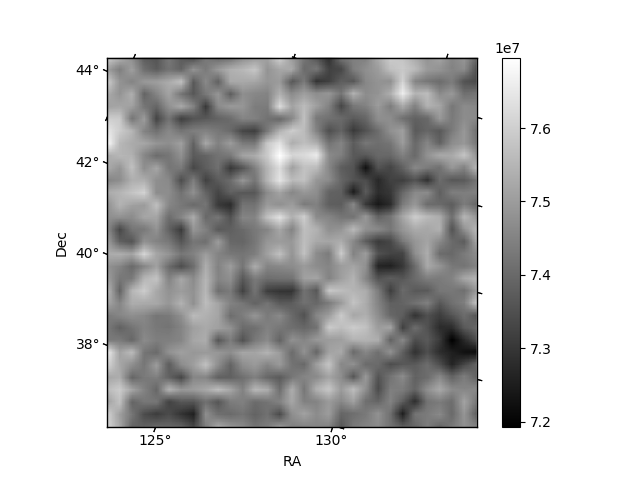
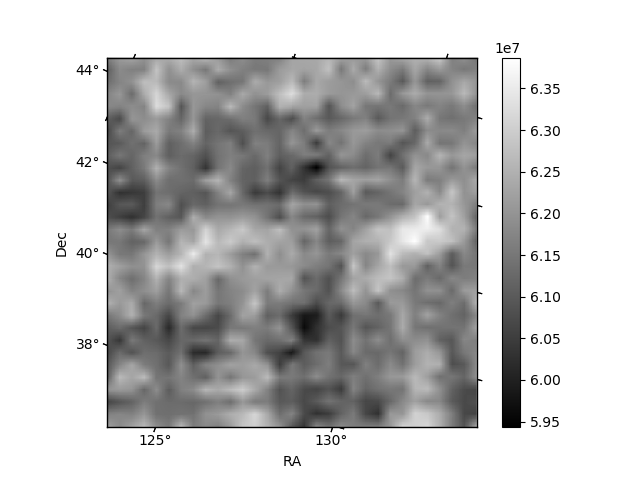
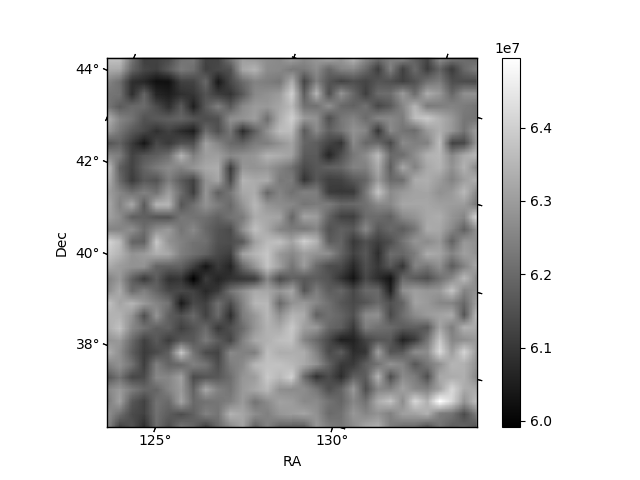
Histogram calculated using DETX and DETY for each event in the final _common_clean file
| Quadrant A | 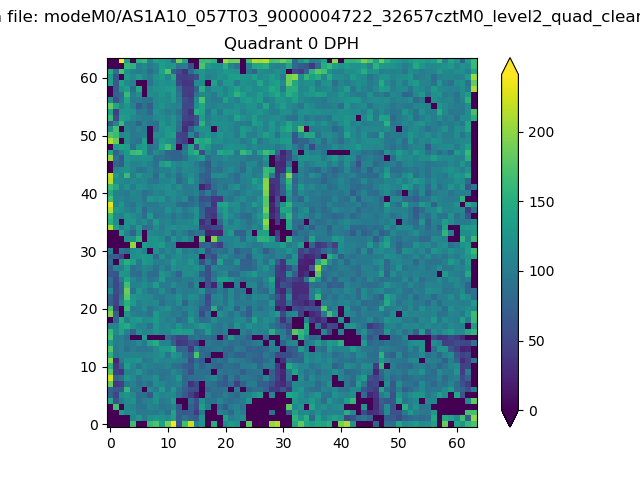 |
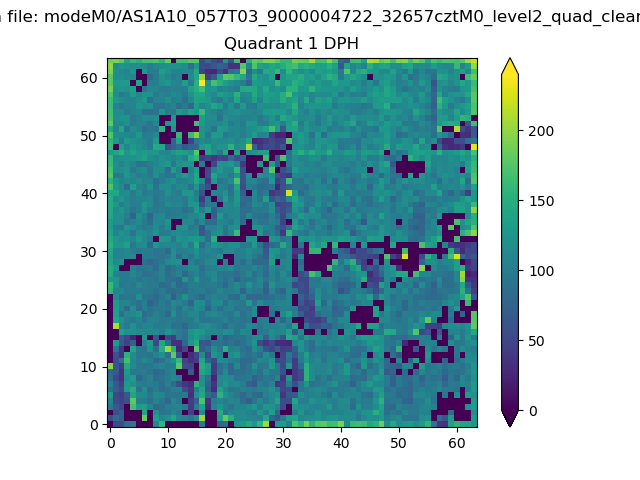 |
Quadrant B |
|---|---|---|---|
| Quadrant D | 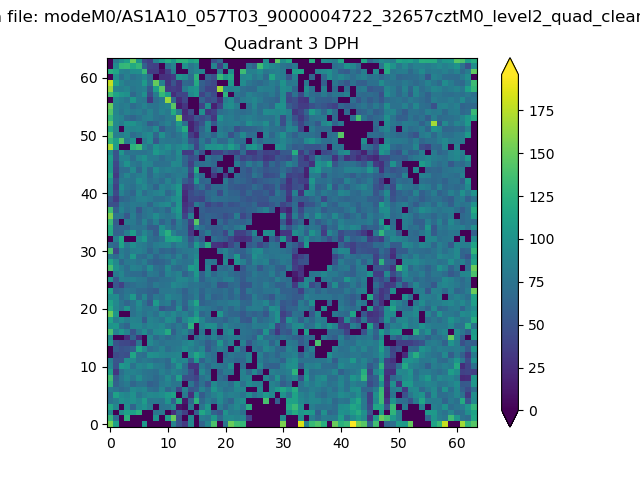 |
 |
Quadrant C |
| Plot type | Count rate plots | Images |
|---|---|---|
| Comparison with Poisson distribution Blue bars denote a histogram of data divided into 1 sec bins. Red curve is a Poisson curve with rate = median count rate of data. |
 |
 |
| Quadrant-wise count rates Data is divided into 100 sec bins |
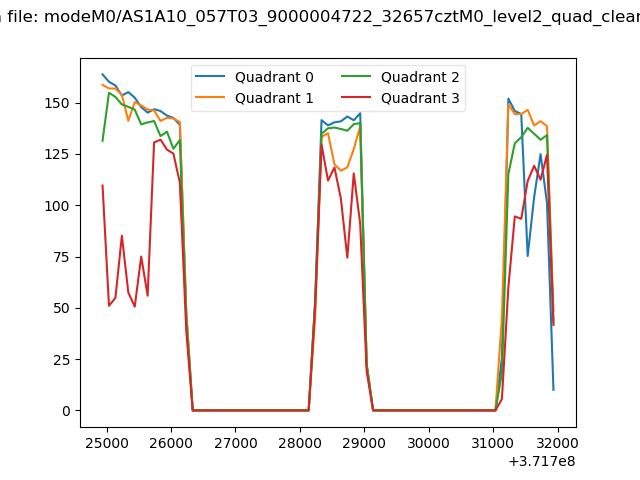 |
|
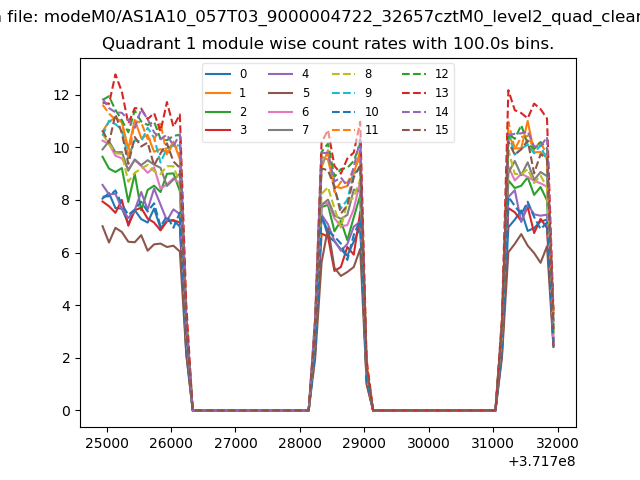
| Module-wise count rates for Quadrant A Data is divided into 100 sec bins |
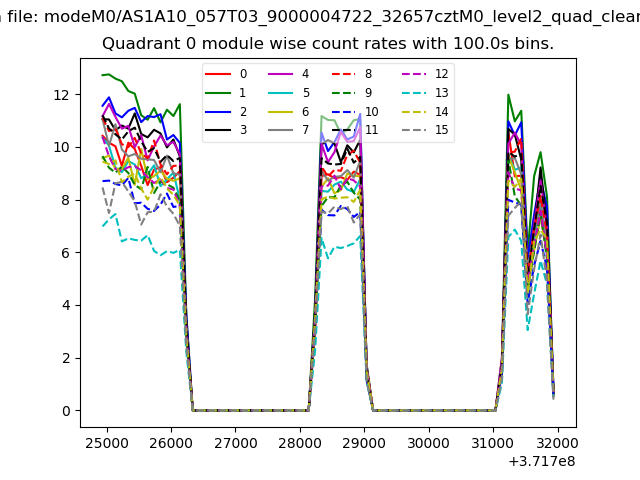 |
 |
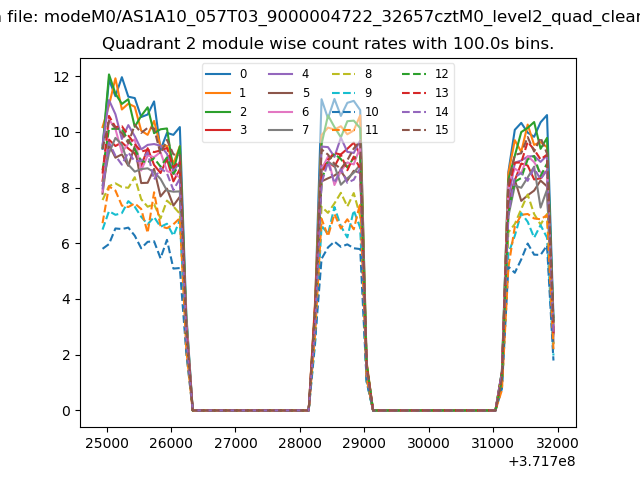
| Module-wise count rates for Quadrant B Data is divided into 100 sec bins |
 |
 |
| Module-wise count rates for Quadrant C Data is divided into 100 sec bins |
 |
 |
| Module-wise count rates for Quadrant D Data is divided into 100 sec bins |
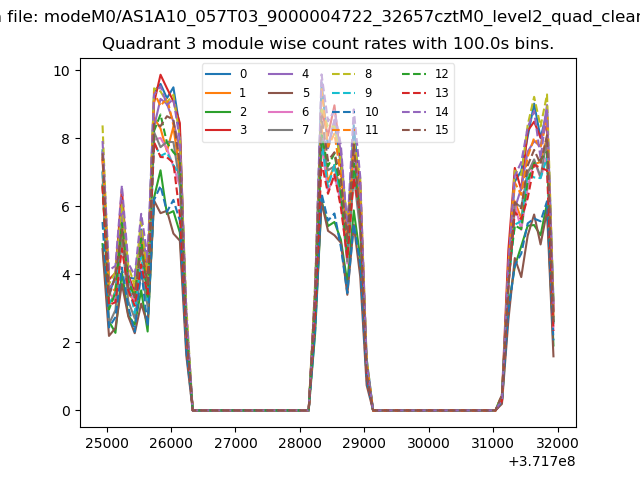 |
 |
| Parameter | Plot |
|---|---|
| CZT HV Monitor | 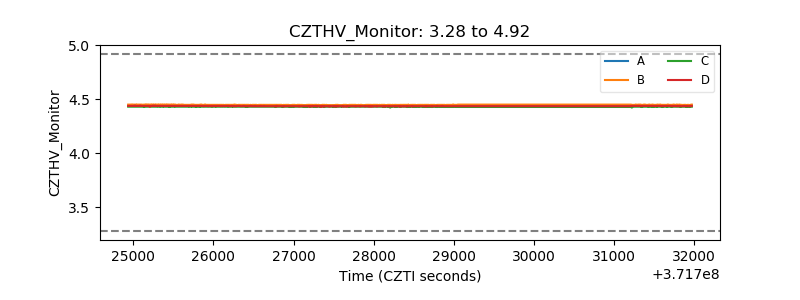 |
| D_VDD |  |
| Temperature 1 | 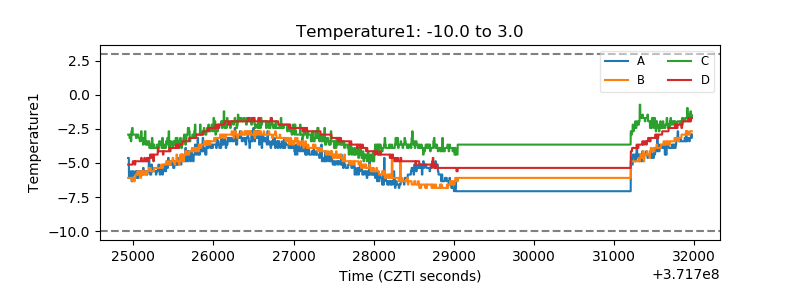 |
| Veto HV Monitor |  |
| Veto LLD | 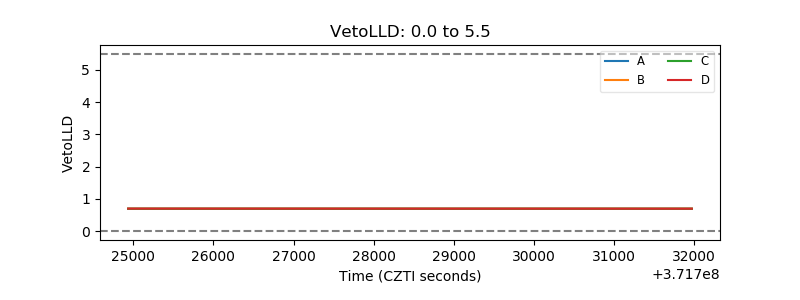 |
| Alpha Counter | 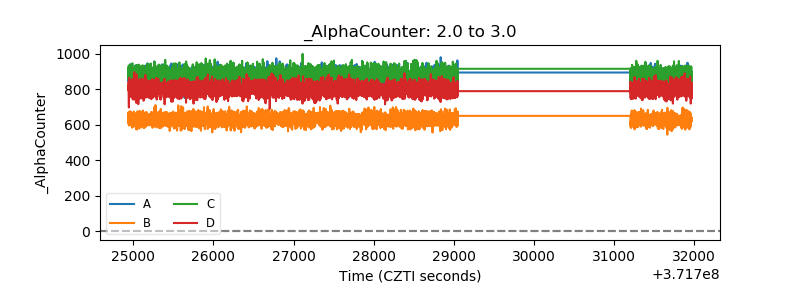 |
| _CPM_Rate | 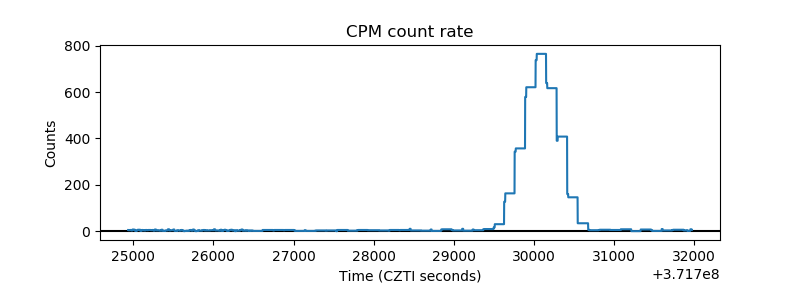 |
| CZT Counter | 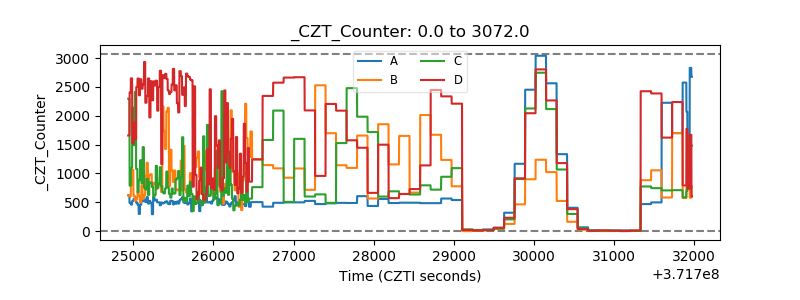 |
| +2.5 Volts monitor |  |
| +5 Volts monitor |  |
| _ROLL_ROT | 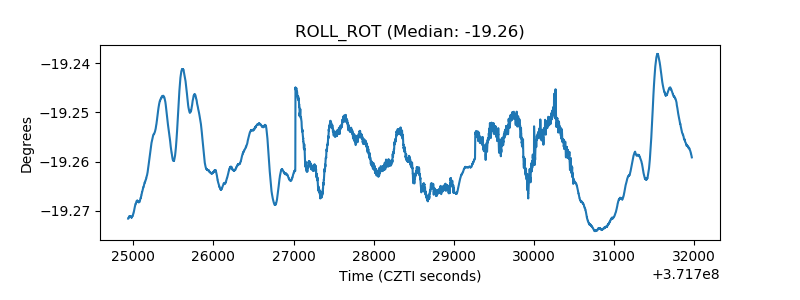 |
| _Roll_DEC | 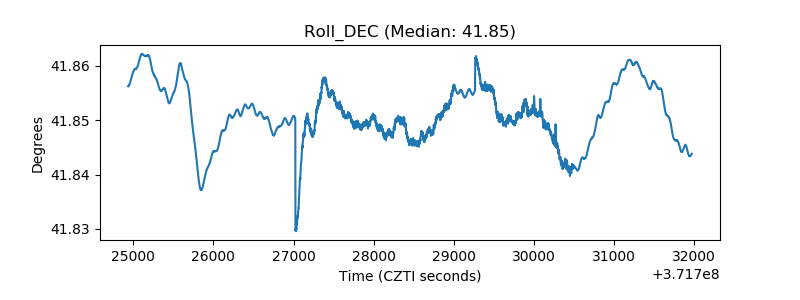 |
| _Roll_RA | 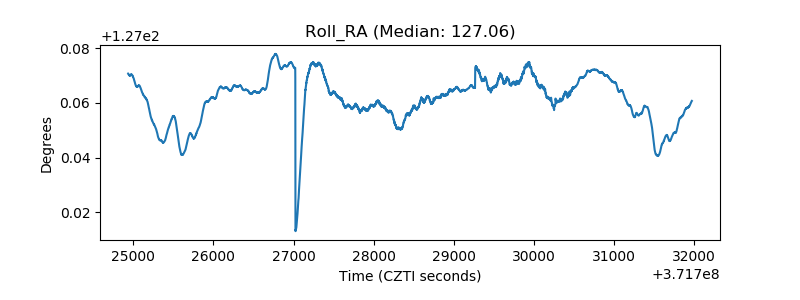 |
| Veto Counter |  |