| Param | Original file | Final file |
|---|---|---|
| Filename | modeM0/AS1A10_057T03_9000004722_32658cztM0_level2.evt | modeM0/AS1A10_057T03_9000004722_32658cztM0_level2_quad_clean.evt |
| Size (bytes) | 928,486,080 | 54,360,000 |
| Size | 885.5 MB | 51.8 MB |
| Events in quadrant A | 6,193,752 | 328,702 |
| Events in quadrant B | 7,167,534 | 336,490 |
| Events in quadrant C | 5,670,461 | 330,103 |
| Events in quadrant D | 8,749,895 | 295,961 |
| Mode M0 | |||
|---|---|---|---|
| Quadrant | BADHDUFLAG | Total packets | Discarded packets |
| A | 0 | 21560 | 3 |
| B | 0 | 24870 | 2 |
| C | 0 | 20251 | 2 |
| D | 0 | 29502 | 2 |
| Mode M9 | |||
|---|---|---|---|
| Quadrant | BADHDUFLAG | Total packets | Discarded packets |
| A | 0 | 25 | 0 |
| B | 0 | 25 | 0 |
| C | 0 | 25 | 0 |
| D | 0 | 26 | 0 |
| Mode SS | |||
|---|---|---|---|
| Quadrant | BADHDUFLAG | Total packets | Discarded packets |
| A | 0 | 102 | 0 |
| B | 0 | 102 | 0 |
| C | 0 | 102 | 0 |
| D | 0 | 102 | 0 |
| Quadrant | Total seconds | Saturated seconds | Saturation percentage |
|---|---|---|---|
| A | 5043 | 1569 | 31.112433% |
| B | 5043 | 1350 | 26.769780% |
| C | 5043 | 847 | 16.795558% |
| D | 5043 | 2377 | 47.134642% |
Noise dominated data is calculated using 1-second bins in cleaned event files. If a bin has >2000 counts, and if more than 50% of those come from <1% of pixels, then it is considered to be noise-dominated and hence unusable.
| Quadrant | # 1 sec bins | Bins with >0 counts | Bins with >2000 counts | High rate bins dominated by noise | Noise dominated (total time) | Noise dominated (detector-on time) | Marked lightcurve |
|---|---|---|---|---|---|---|---|
| A | 7107 | 5044 | 1517 | 1517 | 21.35% | 30.08% | 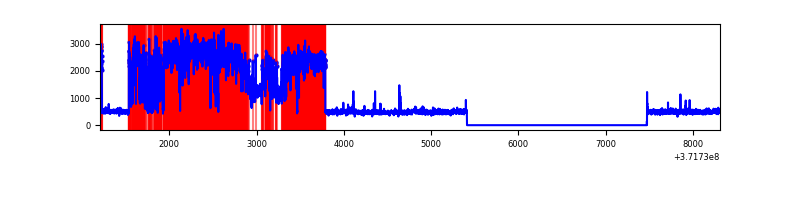 |
| B | 7107 | 5044 | 1139 | 1139 | 16.03% | 22.58% | 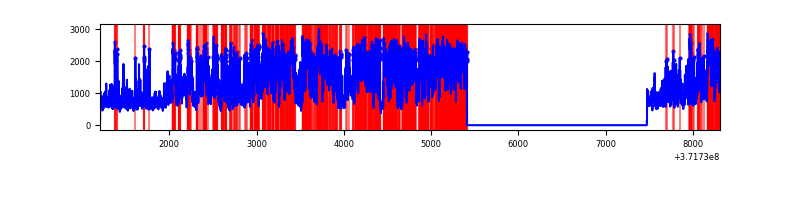 |
| C | 7107 | 5044 | 667 | 667 | 9.39% | 13.22% | 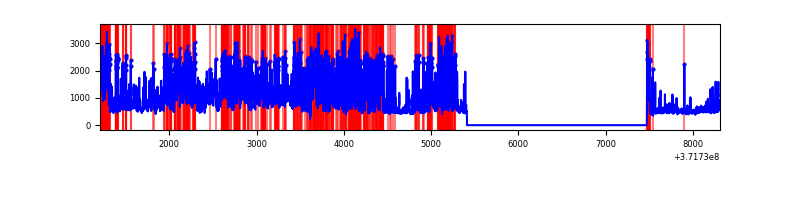 |
| D | 7107 | 5044 | 2364 | 2364 | 33.26% | 46.87% | 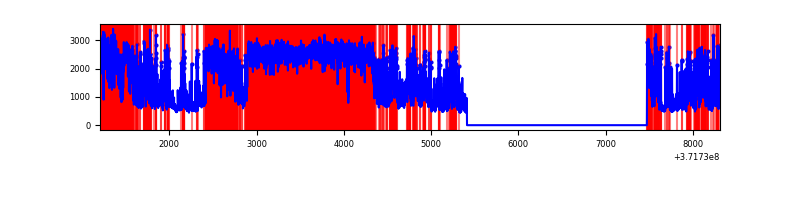 |
Top three noisy pixels from each quadrant. If the there are fewer than three noisy pixels in the level2.evt file, extra rows are filled as -1
| Pixel properties | Quadrant properties | ||||||
|---|---|---|---|---|---|---|---|
| Quadrant | DetID | PixID | Counts | Sigma | Mean | Median | Sigma |
| A | 15 | 249 | 4103951 | 39936.24 | 514 | 506 | 102.7 |
| A | 9 | 191 | 43466 | 418.1 | 514 | 506 | 102.7 |
| A | 0 | 215 | 9778 | 90.24 | 514 | 506 | 102.7 |
| B | 3 | 43 | 2240573 | 20489.16 | 581 | 571 | 109.3 |
| B | 0 | 219 | 768626 | 7025.35 | 581 | 571 | 109.3 |
| B | 12 | 1 | 515562 | 4710.59 | 581 | 571 | 109.3 |
| C | 8 | 35 | 1036256 | 8047.26 | 554 | 559 | 128.7 |
| C | 10 | 9 | 672705 | 5222.51 | 554 | 559 | 128.7 |
| C | 0 | 10 | 617546 | 4793.93 | 554 | 559 | 128.7 |
| D | 12 | 33 | 3254451 | 29983.63 | 458 | 450 | 108.5 |
| D | 12 | 222 | 1451350 | 13369.16 | 458 | 450 | 108.5 |
| D | 7 | 80 | 431208 | 3969.17 | 458 | 450 | 108.5 |
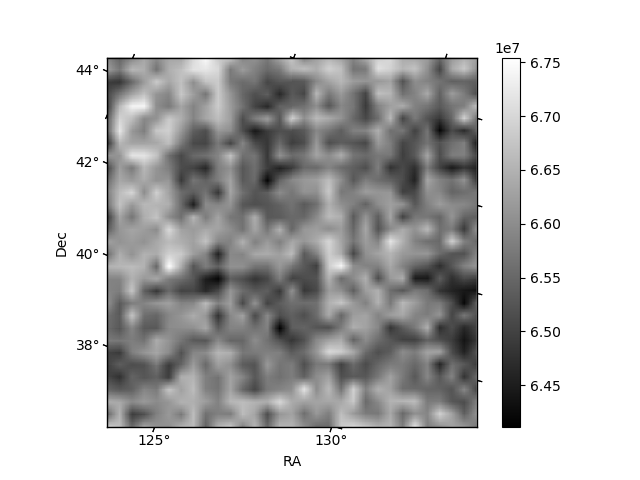
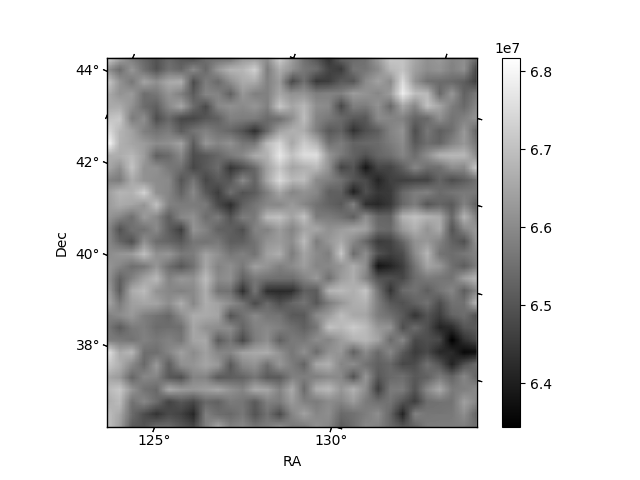
Histogram calculated using DETX and DETY for each event in the final _common_clean file
| Quadrant A |  |
 |
Quadrant B |
|---|---|---|---|
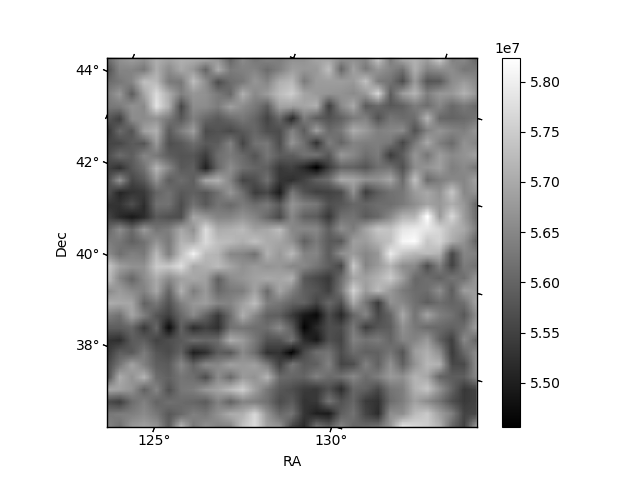
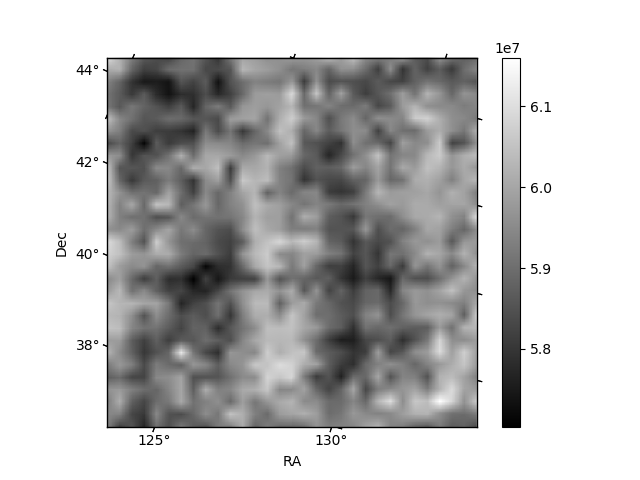
| Quadrant D | 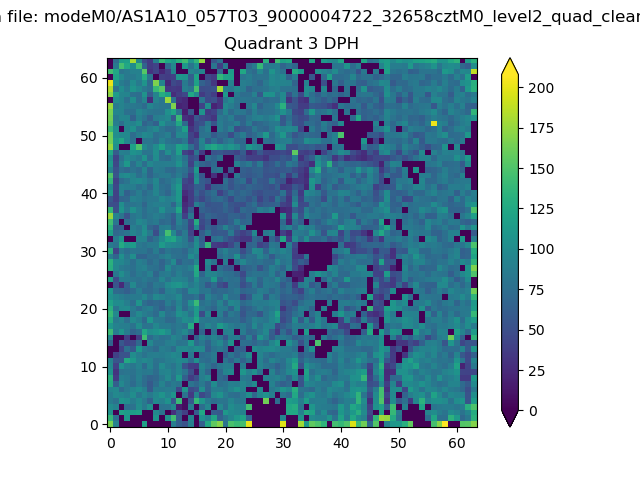 |
 |
Quadrant C |
| Plot type | Count rate plots | Images |
|---|---|---|
| Comparison with Poisson distribution Blue bars denote a histogram of data divided into 1 sec bins. Red curve is a Poisson curve with rate = median count rate of data. |
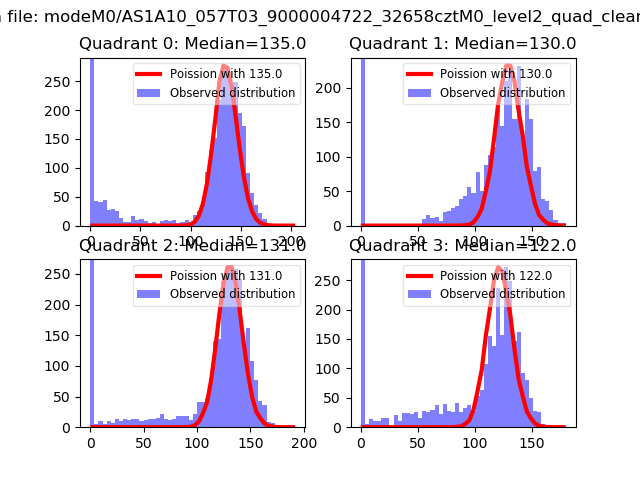 |
 |
| Quadrant-wise count rates Data is divided into 100 sec bins |
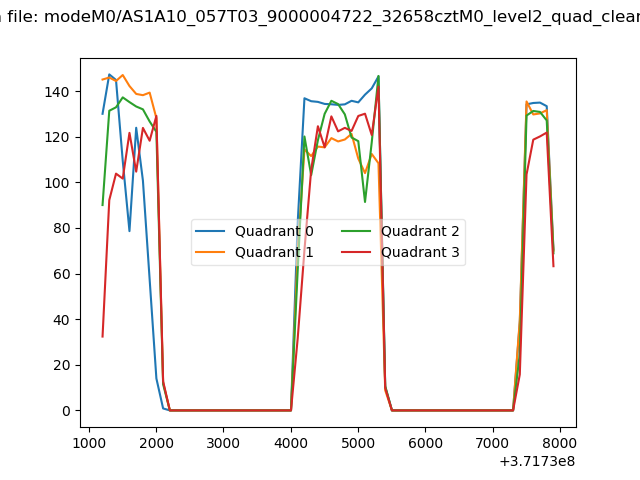 |
|
| Module-wise count rates for Quadrant A Data is divided into 100 sec bins |
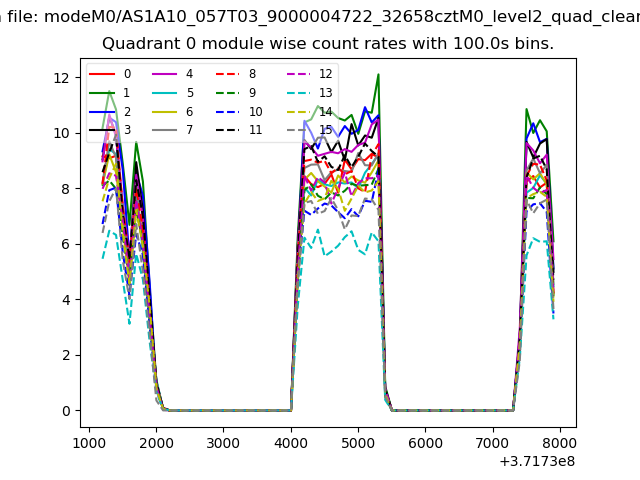 |
 |
| Module-wise count rates for Quadrant B Data is divided into 100 sec bins |
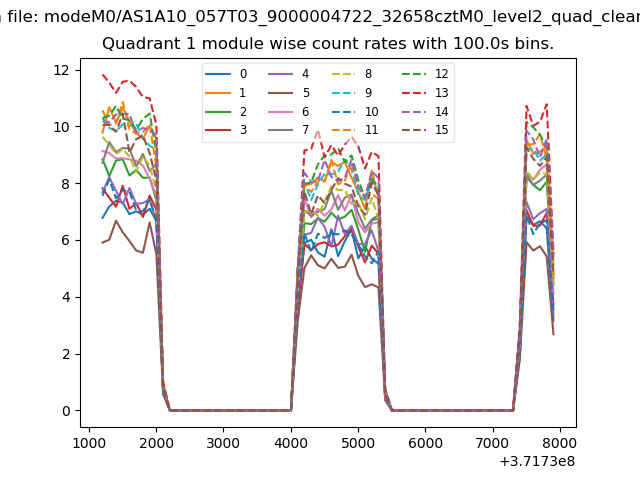 |
 |
| Module-wise count rates for Quadrant C Data is divided into 100 sec bins |
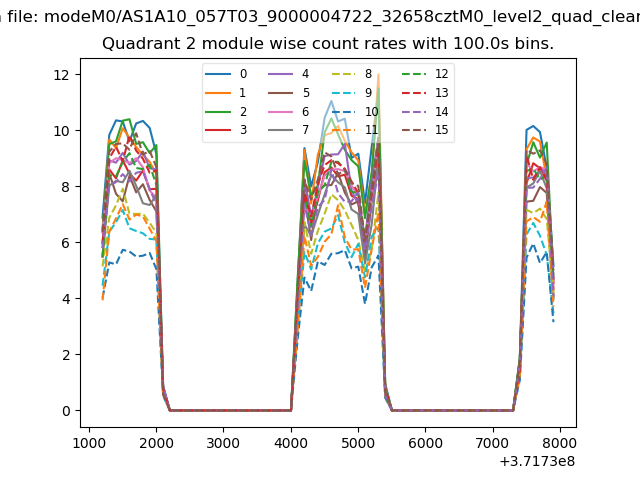 |
 |
| Module-wise count rates for Quadrant D Data is divided into 100 sec bins |
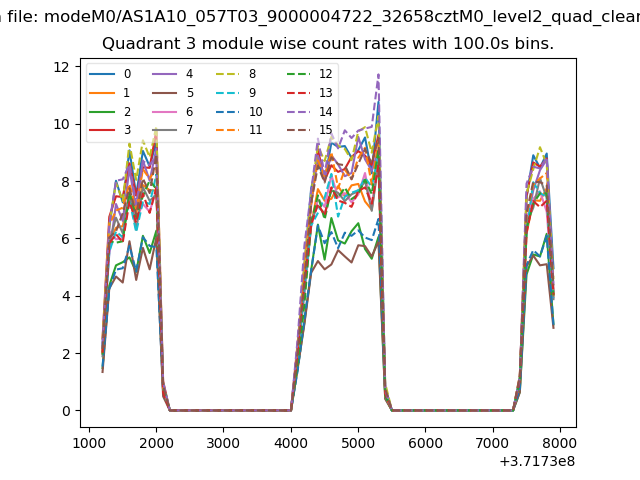 |
 |
| Parameter | Plot |
|---|---|
| CZT HV Monitor |  |
| D_VDD | 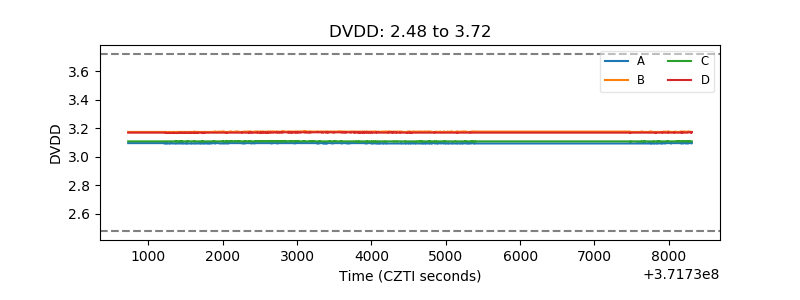 |
| Temperature 1 | 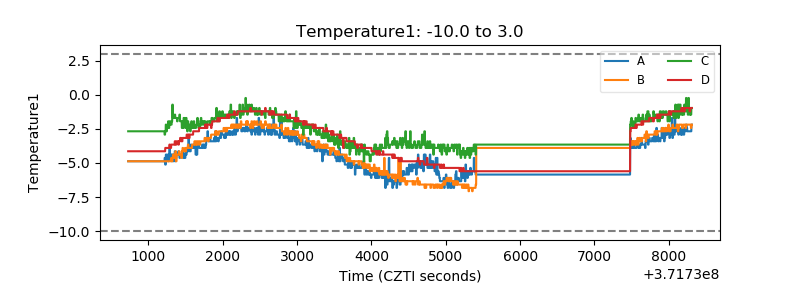 |
| Veto HV Monitor | 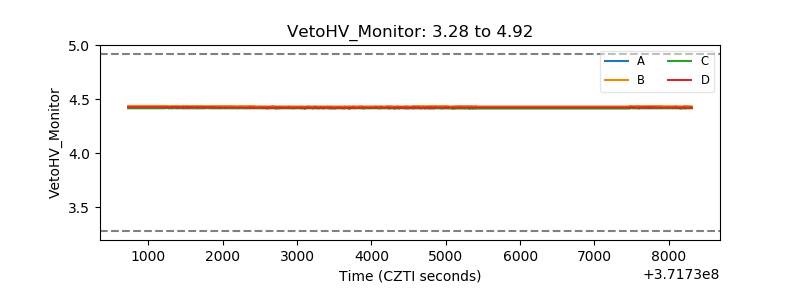 |
| Veto LLD | 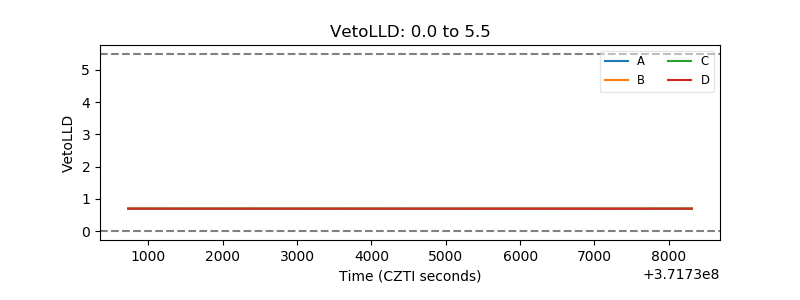 |
| Alpha Counter | 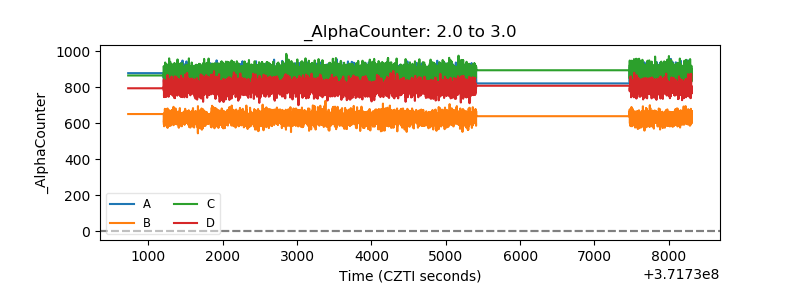 |
| _CPM_Rate | 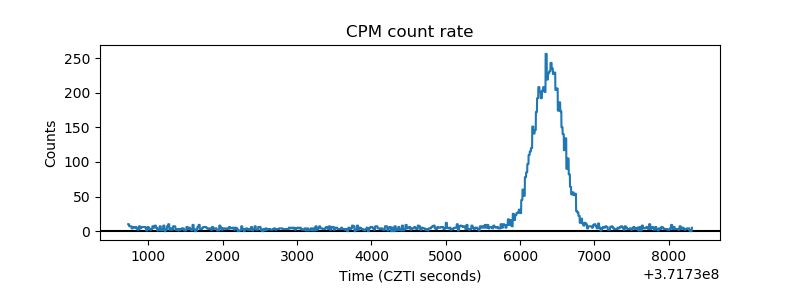 |
| CZT Counter | 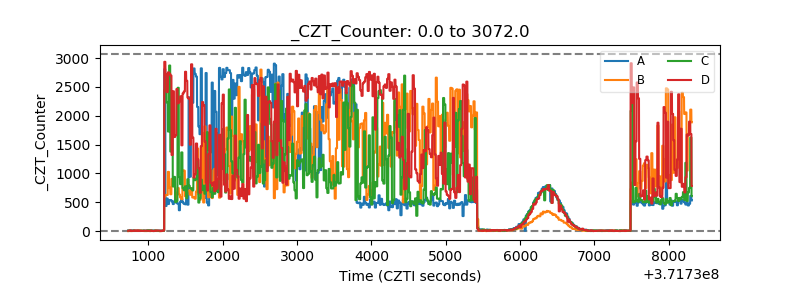 |
| +2.5 Volts monitor |  |
| +5 Volts monitor |  |
| _ROLL_ROT | 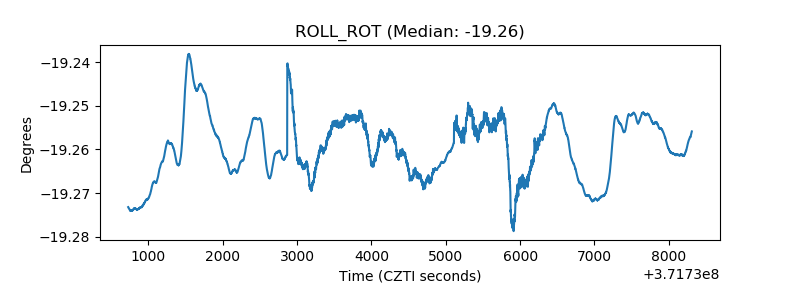 |
| _Roll_DEC | 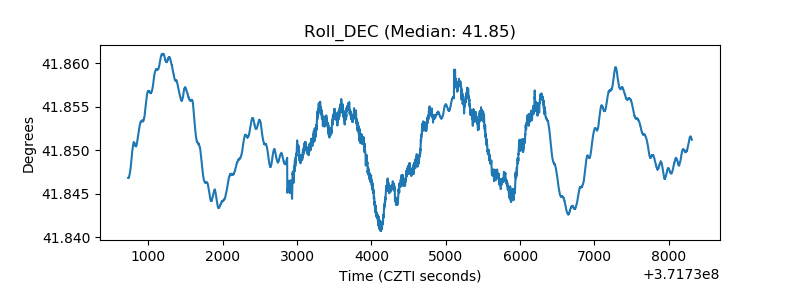 |
| _Roll_RA | 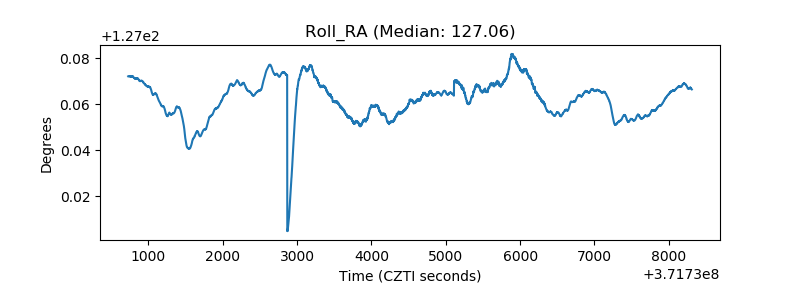 |
| Veto Counter | 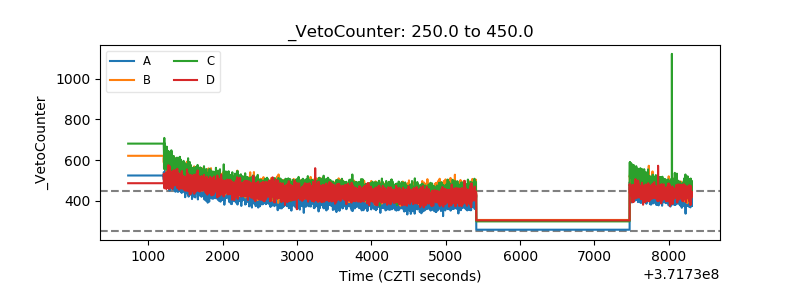 |