| Param | Original file | Final file |
|---|---|---|
| Filename | modeM0/AS1A10_057T03_9000004722_32659cztM0_level2.evt | modeM0/AS1A10_057T03_9000004722_32659cztM0_level2_quad_clean.evt |
| Size (bytes) | 686,580,480 | 53,614,080 |
| Size | 654.8 MB | 51.1 MB |
| Events in quadrant A | 2,710,998 | 328,348 |
| Events in quadrant B | 6,962,894 | 313,244 |
| Events in quadrant C | 4,059,633 | 310,681 |
| Events in quadrant D | 6,702,705 | 299,800 |
| Mode M0 | |||
|---|---|---|---|
| Quadrant | BADHDUFLAG | Total packets | Discarded packets |
| A | 0 | 11275 | 3 |
| B | 0 | 24411 | 2 |
| C | 0 | 15498 | 2 |
| D | 0 | 23583 | 2 |
| Mode M9 | |||
|---|---|---|---|
| Quadrant | BADHDUFLAG | Total packets | Discarded packets |
| A | 0 | 25 | 0 |
| B | 0 | 25 | 0 |
| C | 0 | 25 | 0 |
| D | 0 | 26 | 0 |
| Mode SS | |||
|---|---|---|---|
| Quadrant | BADHDUFLAG | Total packets | Discarded packets |
| A | 0 | 108 | 0 |
| B | 0 | 108 | 0 |
| C | 0 | 108 | 0 |
| D | 0 | 108 | 0 |
| Quadrant | Total seconds | Saturated seconds | Saturation percentage |
|---|---|---|---|
| A | 5292 | 28 | 0.529101% |
| B | 5292 | 1255 | 23.715042% |
| C | 5292 | 289 | 5.461073% |
| D | 5292 | 1145 | 21.636432% |
Noise dominated data is calculated using 1-second bins in cleaned event files. If a bin has >2000 counts, and if more than 50% of those come from <1% of pixels, then it is considered to be noise-dominated and hence unusable.
| Quadrant | # 1 sec bins | Bins with >0 counts | Bins with >2000 counts | High rate bins dominated by noise | Noise dominated (total time) | Noise dominated (detector-on time) | Marked lightcurve |
|---|---|---|---|---|---|---|---|
| A | 7085 | 5293 | 18 | 18 | 0.25% | 0.34% | 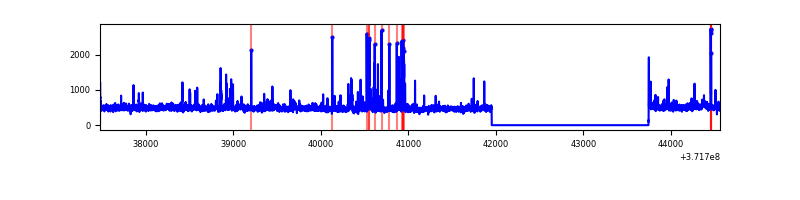 |
| B | 7085 | 5293 | 1095 | 1095 | 15.46% | 20.69% | 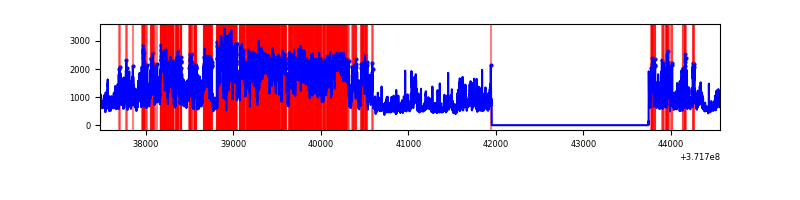 |
| C | 7085 | 5293 | 226 | 226 | 3.19% | 4.27% | 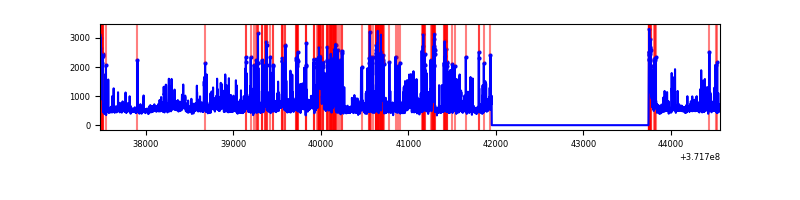 |
| D | 7085 | 5293 | 1114 | 1114 | 15.72% | 21.05% | 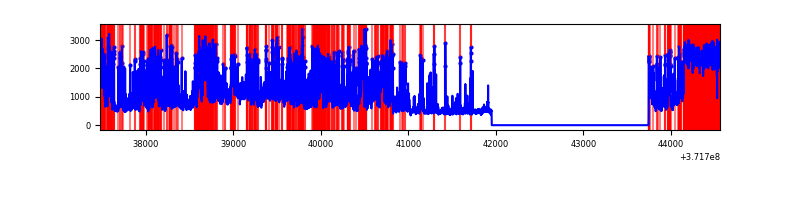 |
Top three noisy pixels from each quadrant. If the there are fewer than three noisy pixels in the level2.evt file, extra rows are filled as -1
| Pixel properties | Quadrant properties | ||||||
|---|---|---|---|---|---|---|---|
| Quadrant | DetID | PixID | Counts | Sigma | Mean | Median | Sigma |
| A | 15 | 249 | 102429 | 804.02 | 630 | 618 | 126.6 |
| A | 14 | 239 | 99273 | 779.1 | 630 | 618 | 126.6 |
| A | 0 | 135 | 15675 | 118.91 | 630 | 618 | 126.6 |
| B | 3 | 43 | 1551427 | 13940.28 | 592 | 581 | 111.2 |
| B | 0 | 219 | 1153607 | 10364.34 | 592 | 581 | 111.2 |
| B | 12 | 1 | 483809 | 4343.65 | 592 | 581 | 111.2 |
| C | 8 | 35 | 556210 | 3995.71 | 594 | 598 | 139.1 |
| C | 9 | 160 | 327823 | 2353.26 | 594 | 598 | 139.1 |
| C | 8 | 50 | 233613 | 1675.74 | 594 | 598 | 139.1 |
| D | 12 | 33 | 710360 | 5431.73 | 549 | 538 | 130.7 |
| D | 2 | 249 | 631684 | 4829.68 | 549 | 538 | 130.7 |
| D | 2 | 250 | 614151 | 4695.51 | 549 | 538 | 130.7 |
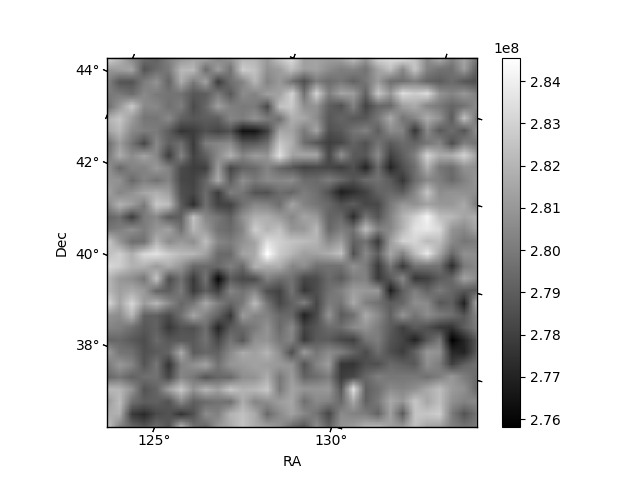
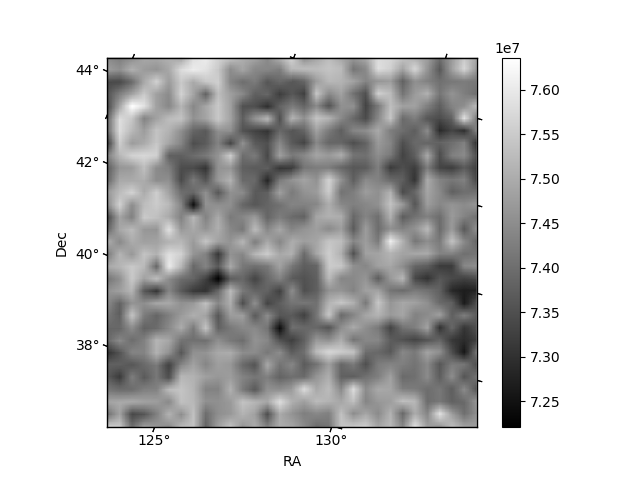
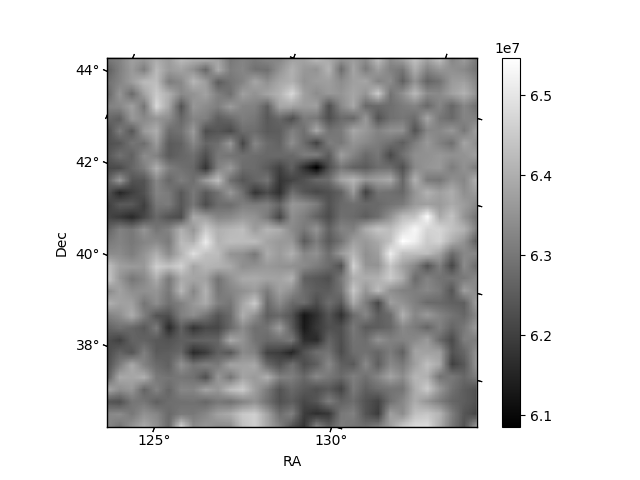
Histogram calculated using DETX and DETY for each event in the final _common_clean file
| Quadrant A | 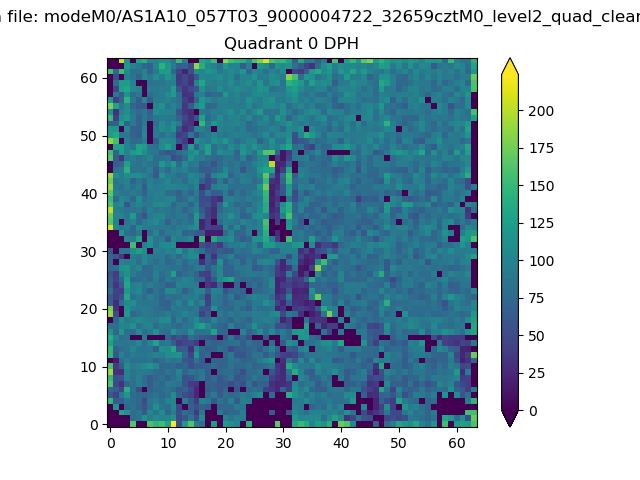 |
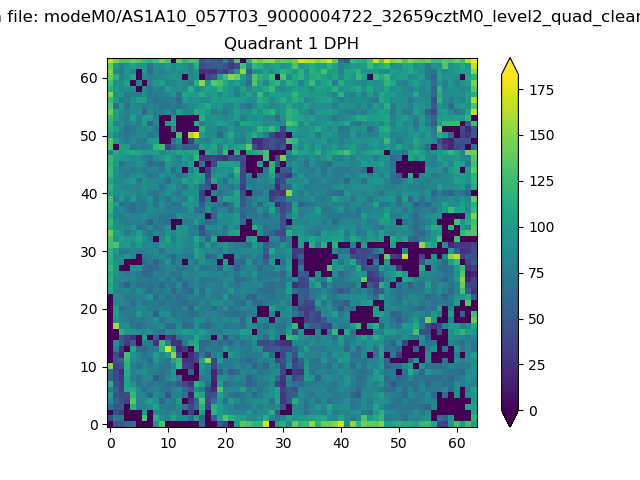 |
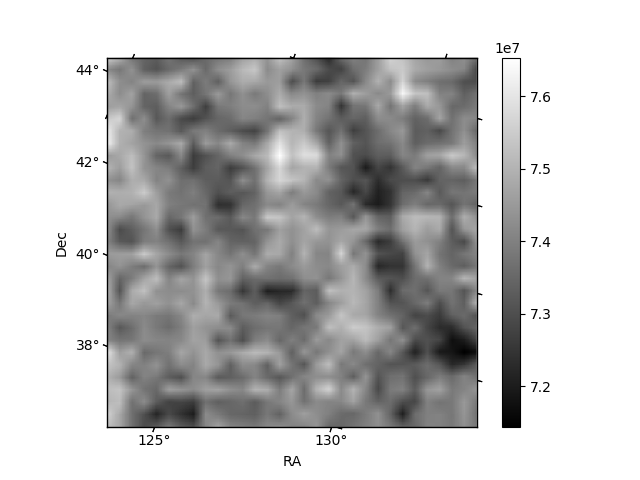
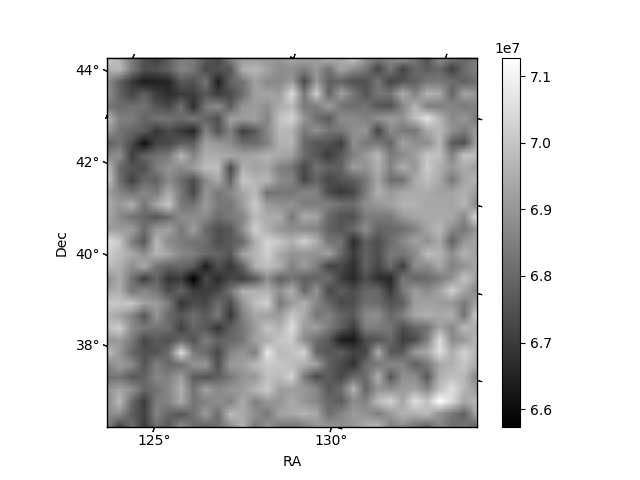
Quadrant B |
|---|---|---|---|
| Quadrant D | 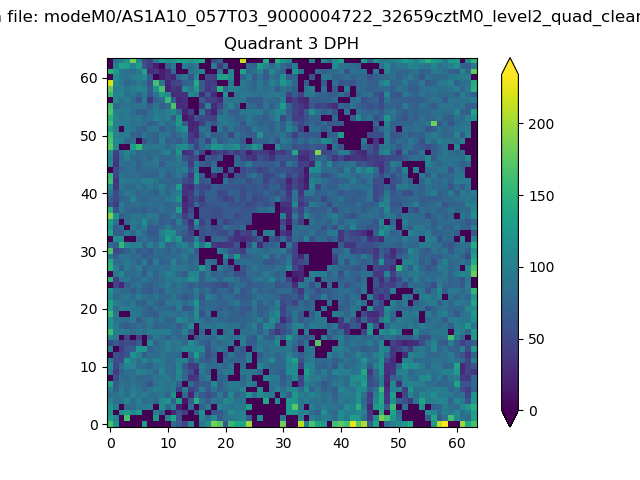 |
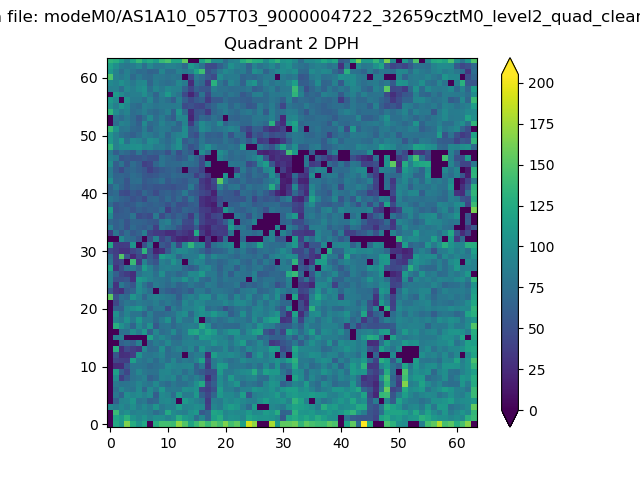 |
Quadrant C |
| Plot type | Count rate plots | Images |
|---|---|---|
| Comparison with Poisson distribution Blue bars denote a histogram of data divided into 1 sec bins. Red curve is a Poisson curve with rate = median count rate of data. |
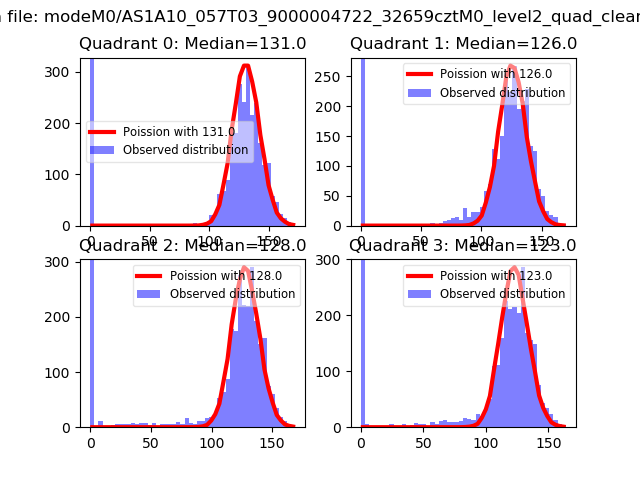 |
 |
| Quadrant-wise count rates Data is divided into 100 sec bins |
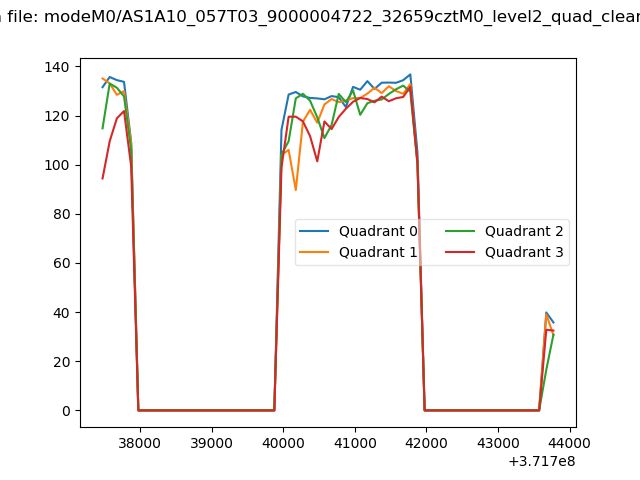 |
|
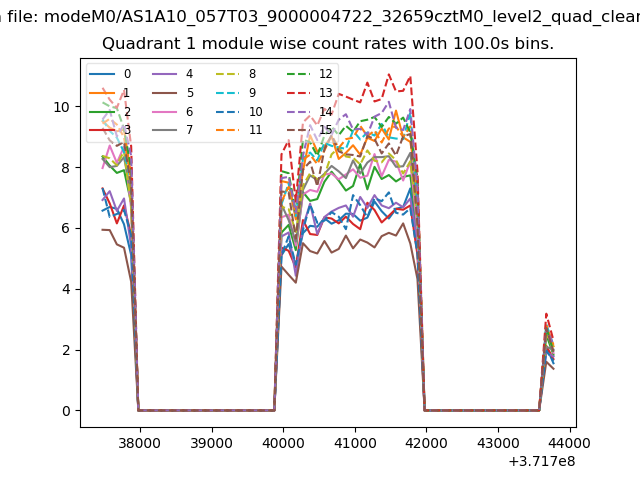
| Module-wise count rates for Quadrant A Data is divided into 100 sec bins |
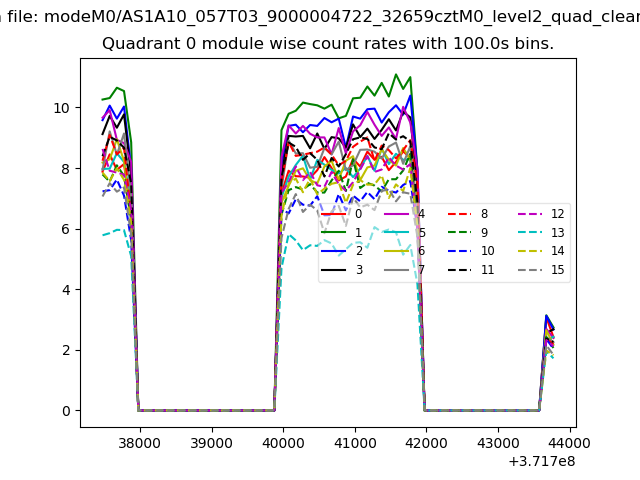 |
 |
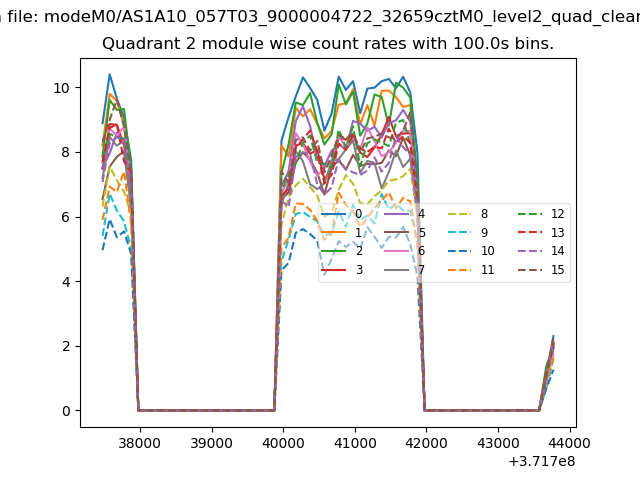
| Module-wise count rates for Quadrant B Data is divided into 100 sec bins |
 |
 |
| Module-wise count rates for Quadrant C Data is divided into 100 sec bins |
 |
 |
| Module-wise count rates for Quadrant D Data is divided into 100 sec bins |
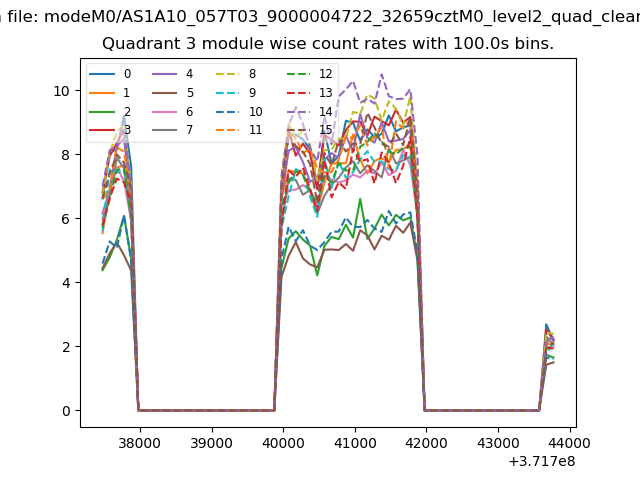 |
 |
| Parameter | Plot |
|---|---|
| CZT HV Monitor | 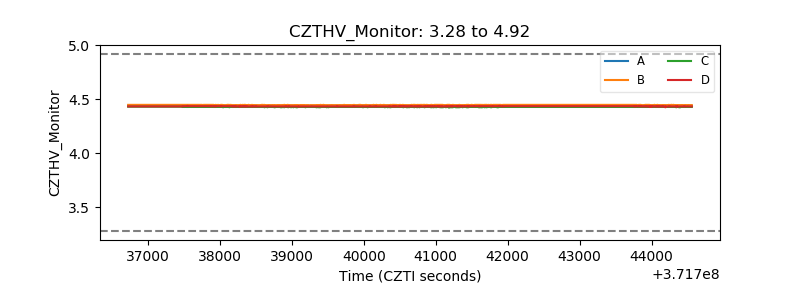 |
| D_VDD | 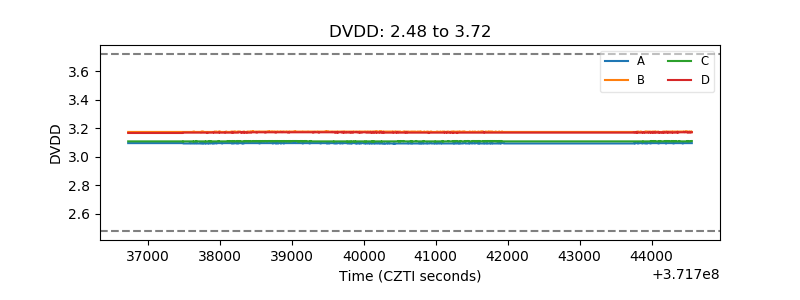 |
| Temperature 1 | 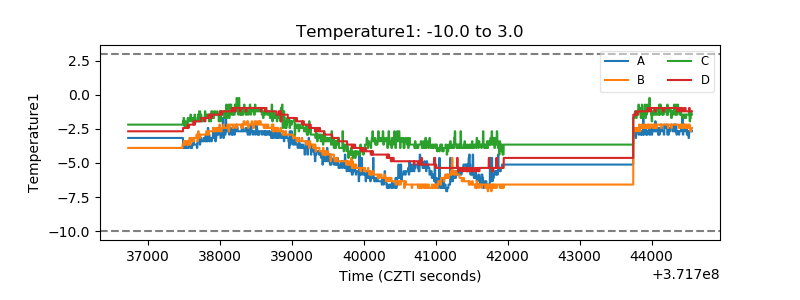 |
| Veto HV Monitor | 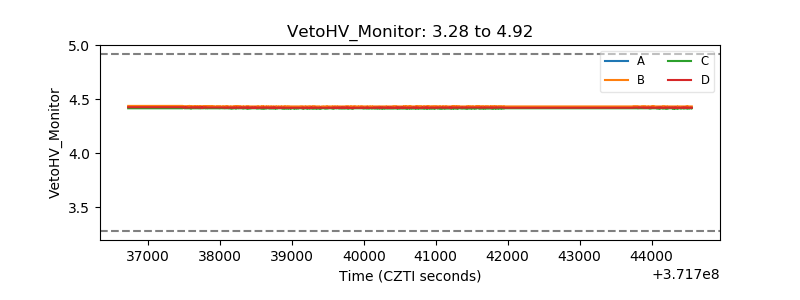 |
| Veto LLD | 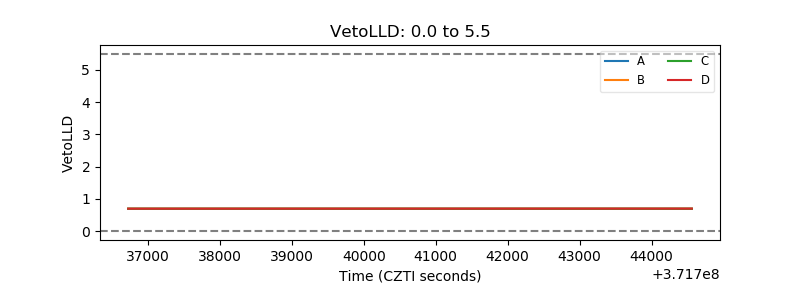 |
| Alpha Counter | 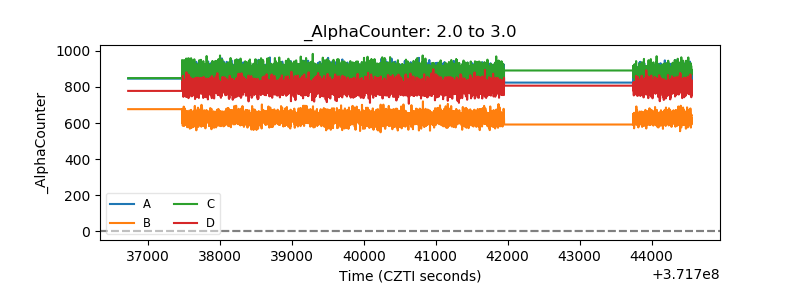 |
| _CPM_Rate | 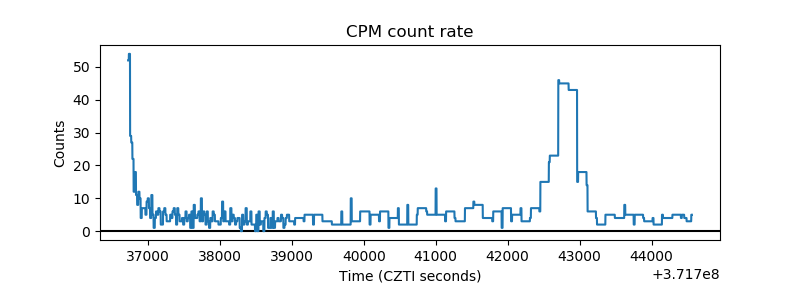 |
| CZT Counter | 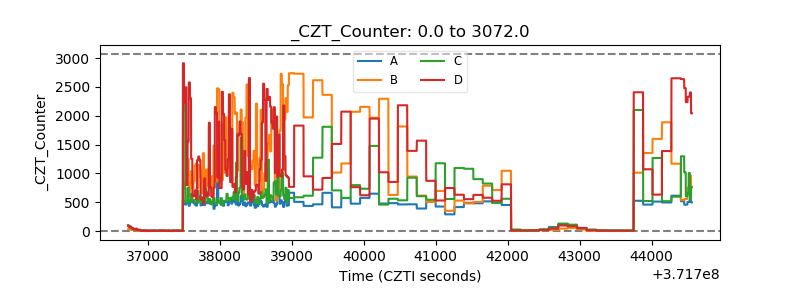 |
| +2.5 Volts monitor |  |
| +5 Volts monitor |  |
| _ROLL_ROT | 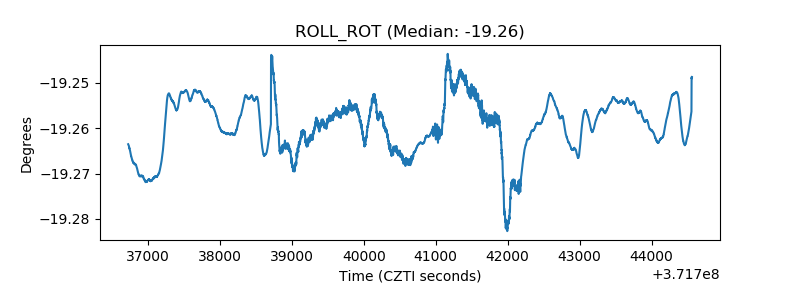 |
| _Roll_DEC | 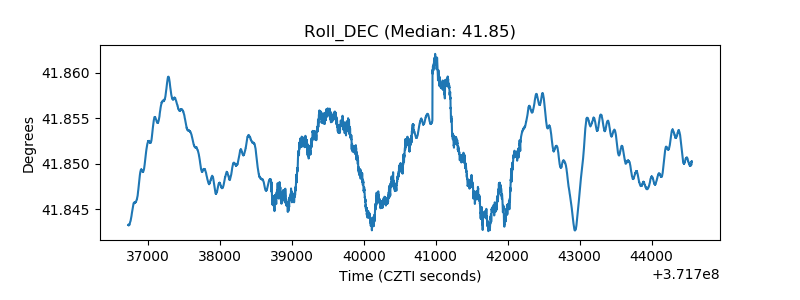 |
| _Roll_RA | 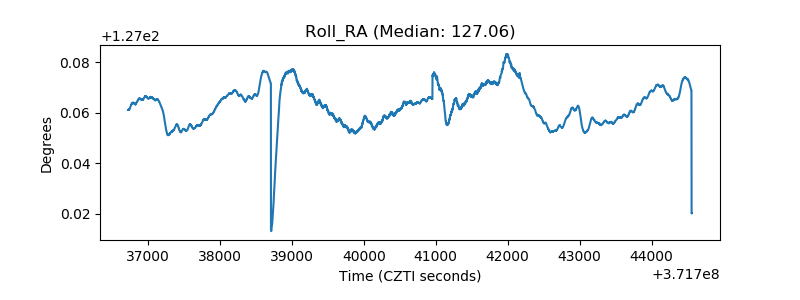 |
| Veto Counter | 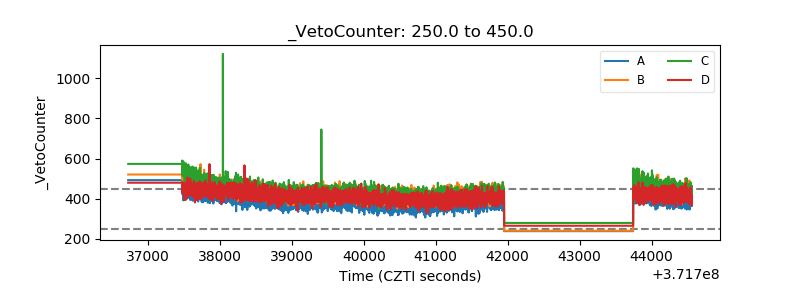 |