| Param | Original file | Final file |
|---|---|---|
| Filename | modeM0/AS1A10_057T03_9000004722_32660cztM0_level2.evt | modeM0/AS1A10_057T03_9000004722_32660cztM0_level2_quad_clean.evt |
| Size (bytes) | 757,042,560 | 58,777,920 |
| Size | 722.0 MB | 56.1 MB |
| Events in quadrant A | 2,956,576 | 358,118 |
| Events in quadrant B | 5,390,739 | 345,820 |
| Events in quadrant C | 4,348,265 | 346,491 |
| Events in quadrant D | 9,833,605 | 316,829 |
| Mode M0 | |||
|---|---|---|---|
| Quadrant | BADHDUFLAG | Total packets | Discarded packets |
| A | 0 | 12463 | 3 |
| B | 0 | 20169 | 2 |
| C | 0 | 16785 | 2 |
| D | 0 | 33143 | 2 |
| Mode M9 | |||
|---|---|---|---|
| Quadrant | BADHDUFLAG | Total packets | Discarded packets |
| A | 0 | 16 | 0 |
| B | 0 | 16 | 0 |
| C | 0 | 16 | 0 |
| D | 0 | 17 | 0 |
| Mode SS | |||
|---|---|---|---|
| Quadrant | BADHDUFLAG | Total packets | Discarded packets |
| A | 0 | 120 | 0 |
| B | 0 | 120 | 0 |
| C | 0 | 120 | 0 |
| D | 0 | 120 | 0 |
| Quadrant | Total seconds | Saturated seconds | Saturation percentage |
|---|---|---|---|
| A | 5896 | 20 | 0.339213% |
| B | 5896 | 311 | 5.274763% |
| C | 5896 | 264 | 4.477612% |
| D | 5896 | 3189 | 54.087517% |
Noise dominated data is calculated using 1-second bins in cleaned event files. If a bin has >2000 counts, and if more than 50% of those come from <1% of pixels, then it is considered to be noise-dominated and hence unusable.
| Quadrant | # 1 sec bins | Bins with >0 counts | Bins with >2000 counts | High rate bins dominated by noise | Noise dominated (total time) | Noise dominated (detector-on time) | Marked lightcurve |
|---|---|---|---|---|---|---|---|
| A | 7360 | 5897 | 7 | 7 | 0.10% | 0.12% | 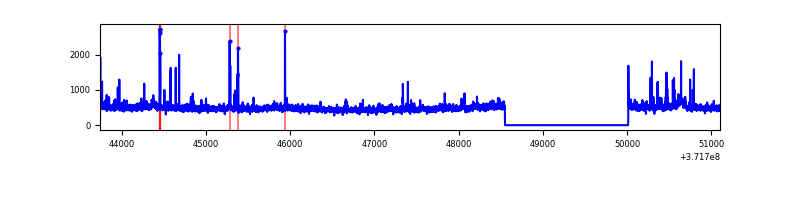 |
| B | 7360 | 5897 | 194 | 194 | 2.64% | 3.29% | 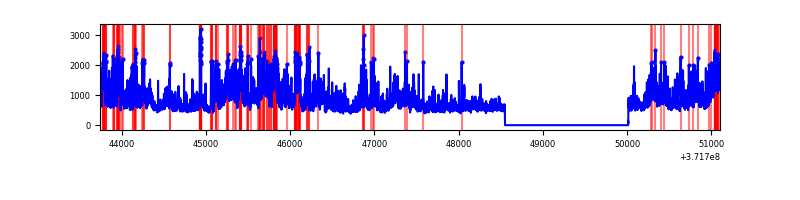 |
| C | 7360 | 5897 | 200 | 200 | 2.72% | 3.39% | 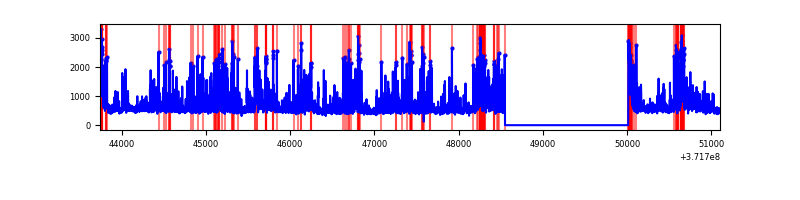 |
| D | 7360 | 5897 | 2995 | 2995 | 40.69% | 50.79% | 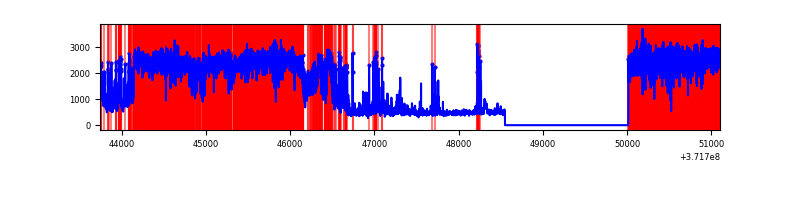 |
Top three noisy pixels from each quadrant. If the there are fewer than three noisy pixels in the level2.evt file, extra rows are filled as -1
| Pixel properties | Quadrant properties | ||||||
|---|---|---|---|---|---|---|---|
| Quadrant | DetID | PixID | Counts | Sigma | Mean | Median | Sigma |
| A | 15 | 249 | 80521 | 567.08 | 697 | 683 | 140.8 |
| A | 4 | 48 | 43365 | 303.16 | 697 | 683 | 140.8 |
| A | 0 | 64 | 30715 | 213.31 | 697 | 683 | 140.8 |
| B | 12 | 1 | 859963 | 6626.46 | 692 | 680 | 129.7 |
| B | 0 | 219 | 755848 | 5823.57 | 692 | 680 | 129.7 |
| B | 3 | 43 | 351286 | 2703.74 | 692 | 680 | 129.7 |
| C | 8 | 35 | 555882 | 3626.89 | 661 | 666 | 153.1 |
| C | 8 | 50 | 348710 | 2273.56 | 661 | 666 | 153.1 |
| C | 8 | 147 | 223910 | 1458.32 | 661 | 666 | 153.1 |
| D | 12 | 33 | 4084876 | 37299.37 | 451 | 441 | 109.5 |
| D | 2 | 250 | 756503 | 6904.42 | 451 | 441 | 109.5 |
| D | 7 | 38 | 624012 | 5694.5 | 451 | 441 | 109.5 |
Histogram calculated using DETX and DETY for each event in the final _common_clean file
| Quadrant A | 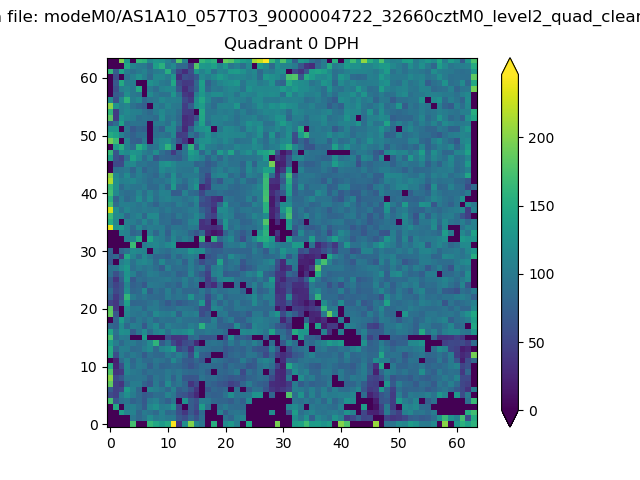 |
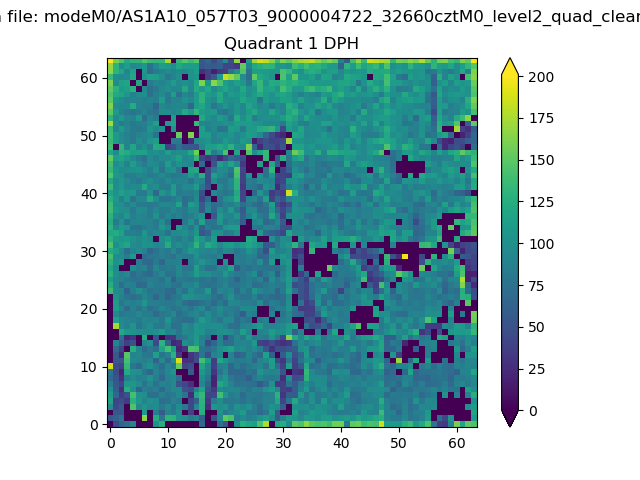 |
Quadrant B |
|---|---|---|---|
| Quadrant D | 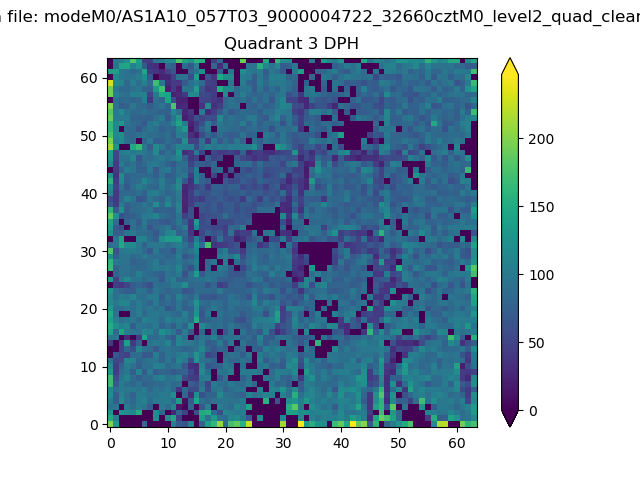 |
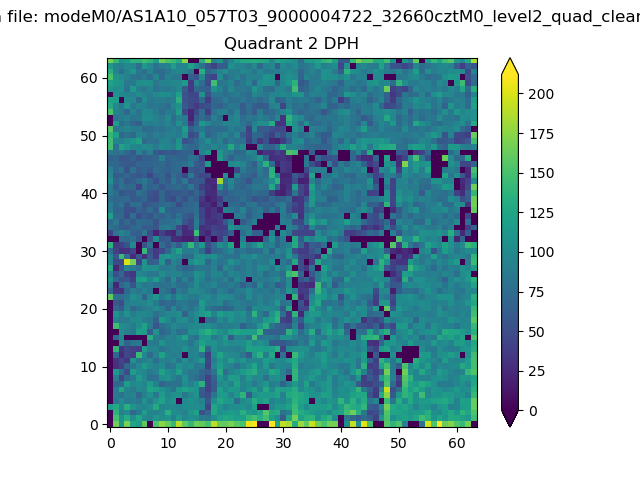 |
Quadrant C |
| Plot type | Count rate plots | Images |
|---|---|---|
| Comparison with Poisson distribution Blue bars denote a histogram of data divided into 1 sec bins. Red curve is a Poisson curve with rate = median count rate of data. |
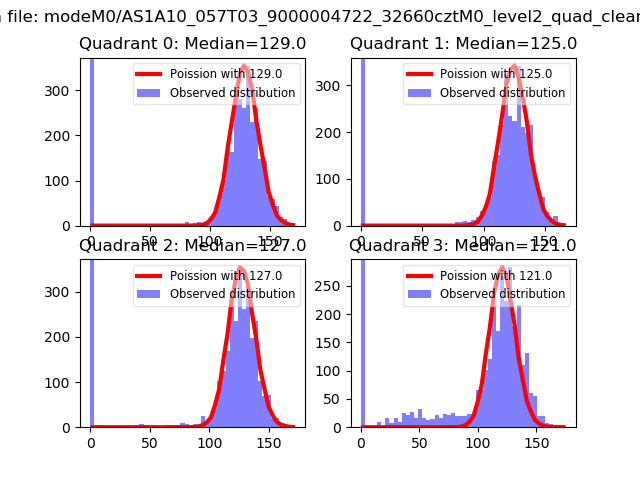 |
 |
| Quadrant-wise count rates Data is divided into 100 sec bins |
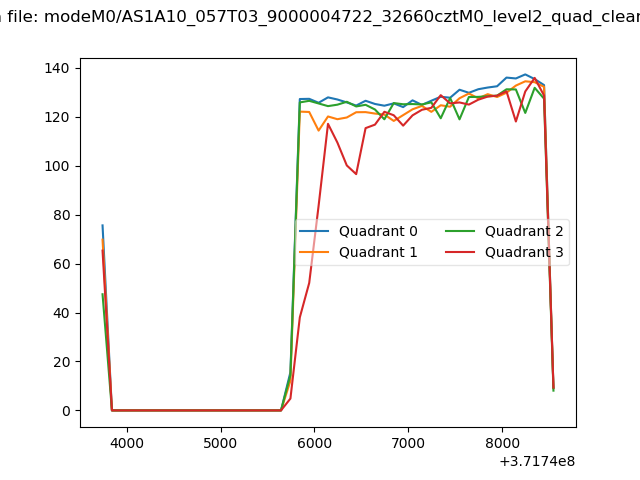 |
|
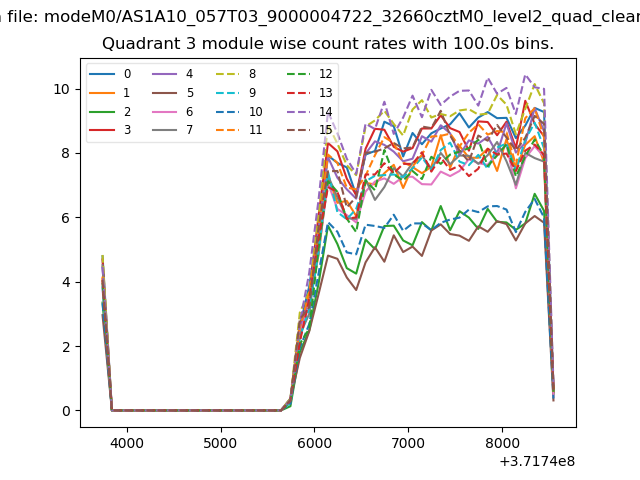
| Module-wise count rates for Quadrant A Data is divided into 100 sec bins |
 |
 |
| Module-wise count rates for Quadrant B Data is divided into 100 sec bins |
 |
 |
| Module-wise count rates for Quadrant C Data is divided into 100 sec bins |
 |
 |
| Module-wise count rates for Quadrant D Data is divided into 100 sec bins |
 |
 |
| Parameter | Plot |
|---|---|
| CZT HV Monitor | 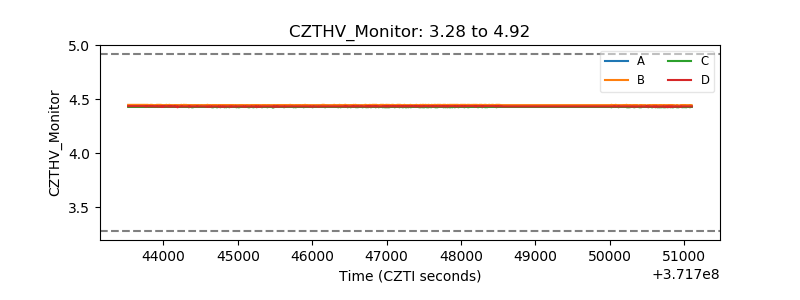 |
| D_VDD | 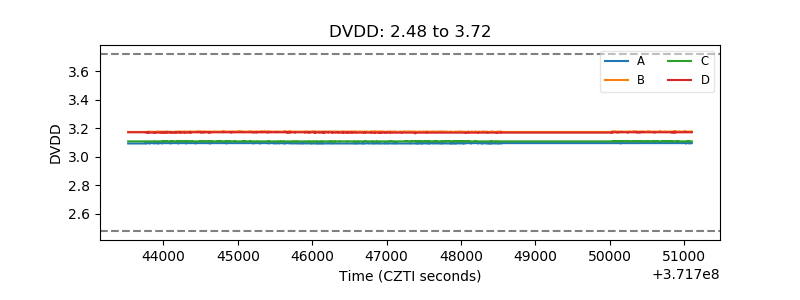 |
| Temperature 1 | 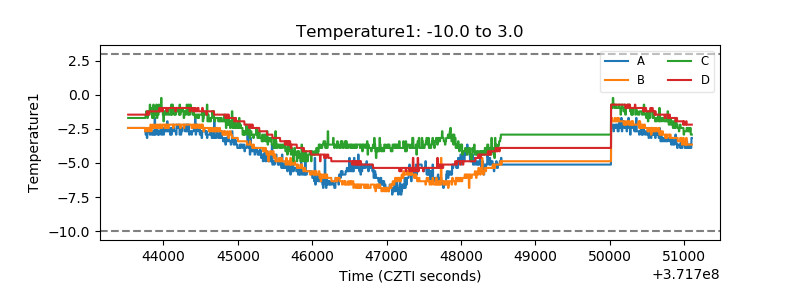 |
| Veto HV Monitor | 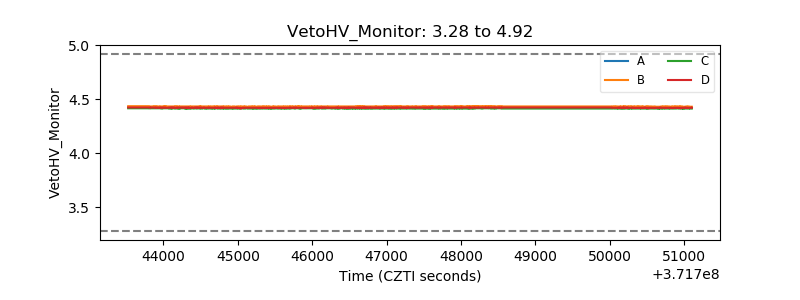 |
| Veto LLD | 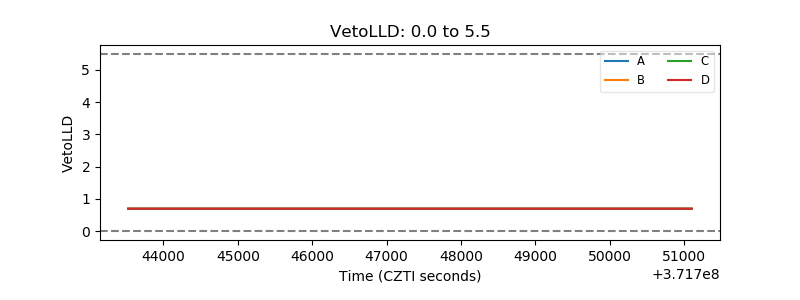 |
| Alpha Counter | 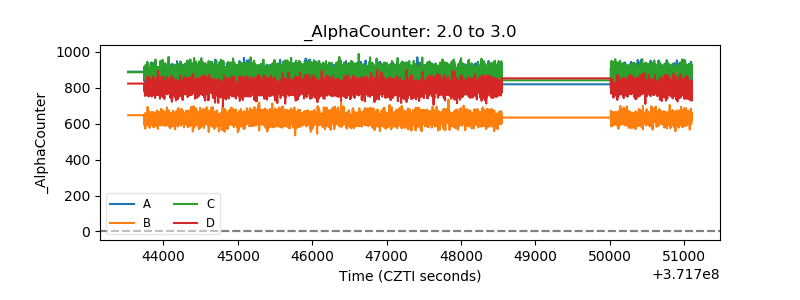 |
| _CPM_Rate | 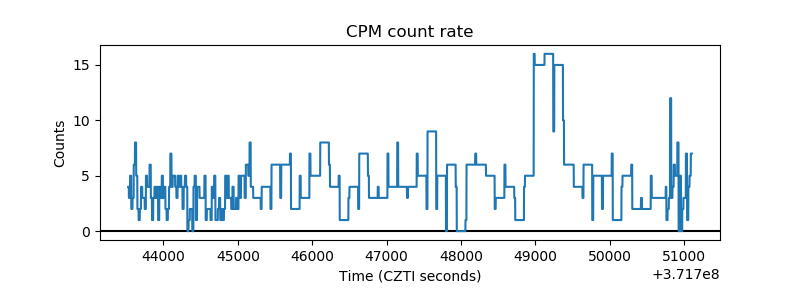 |
| CZT Counter | 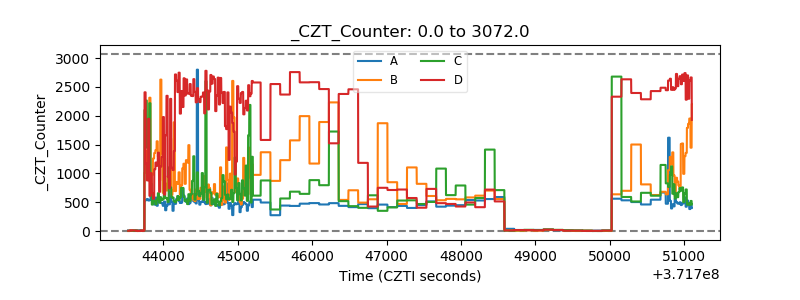 |
| +2.5 Volts monitor |  |
| +5 Volts monitor | 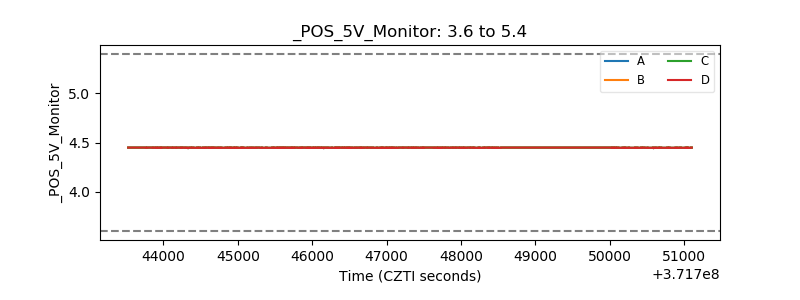 |
| _ROLL_ROT | 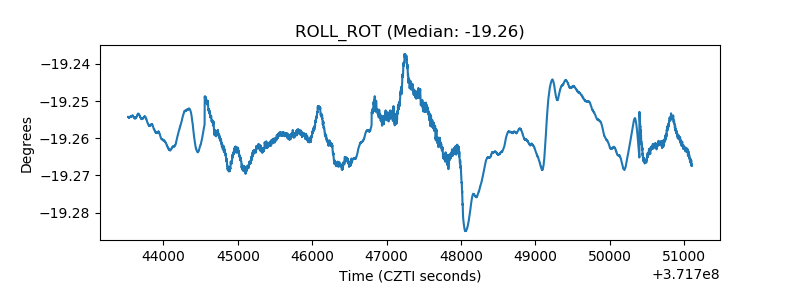 |
| _Roll_DEC | 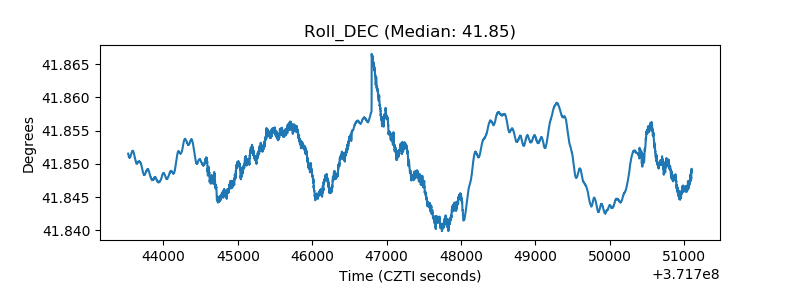 |
| _Roll_RA | 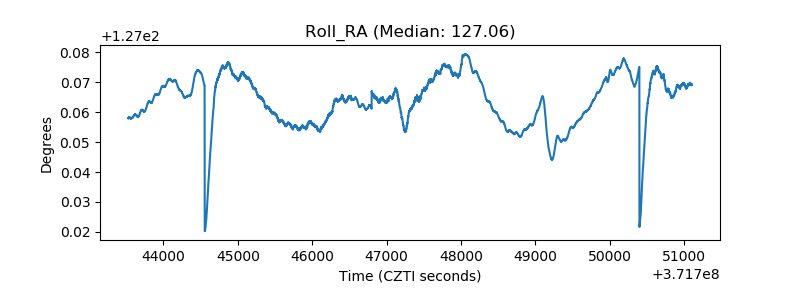 |
| Veto Counter | 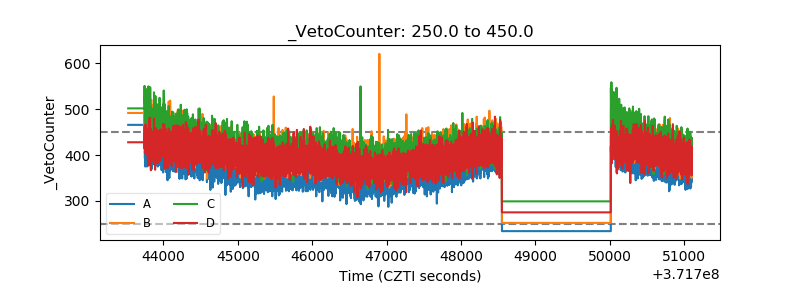 |