| Param | Original file | Final file |
|---|---|---|
| Filename | modeM0/AS1A10_057T03_9000004722_32661cztM0_level2.evt | modeM0/AS1A10_057T03_9000004722_32661cztM0_level2_quad_clean.evt |
| Size (bytes) | 814,455,360 | 65,900,160 |
| Size | 776.7 MB | 62.8 MB |
| Events in quadrant A | 3,016,840 | 417,938 |
| Events in quadrant B | 5,989,996 | 397,883 |
| Events in quadrant C | 4,858,269 | 408,354 |
| Events in quadrant D | 10,397,570 | 352,698 |
| Mode M0 | |||
|---|---|---|---|
| Quadrant | BADHDUFLAG | Total packets | Discarded packets |
| A | 0 | 12777 | 3 |
| B | 0 | 22034 | 2 |
| C | 0 | 18380 | 2 |
| D | 0 | 34922 | 2 |
| Mode M9 | |||
|---|---|---|---|
| Quadrant | BADHDUFLAG | Total packets | Discarded packets |
| A | 0 | 20 | 0 |
| B | 0 | 20 | 0 |
| C | 0 | 20 | 0 |
| D | 0 | 21 | 0 |
| Mode SS | |||
|---|---|---|---|
| Quadrant | BADHDUFLAG | Total packets | Discarded packets |
| A | 0 | 122 | 0 |
| B | 0 | 122 | 0 |
| C | 0 | 122 | 0 |
| D | 0 | 122 | 0 |
| Quadrant | Total seconds | Saturated seconds | Saturation percentage |
|---|---|---|---|
| A | 5981 | 30 | 0.501588% |
| B | 5981 | 589 | 9.847852% |
| C | 5981 | 505 | 8.443404% |
| D | 5981 | 3214 | 53.736833% |
Noise dominated data is calculated using 1-second bins in cleaned event files. If a bin has >2000 counts, and if more than 50% of those come from <1% of pixels, then it is considered to be noise-dominated and hence unusable.
| Quadrant | # 1 sec bins | Bins with >0 counts | Bins with >2000 counts | High rate bins dominated by noise | Noise dominated (total time) | Noise dominated (detector-on time) | Marked lightcurve |
|---|---|---|---|---|---|---|---|
| A | 7294 | 5982 | 17 | 17 | 0.23% | 0.28% | 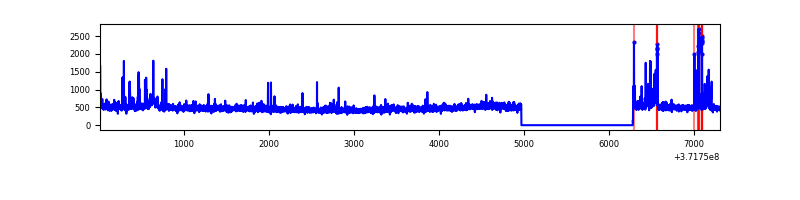 |
| B | 7294 | 5982 | 394 | 394 | 5.40% | 6.59% | 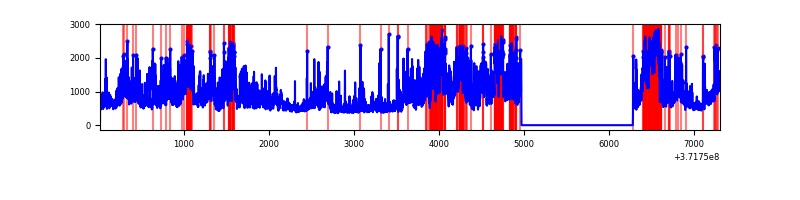 |
| C | 7294 | 5982 | 386 | 386 | 5.29% | 6.45% | 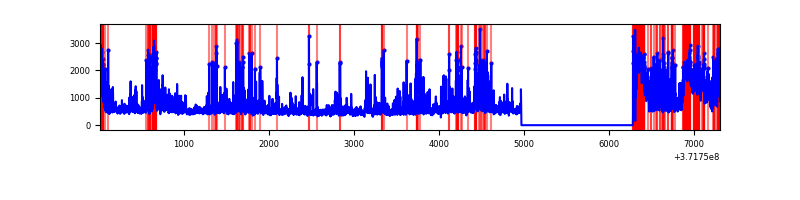 |
| D | 7294 | 5982 | 3066 | 3066 | 42.03% | 51.25% | 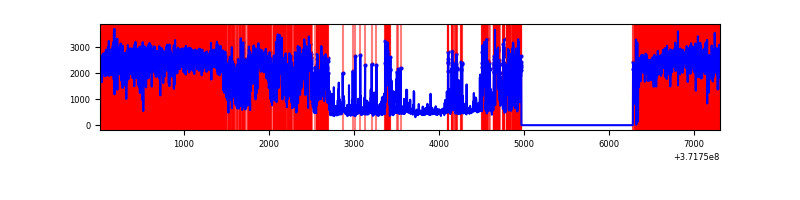 |
Top three noisy pixels from each quadrant. If the there are fewer than three noisy pixels in the level2.evt file, extra rows are filled as -1
| Pixel properties | Quadrant properties | ||||||
|---|---|---|---|---|---|---|---|
| Quadrant | DetID | PixID | Counts | Sigma | Mean | Median | Sigma |
| A | 15 | 249 | 148116 | 1040.22 | 704 | 691 | 141.7 |
| A | 9 | 191 | 33533 | 231.73 | 704 | 691 | 141.7 |
| A | 13 | 6 | 24220 | 166.02 | 704 | 691 | 141.7 |
| B | 3 | 26 | 774223 | 5877.61 | 693 | 680 | 131.6 |
| B | 12 | 1 | 764731 | 5805.48 | 693 | 680 | 131.6 |
| B | 0 | 219 | 557419 | 4230.27 | 693 | 680 | 131.6 |
| C | 4 | 237 | 576772 | 3763.47 | 658 | 663 | 153.1 |
| C | 8 | 35 | 357054 | 2328.15 | 658 | 663 | 153.1 |
| C | 8 | 50 | 330057 | 2151.79 | 658 | 663 | 153.1 |
| D | 12 | 33 | 2899017 | 27354.23 | 442 | 432 | 106.0 |
| D | 7 | 80 | 2354215 | 22212.88 | 442 | 432 | 106.0 |
| D | 12 | 227 | 814505 | 7682.49 | 442 | 432 | 106.0 |
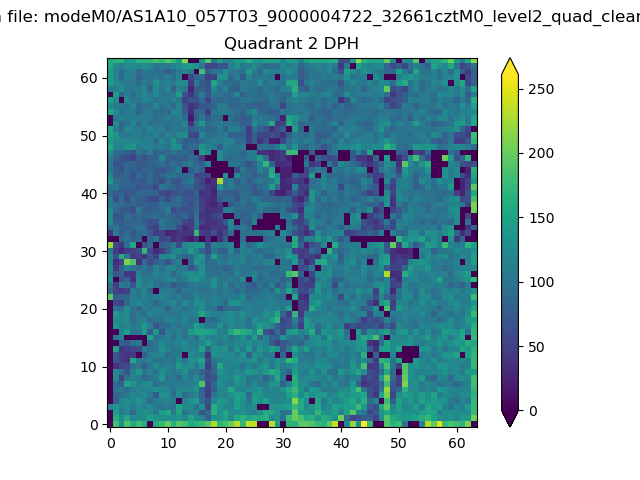
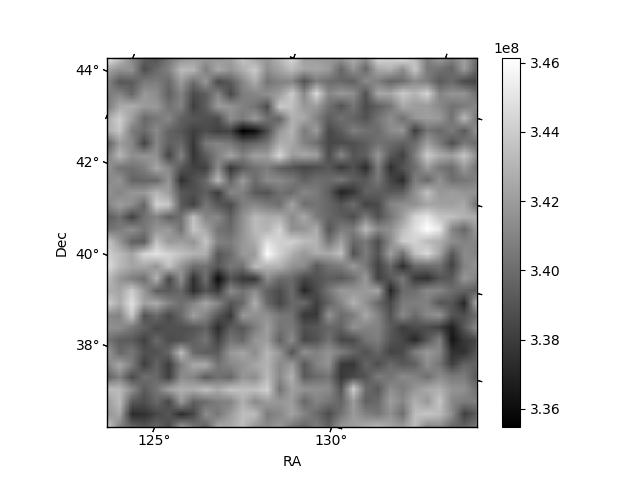
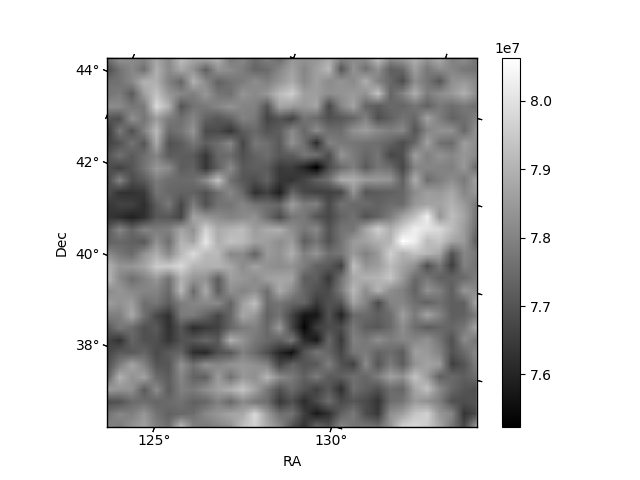
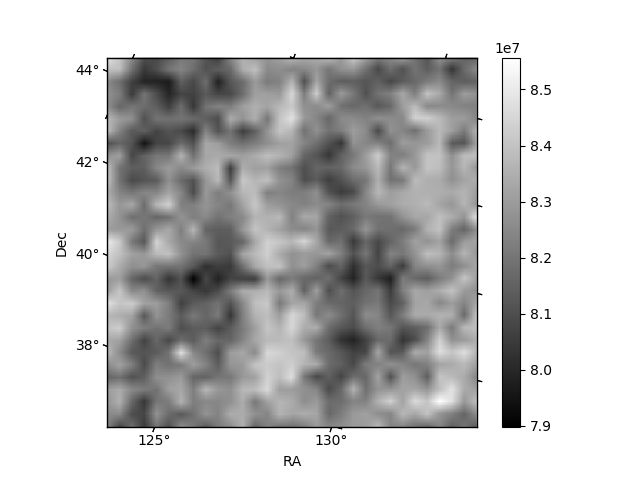
Histogram calculated using DETX and DETY for each event in the final _common_clean file
| Quadrant A | 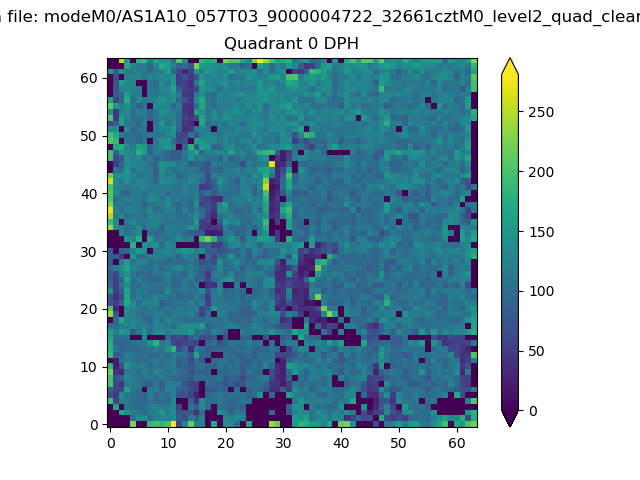 |
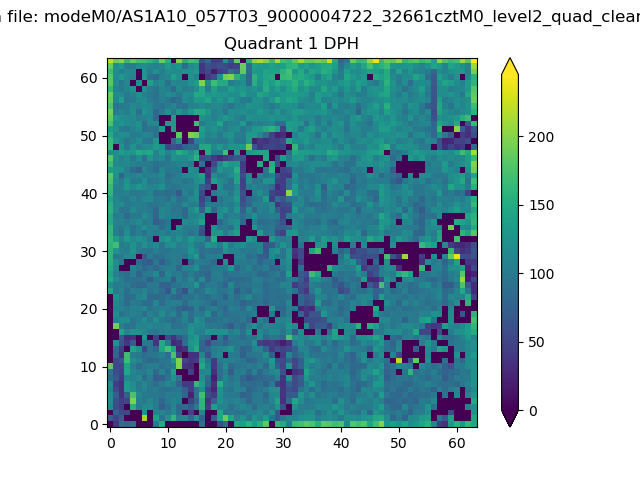 |
Quadrant B |
|---|---|---|---|
| Quadrant D | 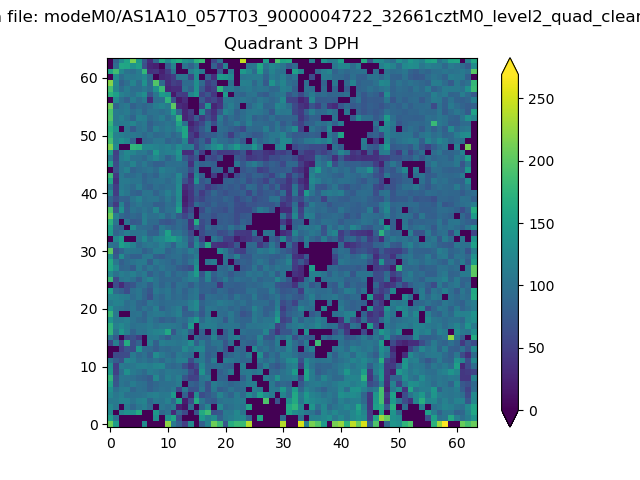 |
 |
Quadrant C |
| Plot type | Count rate plots | Images |
|---|---|---|
| Comparison with Poisson distribution Blue bars denote a histogram of data divided into 1 sec bins. Red curve is a Poisson curve with rate = median count rate of data. |
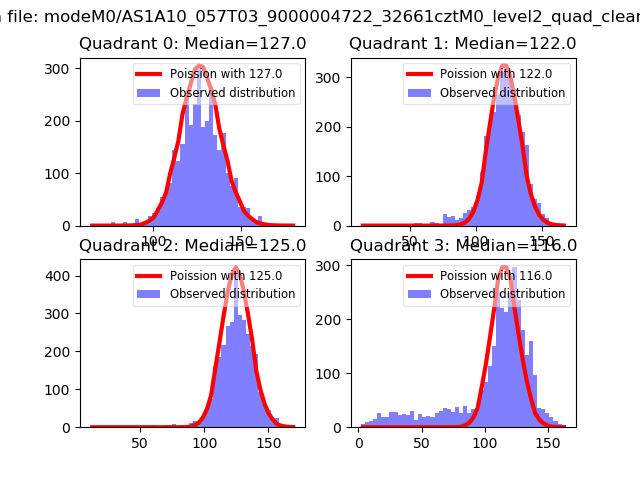 |
 |
| Quadrant-wise count rates Data is divided into 100 sec bins |
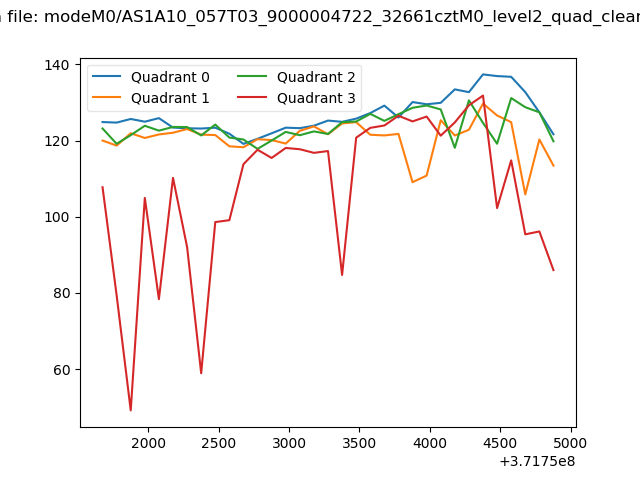 |
|
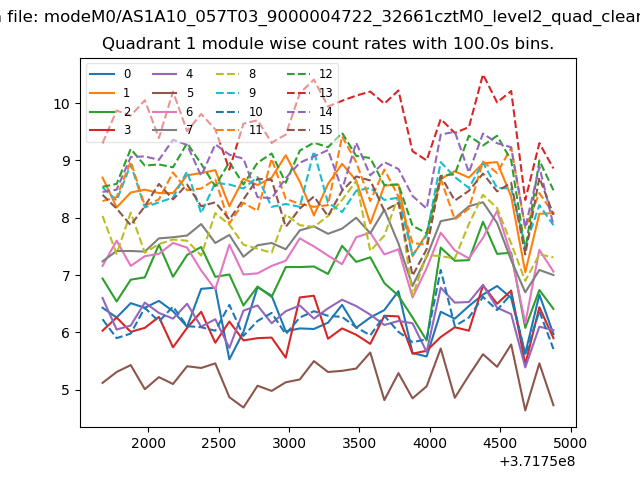
| Module-wise count rates for Quadrant A Data is divided into 100 sec bins |
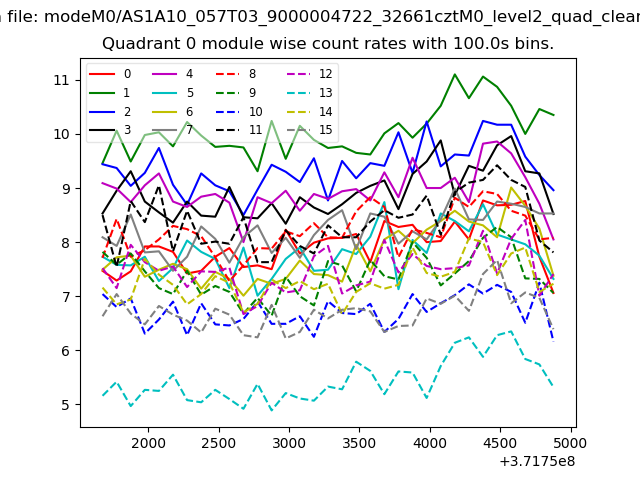 |
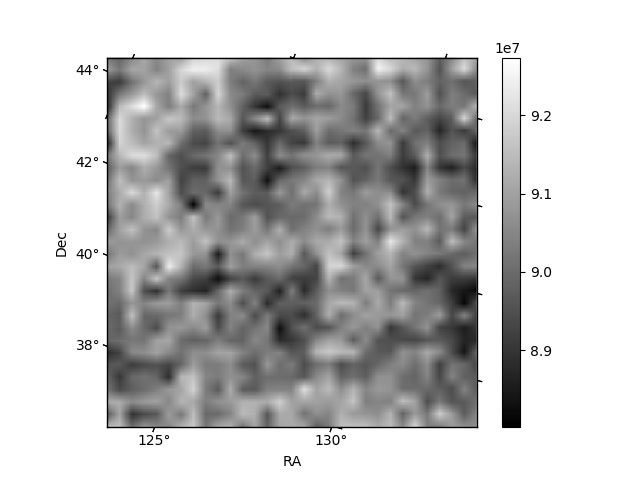 |
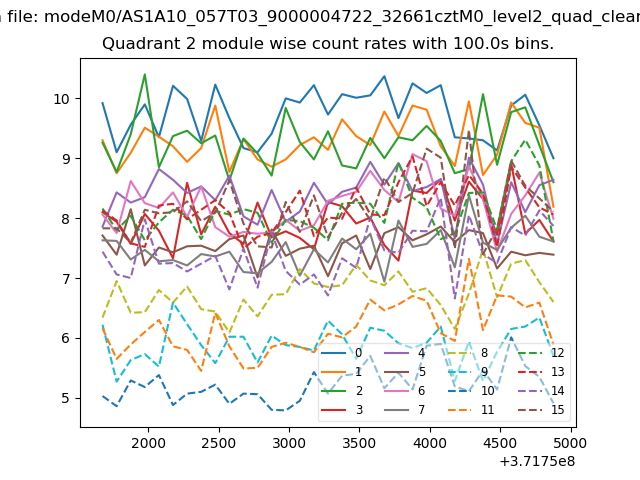
| Module-wise count rates for Quadrant B Data is divided into 100 sec bins |
 |
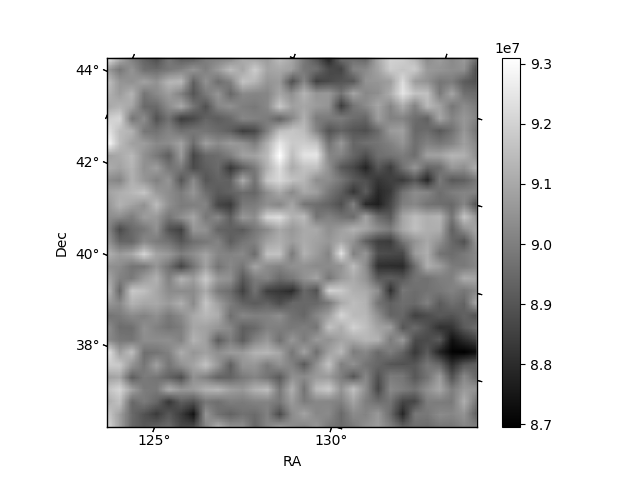 |
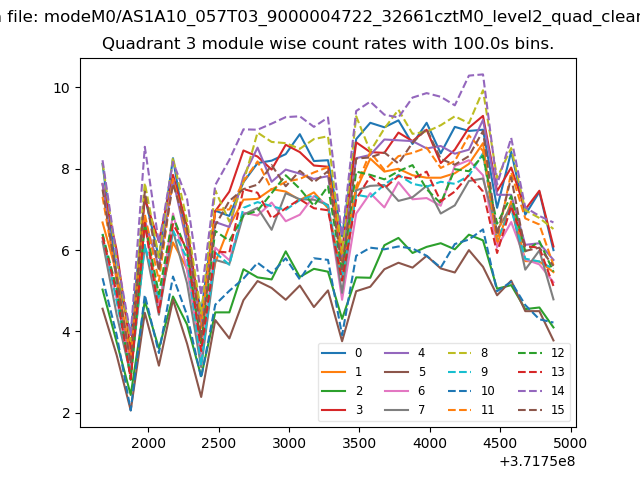
| Module-wise count rates for Quadrant C Data is divided into 100 sec bins |
 |
 |
| Module-wise count rates for Quadrant D Data is divided into 100 sec bins |
 |
 |
| Parameter | Plot |
|---|---|
| CZT HV Monitor | 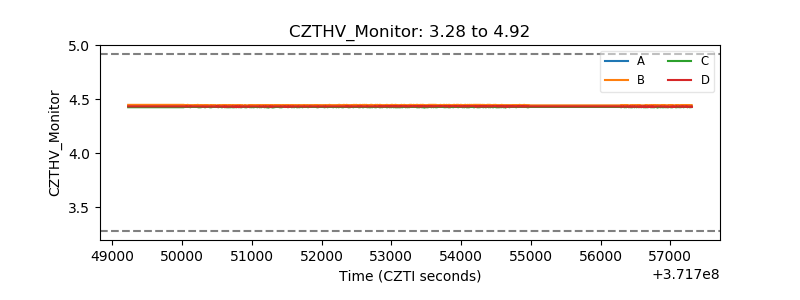 |
| D_VDD | 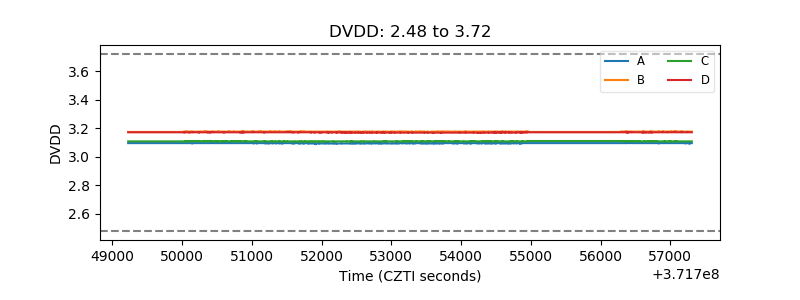 |
| Temperature 1 | 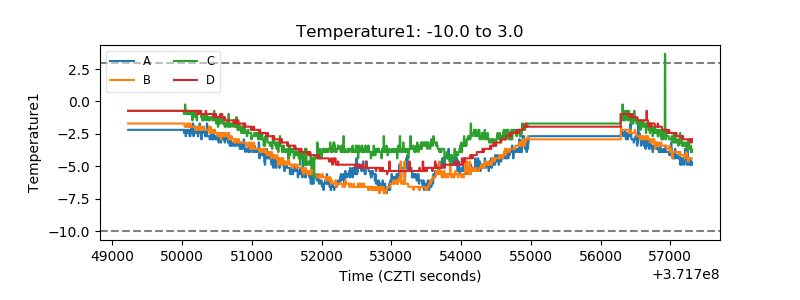 |
| Veto HV Monitor | 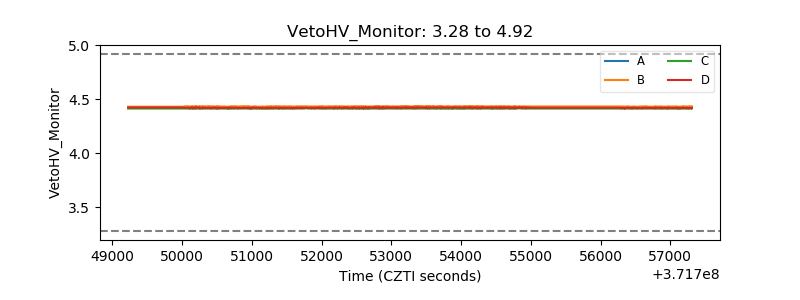 |
| Veto LLD | 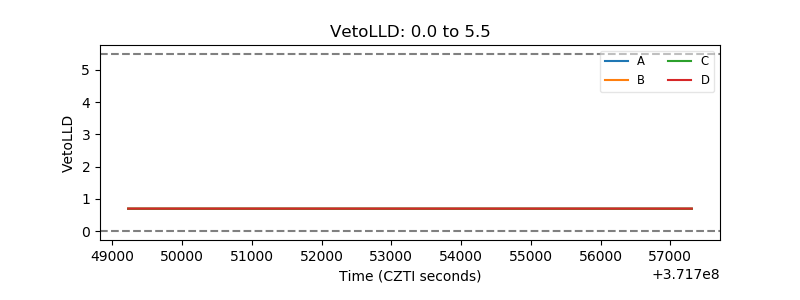 |
| Alpha Counter | 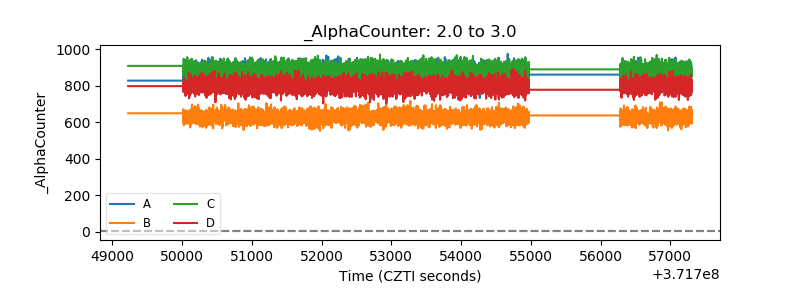 |
| _CPM_Rate | 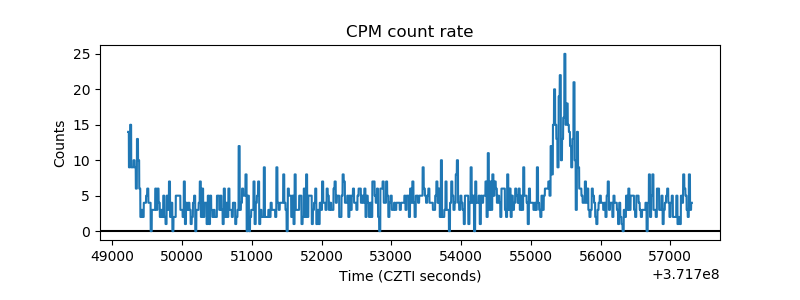 |
| CZT Counter | 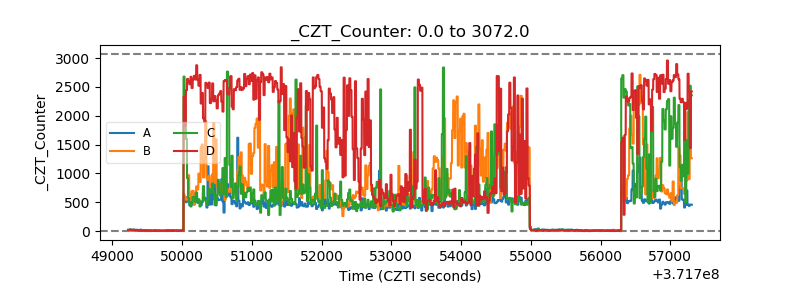 |
| +2.5 Volts monitor |  |
| +5 Volts monitor |  |
| _ROLL_ROT | 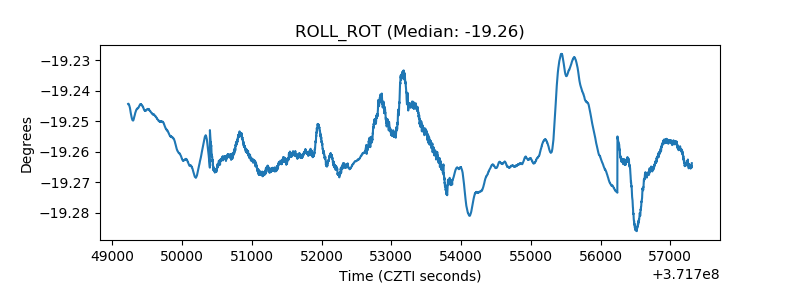 |
| _Roll_DEC | 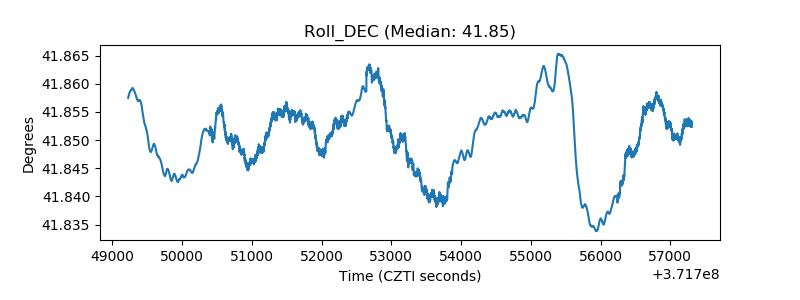 |
| _Roll_RA | 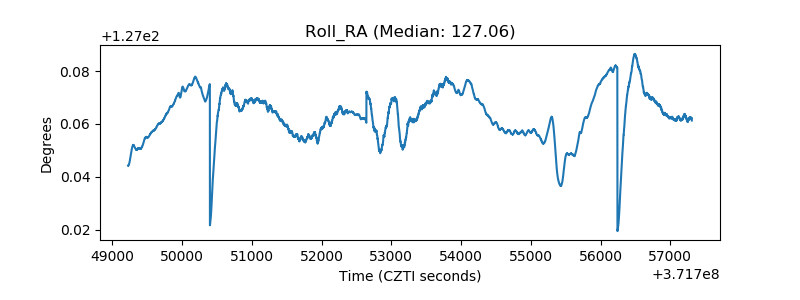 |
| Veto Counter | 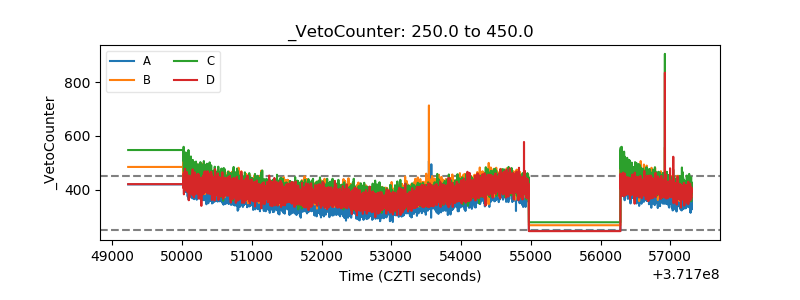 |