| Param | Original file | Final file |
|---|---|---|
| Filename | modeM0/AS1A10_057T03_9000004722_32668cztM0_level2.evt | modeM0/AS1A10_057T03_9000004722_32668cztM0_level2_quad_clean.evt |
| Size (bytes) | 578,894,400 | 75,487,680 |
| Size | 552.1 MB | 72.0 MB |
| Events in quadrant A | 2,835,827 | 495,152 |
| Events in quadrant B | 3,812,568 | 501,282 |
| Events in quadrant C | 2,834,754 | 492,054 |
| Events in quadrant D | 7,694,928 | 430,993 |
| Mode M0 | |||
|---|---|---|---|
| Quadrant | BADHDUFLAG | Total packets | Discarded packets |
| A | 0 | 11687 | 3 |
| B | 0 | 14863 | 2 |
| C | 0 | 11781 | 2 |
| D | 0 | 26479 | 2 |
| Mode M9 | |||
|---|---|---|---|
| Quadrant | BADHDUFLAG | Total packets | Discarded packets |
| A | 0 | 26 | 0 |
| B | 0 | 26 | 0 |
| C | 0 | 26 | 0 |
| D | 0 | 27 | 0 |
| Mode SS | |||
|---|---|---|---|
| Quadrant | BADHDUFLAG | Total packets | Discarded packets |
| A | 0 | 106 | 0 |
| B | 0 | 106 | 0 |
| C | 0 | 106 | 0 |
| D | 0 | 106 | 0 |
| Quadrant | Total seconds | Saturated seconds | Saturation percentage |
|---|---|---|---|
| A | 5229 | 83 | 1.587302% |
| B | 5229 | 85 | 1.625550% |
| C | 5229 | 100 | 1.912412% |
| D | 5229 | 1775 | 33.945305% |
Noise dominated data is calculated using 1-second bins in cleaned event files. If a bin has >2000 counts, and if more than 50% of those come from <1% of pixels, then it is considered to be noise-dominated and hence unusable.
| Quadrant | # 1 sec bins | Bins with >0 counts | Bins with >2000 counts | High rate bins dominated by noise | Noise dominated (total time) | Noise dominated (detector-on time) | Marked lightcurve |
|---|---|---|---|---|---|---|---|
| A | 7082 | 5230 | 66 | 66 | 0.93% | 1.26% | 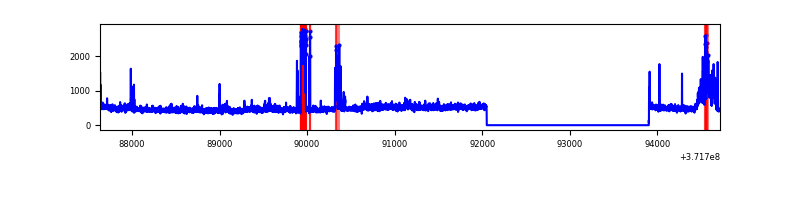 |
| B | 7082 | 5230 | 44 | 44 | 0.62% | 0.84% | 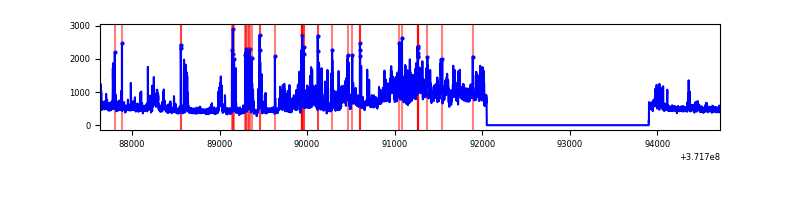 |
| C | 7082 | 5230 | 78 | 78 | 1.10% | 1.49% | 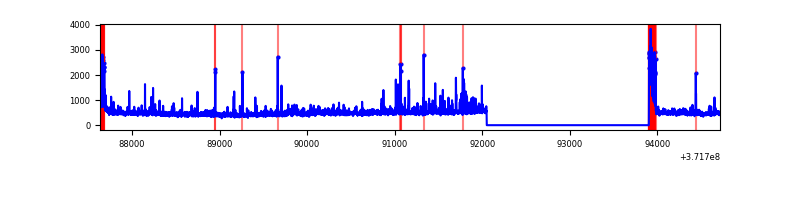 |
| D | 7082 | 5230 | 1675 | 1675 | 23.65% | 32.03% | 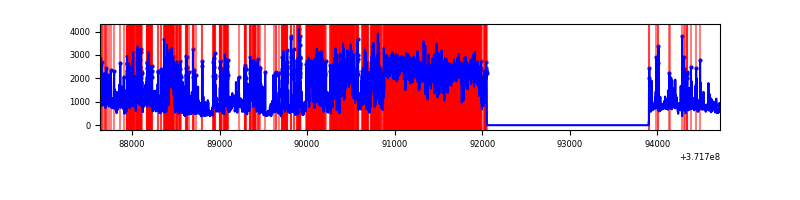 |
Top three noisy pixels from each quadrant. If the there are fewer than three noisy pixels in the level2.evt file, extra rows are filled as -1
| Pixel properties | Quadrant properties | ||||||
|---|---|---|---|---|---|---|---|
| Quadrant | DetID | PixID | Counts | Sigma | Mean | Median | Sigma |
| A | 15 | 249 | 196245 | 1588.75 | 617 | 605 | 123.1 |
| A | 0 | 253 | 128153 | 1035.79 | 617 | 605 | 123.1 |
| A | 14 | 238 | 65516 | 527.13 | 617 | 605 | 123.1 |
| B | 0 | 219 | 429576 | 3626.14 | 625 | 615 | 118.3 |
| B | 12 | 1 | 353880 | 2986.26 | 625 | 615 | 118.3 |
| B | 3 | 26 | 267516 | 2256.2 | 625 | 615 | 118.3 |
| C | 0 | 10 | 267217 | 1960.28 | 591 | 597 | 136.0 |
| C | 8 | 35 | 99873 | 729.91 | 591 | 597 | 136.0 |
| C | 8 | 34 | 49354 | 358.48 | 591 | 597 | 136.0 |
| D | 7 | 38 | 1291269 | 10913.95 | 494 | 483 | 118.3 |
| D | 7 | 80 | 813275 | 6872.38 | 494 | 483 | 118.3 |
| D | 12 | 33 | 753018 | 6362.89 | 494 | 483 | 118.3 |
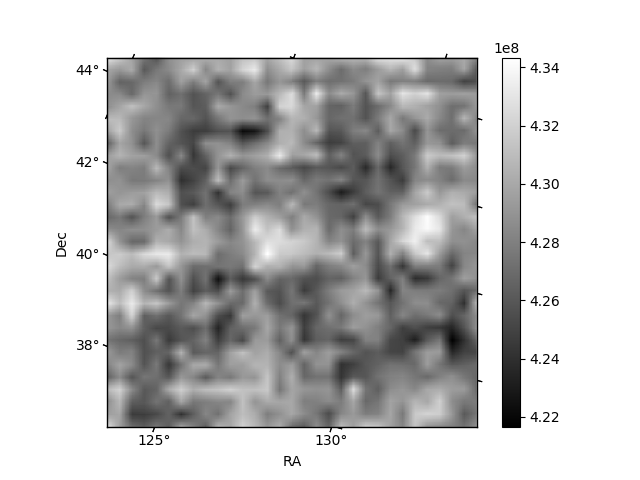
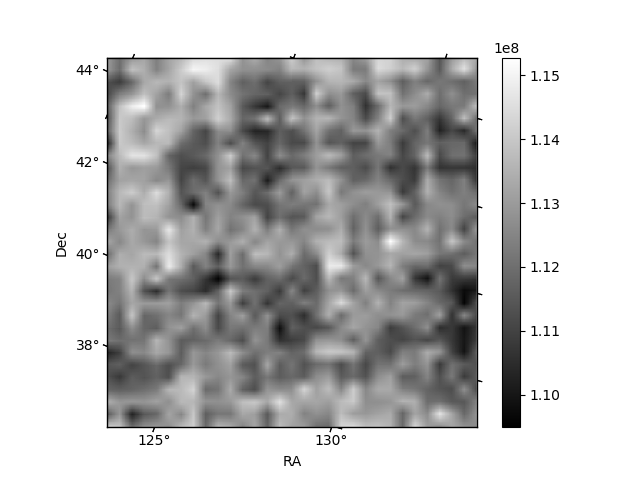
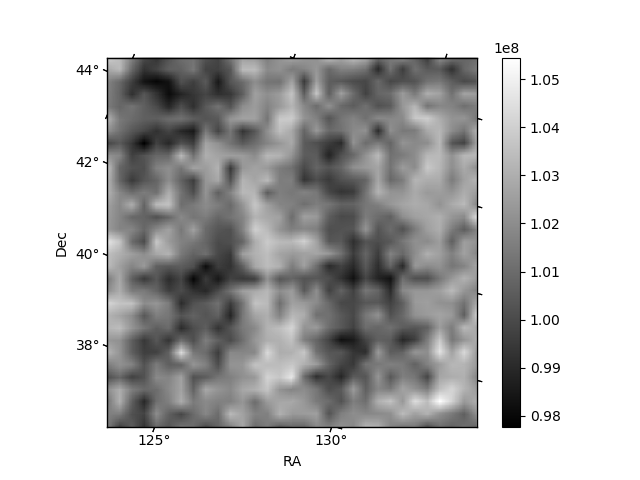
Histogram calculated using DETX and DETY for each event in the final _common_clean file
| Quadrant A | 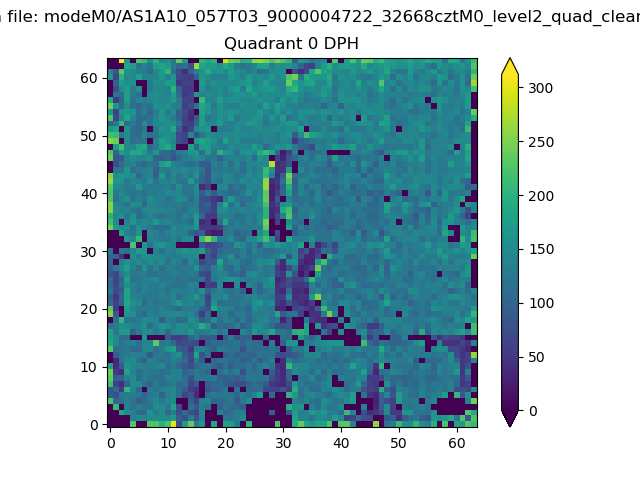 |
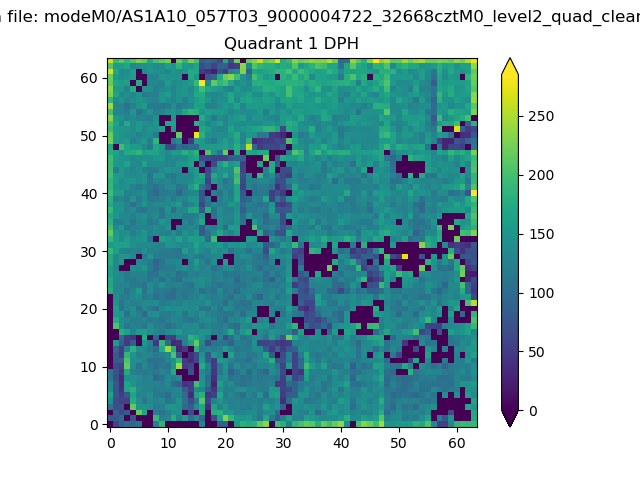 |
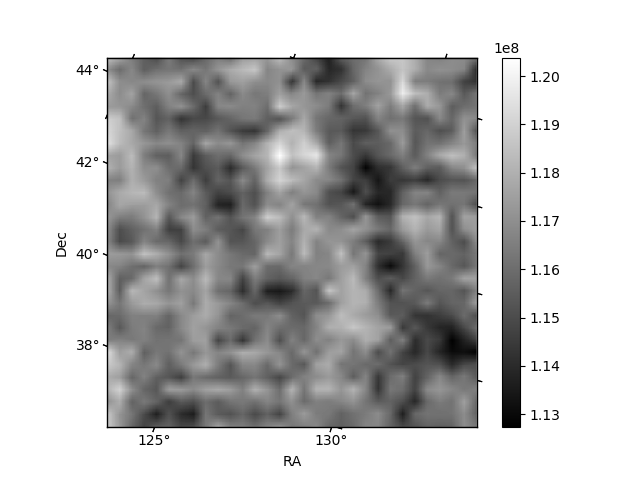
Quadrant B |
|---|---|---|---|
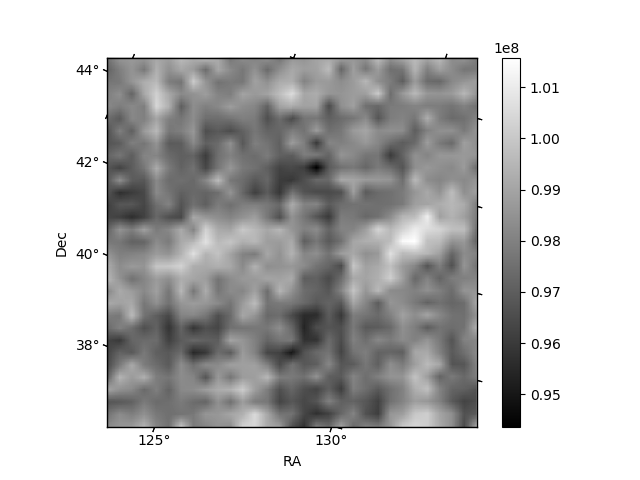
| Quadrant D | 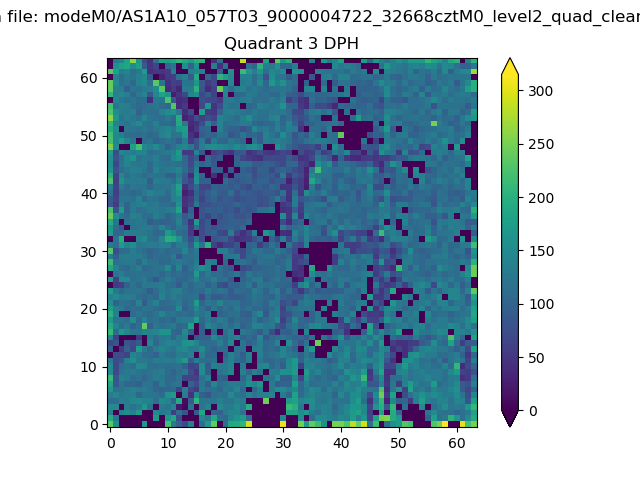 |
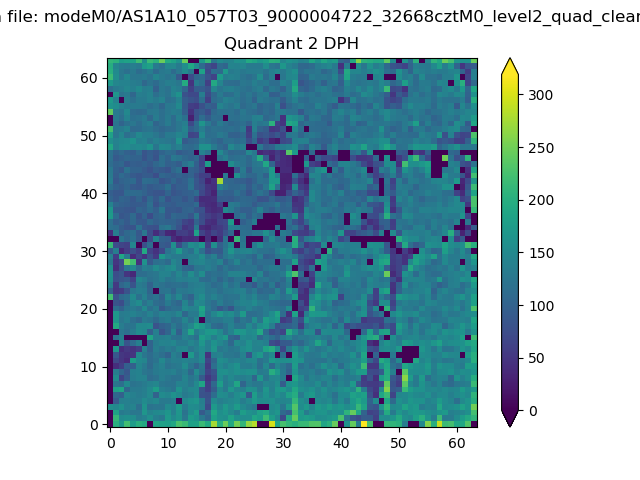 |
Quadrant C |
| Plot type | Count rate plots | Images |
|---|---|---|
| Comparison with Poisson distribution Blue bars denote a histogram of data divided into 1 sec bins. Red curve is a Poisson curve with rate = median count rate of data. |
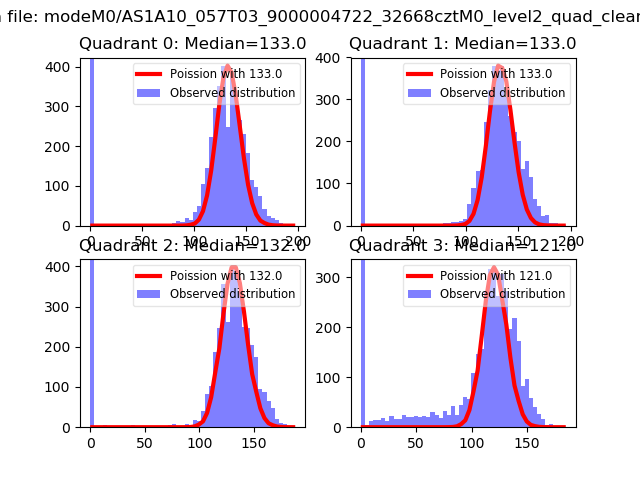 |
 |
| Quadrant-wise count rates Data is divided into 100 sec bins |
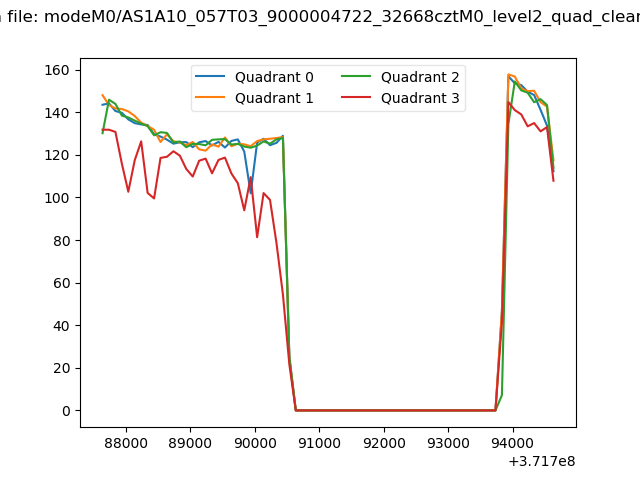 |
|
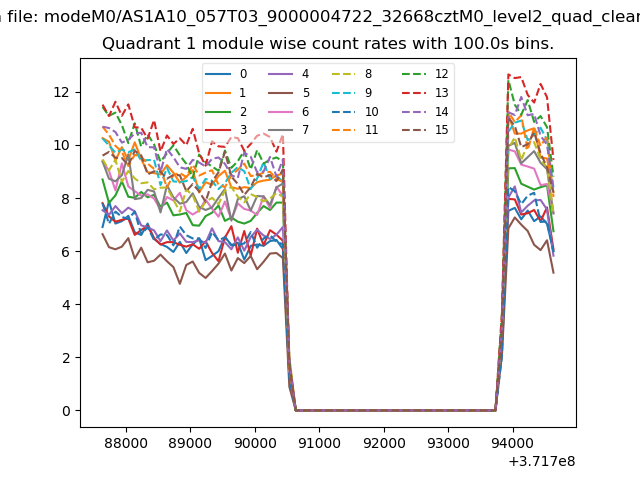
| Module-wise count rates for Quadrant A Data is divided into 100 sec bins |
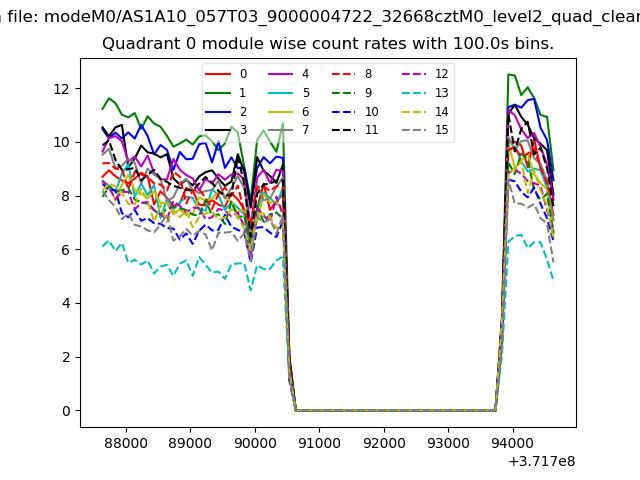 |
 |
| Module-wise count rates for Quadrant B Data is divided into 100 sec bins |
 |
 |
| Module-wise count rates for Quadrant C Data is divided into 100 sec bins |
 |
 |
| Module-wise count rates for Quadrant D Data is divided into 100 sec bins |
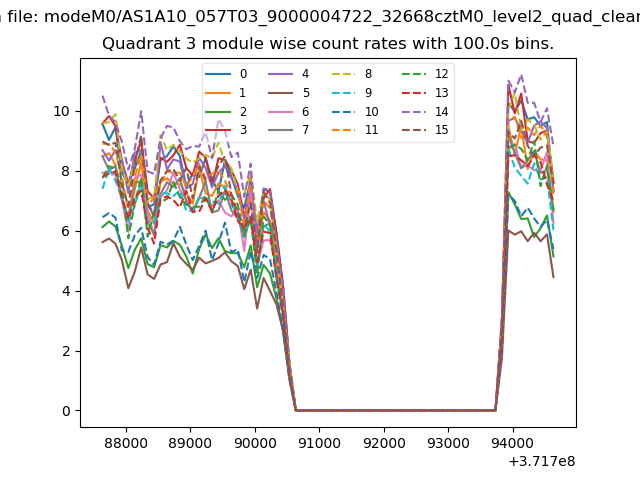 |
 |
| Parameter | Plot |
|---|---|
| CZT HV Monitor | 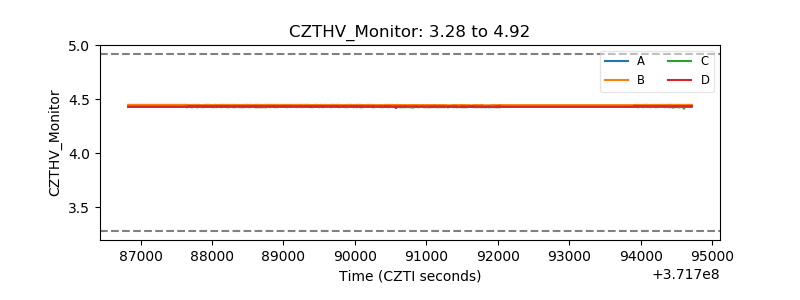 |
| D_VDD | 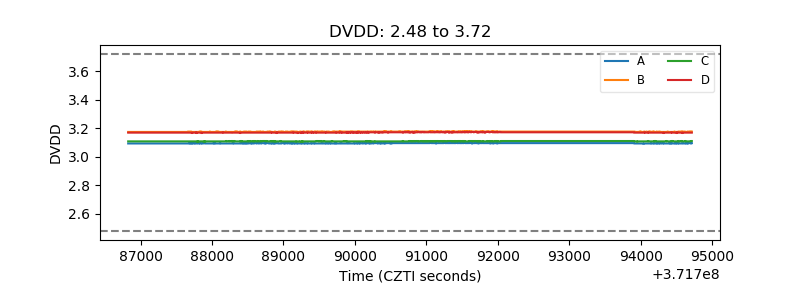 |
| Temperature 1 |  |
| Veto HV Monitor | 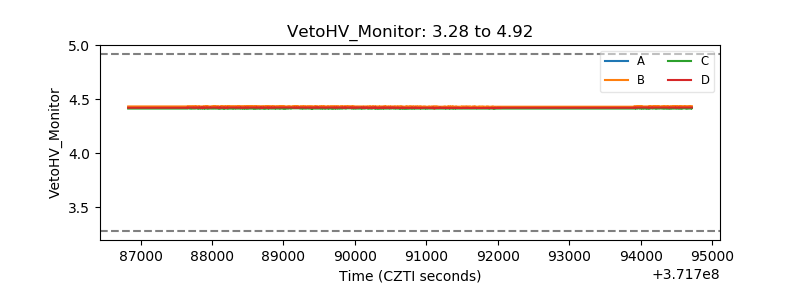 |
| Veto LLD | 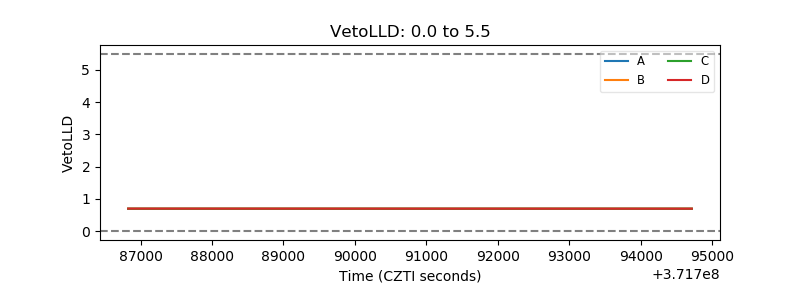 |
| Alpha Counter | 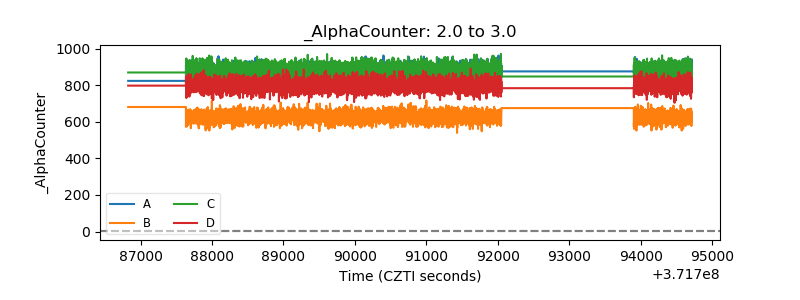 |
| _CPM_Rate | 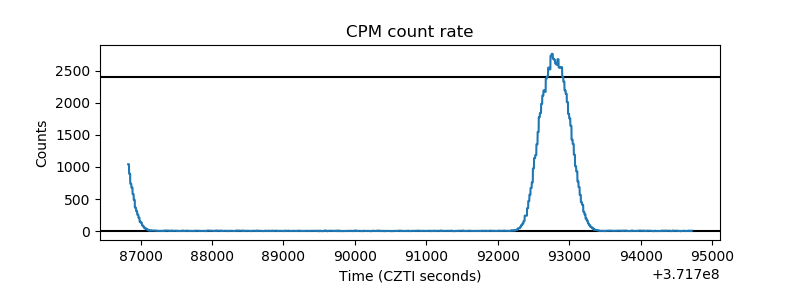 |
| CZT Counter | 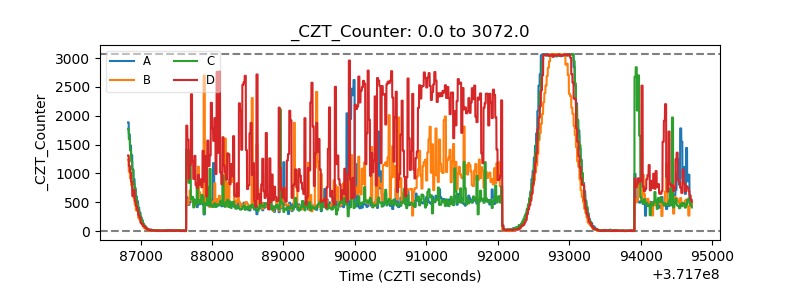 |
| +2.5 Volts monitor |  |
| +5 Volts monitor | 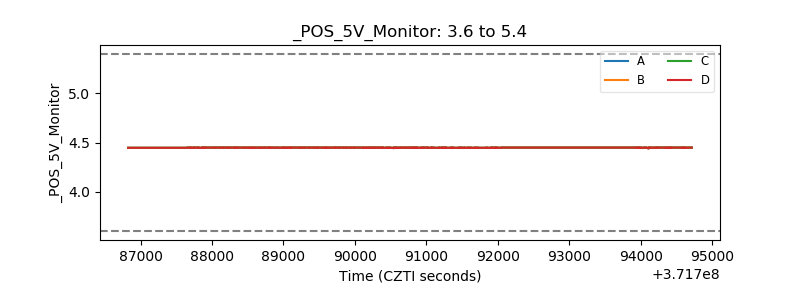 |
| _ROLL_ROT | 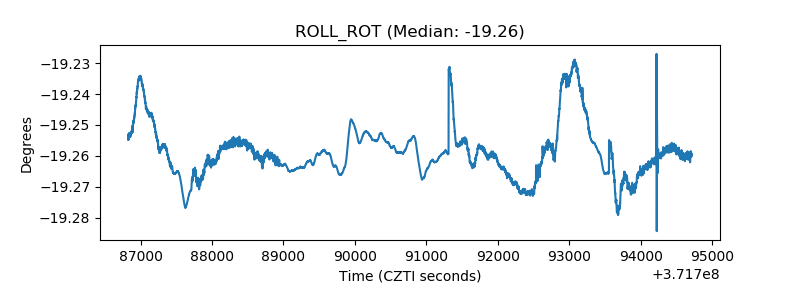 |
| _Roll_DEC | 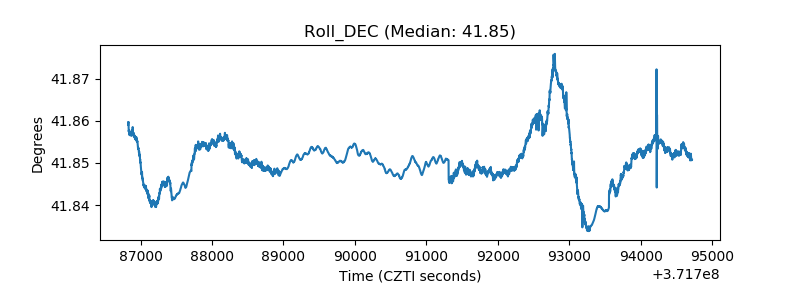 |
| _Roll_RA | 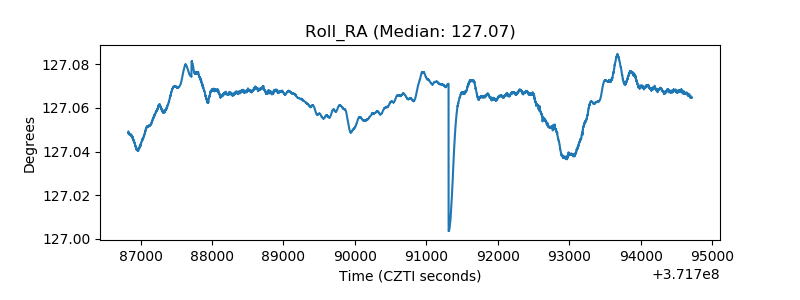 |
| Veto Counter | 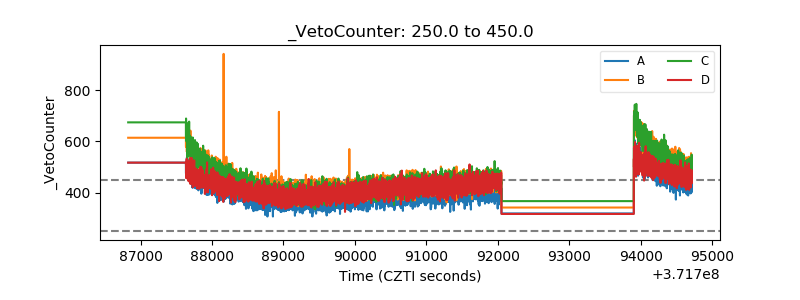 |