| Param | Original file | Final file |
|---|---|---|
| Filename | modeM0/AS1A10_057T03_9000004722_32672cztM0_level2.evt | modeM0/AS1A10_057T03_9000004722_32672cztM0_level2_quad_clean.evt |
| Size (bytes) | 672,661,440 | 60,667,200 |
| Size | 641.5 MB | 57.9 MB |
| Events in quadrant A | 4,091,584 | 381,730 |
| Events in quadrant B | 4,026,885 | 395,954 |
| Events in quadrant C | 3,065,745 | 395,384 |
| Events in quadrant D | 8,851,868 | 314,889 |
| Mode M0 | |||
|---|---|---|---|
| Quadrant | BADHDUFLAG | Total packets | Discarded packets |
| A | 0 | 15127 | 3 |
| B | 0 | 15330 | 2 |
| C | 0 | 12103 | 2 |
| D | 0 | 29747 | 2 |
| Mode M9 | |||
|---|---|---|---|
| Quadrant | BADHDUFLAG | Total packets | Discarded packets |
| A | 0 | 26 | 0 |
| B | 0 | 26 | 0 |
| C | 0 | 26 | 0 |
| D | 0 | 27 | 0 |
| Mode SS | |||
|---|---|---|---|
| Quadrant | BADHDUFLAG | Total packets | Discarded packets |
| A | 0 | 102 | 0 |
| B | 0 | 102 | 0 |
| C | 0 | 102 | 0 |
| D | 0 | 102 | 0 |
| Quadrant | Total seconds | Saturated seconds | Saturation percentage |
|---|---|---|---|
| A | 4962 | 571 | 11.507457% |
| B | 4962 | 293 | 5.904877% |
| C | 4962 | 164 | 3.305119% |
| D | 4962 | 2701 | 54.433696% |
Noise dominated data is calculated using 1-second bins in cleaned event files. If a bin has >2000 counts, and if more than 50% of those come from <1% of pixels, then it is considered to be noise-dominated and hence unusable.
| Quadrant | # 1 sec bins | Bins with >0 counts | Bins with >2000 counts | High rate bins dominated by noise | Noise dominated (total time) | Noise dominated (detector-on time) | Marked lightcurve |
|---|---|---|---|---|---|---|---|
| A | 7086 | 4963 | 482 | 482 | 6.80% | 9.71% | 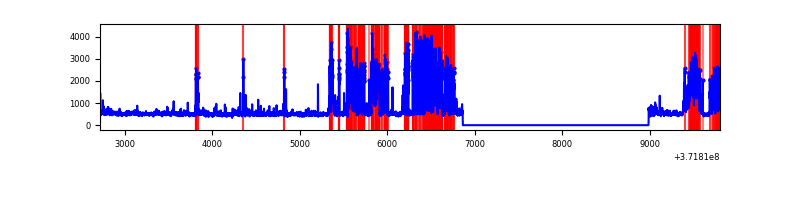 |
| B | 7086 | 4963 | 273 | 273 | 3.85% | 5.50% | 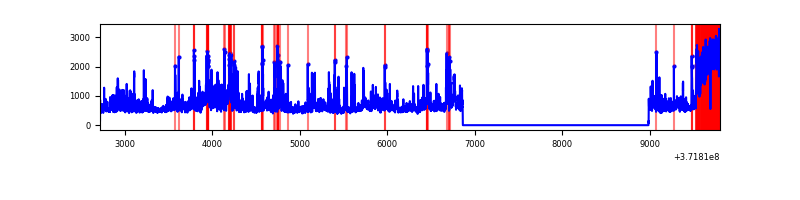 |
| C | 7086 | 4963 | 143 | 143 | 2.02% | 2.88% | 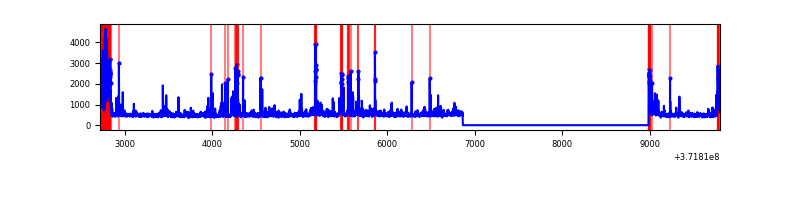 |
| D | 7086 | 4963 | 2546 | 2546 | 35.93% | 51.30% | 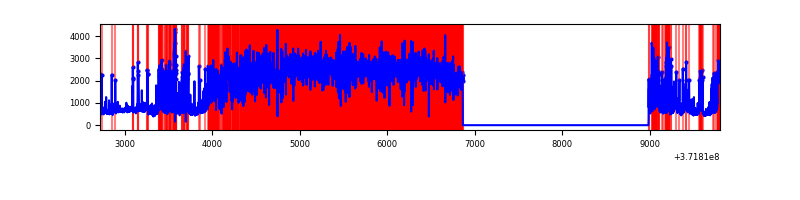 |
Top three noisy pixels from each quadrant. If the there are fewer than three noisy pixels in the level2.evt file, extra rows are filled as -1
| Pixel properties | Quadrant properties | ||||||
|---|---|---|---|---|---|---|---|
| Quadrant | DetID | PixID | Counts | Sigma | Mean | Median | Sigma |
| A | 15 | 249 | 1331830 | 11322.25 | 586 | 575 | 117.6 |
| A | 15 | 174 | 375367 | 3187.58 | 586 | 575 | 117.6 |
| A | 12 | 189 | 67991 | 573.37 | 586 | 575 | 117.6 |
| B | 0 | 255 | 491157 | 4322.45 | 604 | 594 | 113.5 |
| B | 3 | 26 | 389252 | 3424.55 | 604 | 594 | 113.5 |
| B | 0 | 219 | 328901 | 2892.78 | 604 | 594 | 113.5 |
| C | 0 | 10 | 278439 | 2073.59 | 582 | 588 | 134.0 |
| C | 9 | 236 | 273039 | 2033.29 | 582 | 588 | 134.0 |
| C | 0 | 207 | 62751 | 463.92 | 582 | 588 | 134.0 |
| D | 7 | 38 | 4027732 | 40111.03 | 418 | 410 | 100.4 |
| D | 7 | 80 | 839795 | 8360.05 | 418 | 410 | 100.4 |
| D | 12 | 33 | 667618 | 6645.21 | 418 | 410 | 100.4 |
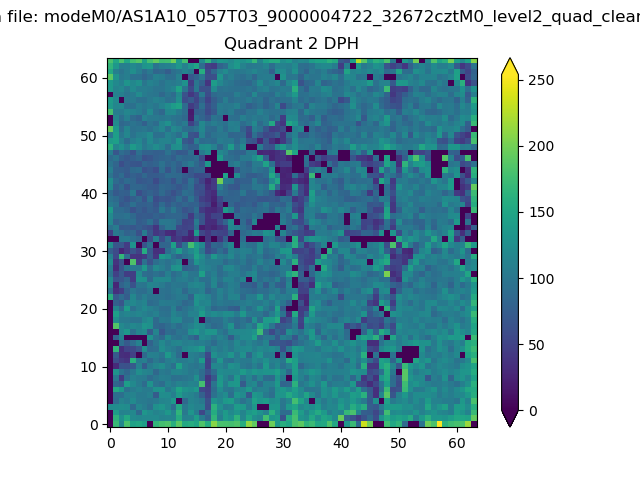
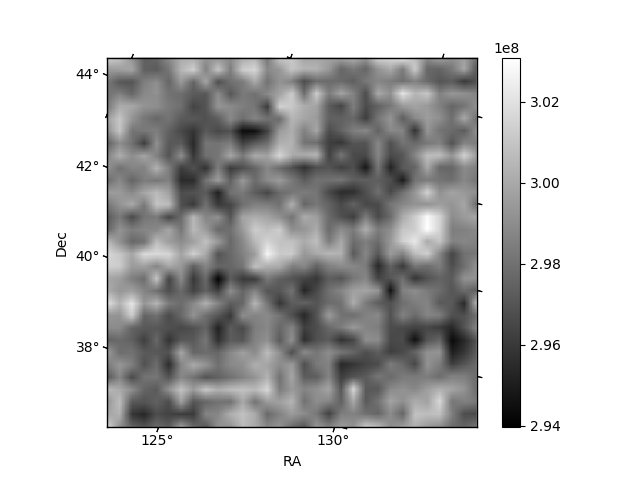
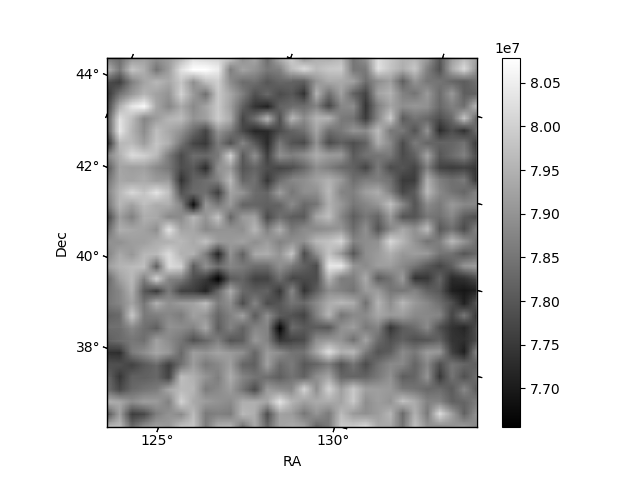
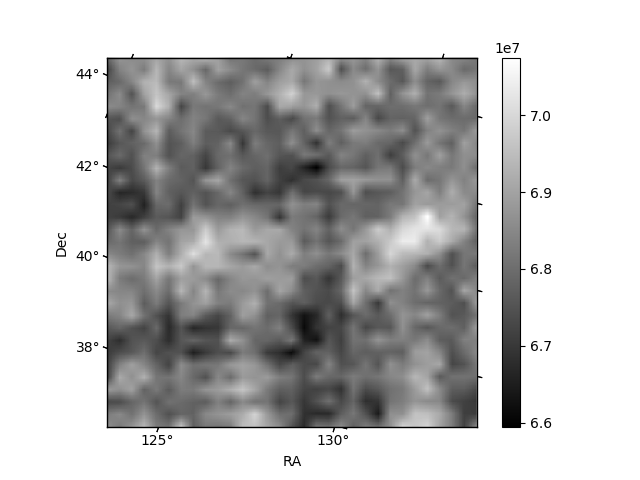
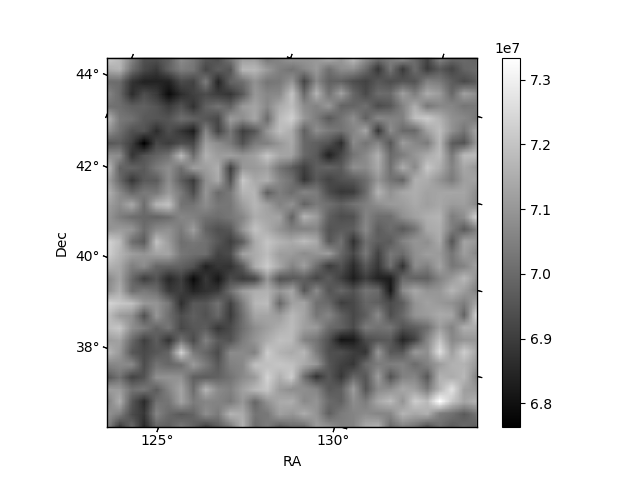
Histogram calculated using DETX and DETY for each event in the final _common_clean file
| Quadrant A | 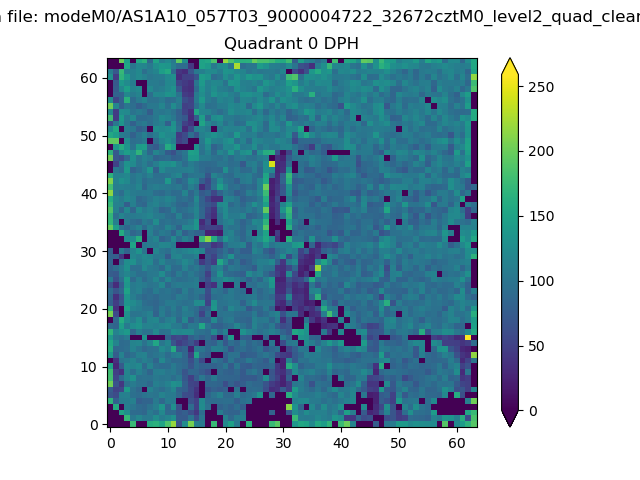 |
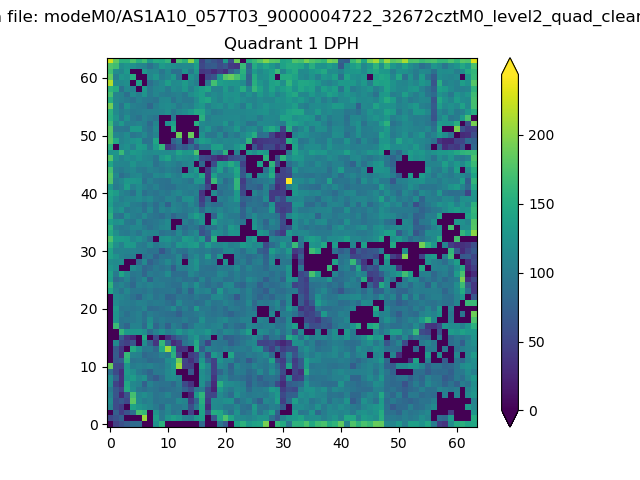 |
Quadrant B |
|---|---|---|---|
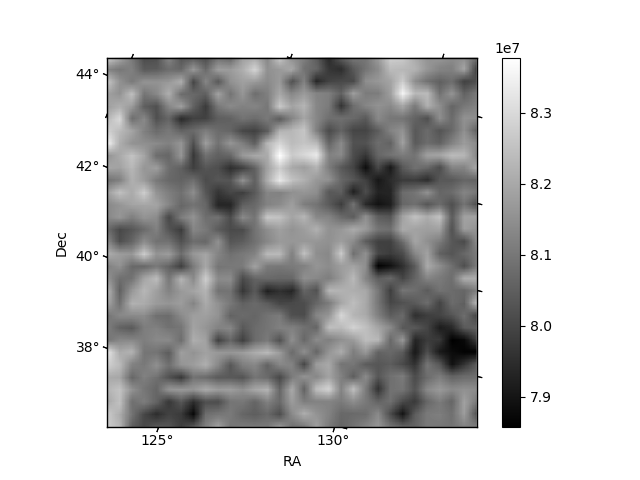
| Quadrant D | 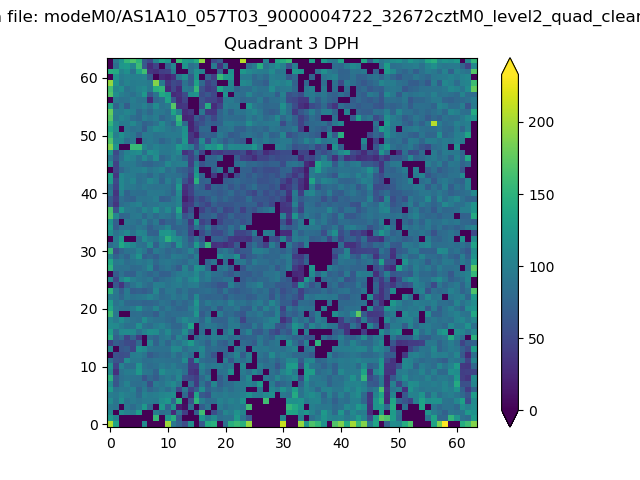 |
 |
Quadrant C |
| Plot type | Count rate plots | Images |
|---|---|---|
| Comparison with Poisson distribution Blue bars denote a histogram of data divided into 1 sec bins. Red curve is a Poisson curve with rate = median count rate of data. |
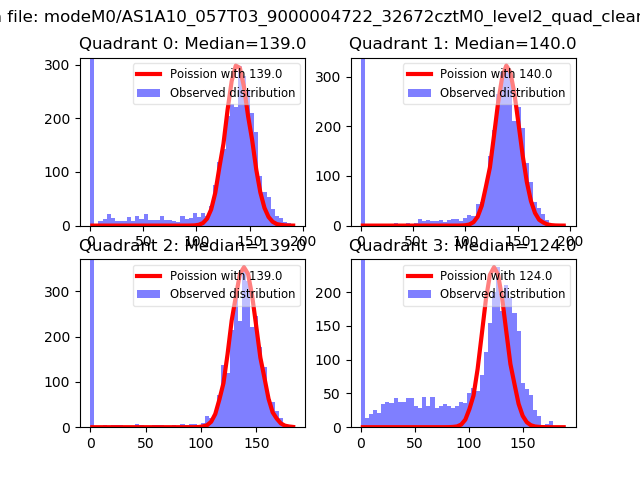 |
 |
| Quadrant-wise count rates Data is divided into 100 sec bins |
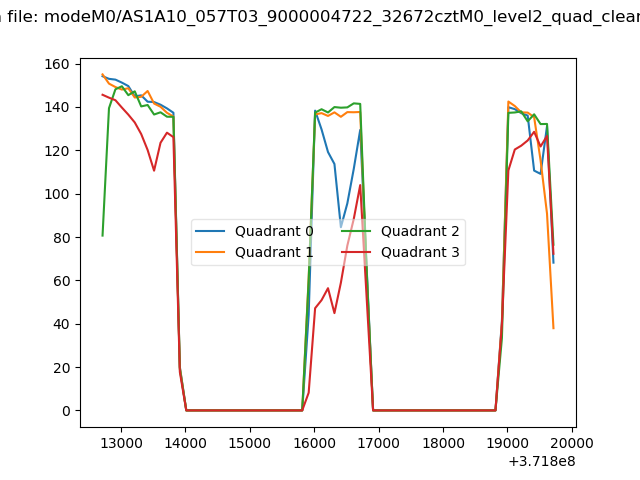 |
|
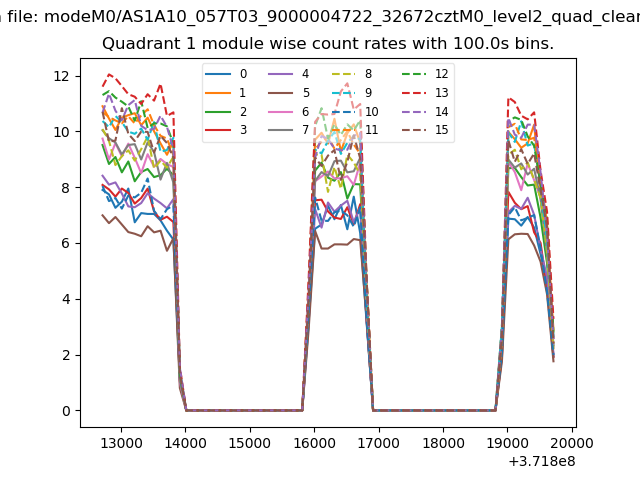
| Module-wise count rates for Quadrant A Data is divided into 100 sec bins |
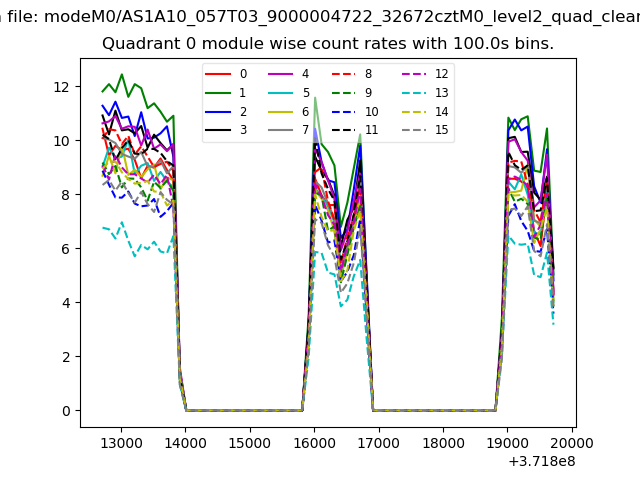 |
 |
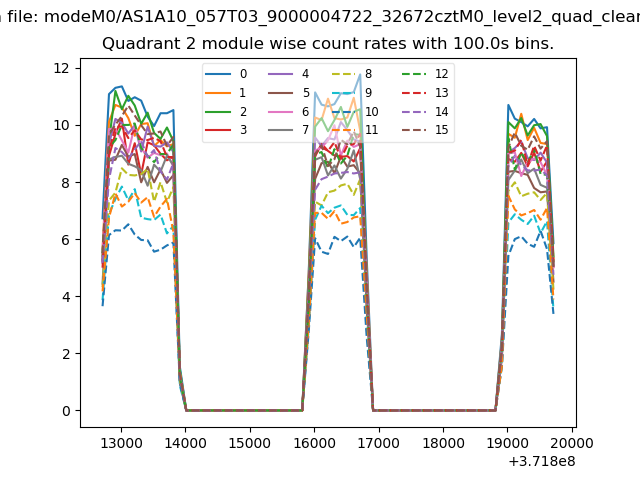
| Module-wise count rates for Quadrant B Data is divided into 100 sec bins |
 |
 |
| Module-wise count rates for Quadrant C Data is divided into 100 sec bins |
 |
 |
| Module-wise count rates for Quadrant D Data is divided into 100 sec bins |
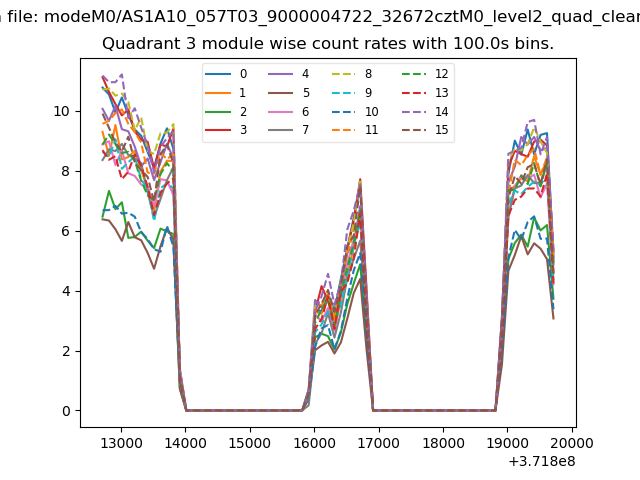 |
 |
| Parameter | Plot |
|---|---|
| CZT HV Monitor | 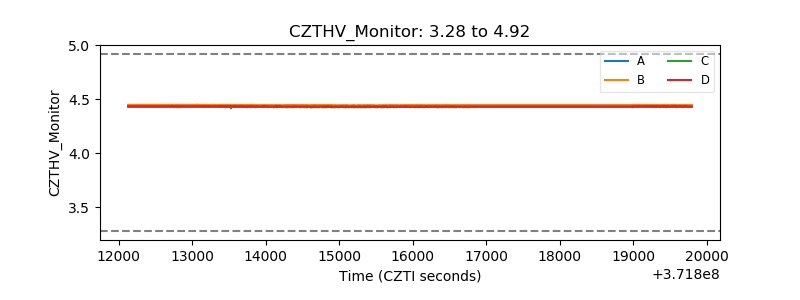 |
| D_VDD | 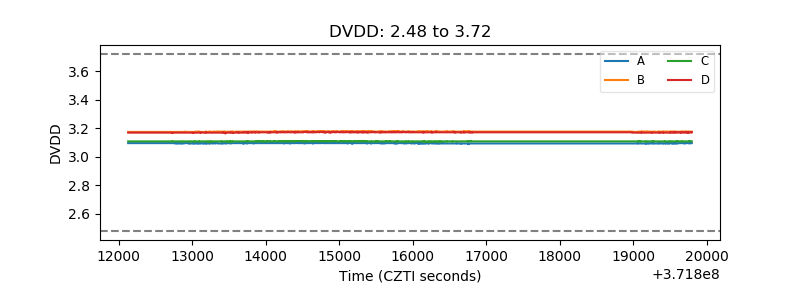 |
| Temperature 1 | 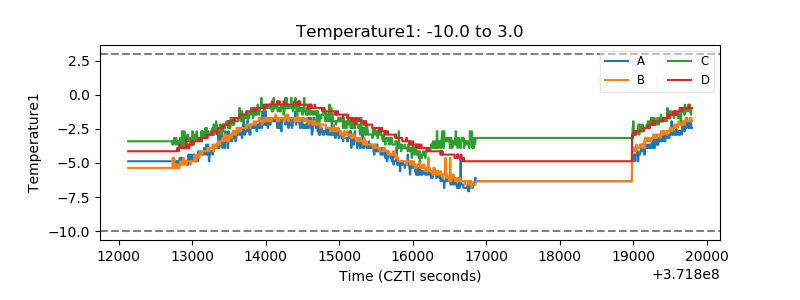 |
| Veto HV Monitor | 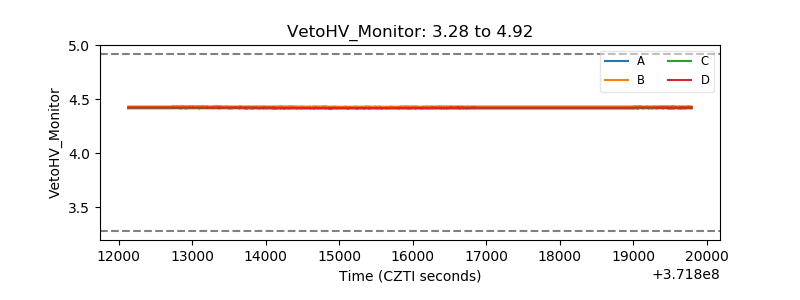 |
| Veto LLD | 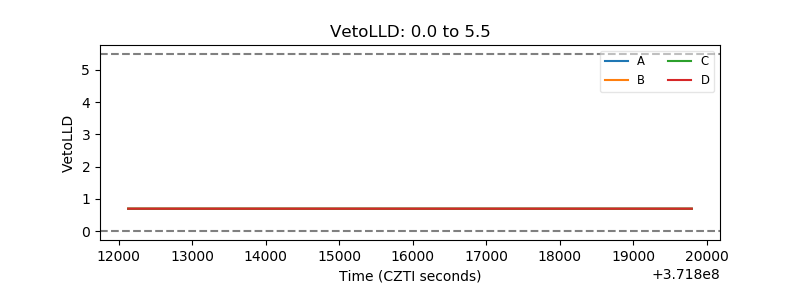 |
| Alpha Counter | 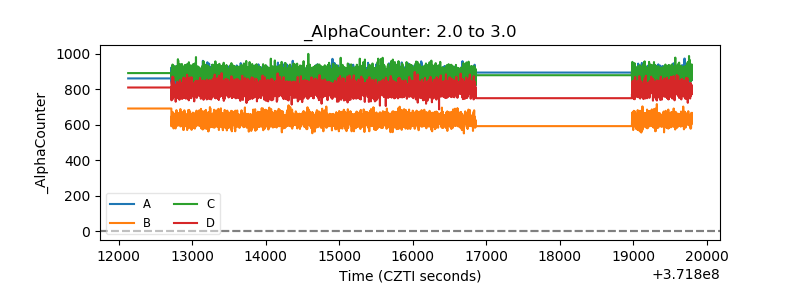 |
| _CPM_Rate | 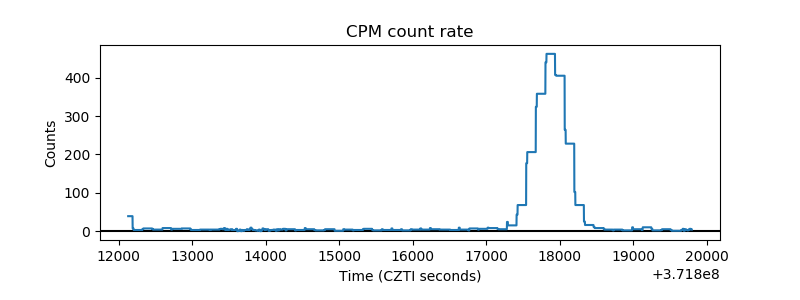 |
| CZT Counter | 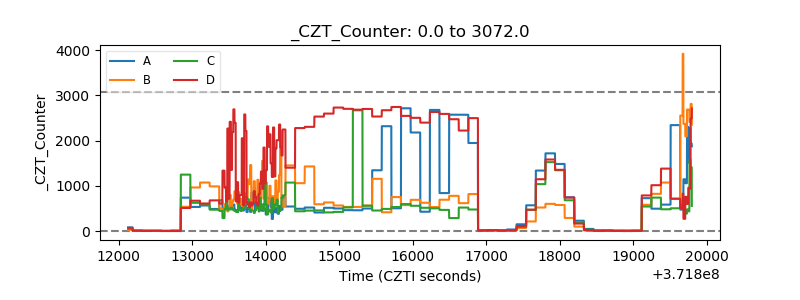 |
| +2.5 Volts monitor |  |
| +5 Volts monitor |  |
| _ROLL_ROT | 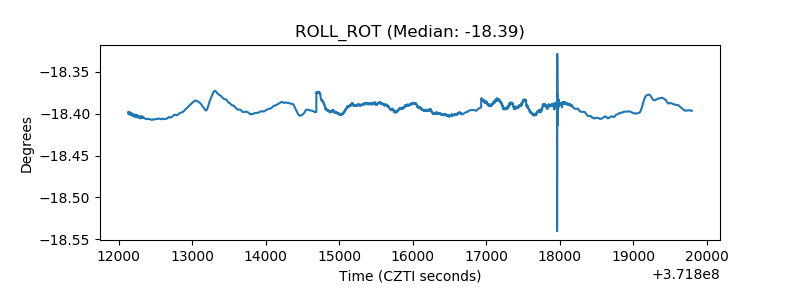 |
| _Roll_DEC | 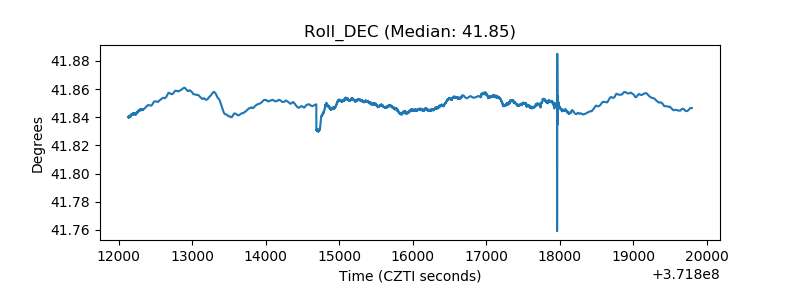 |
| _Roll_RA | 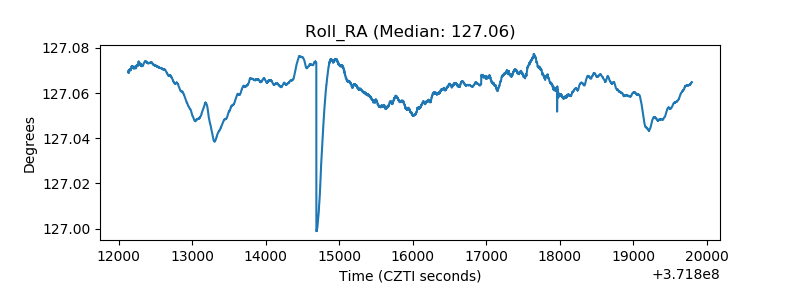 |
| Veto Counter | 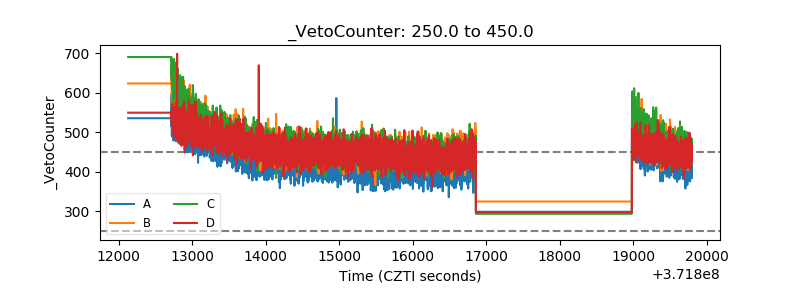 |