| Param | Original file | Final file |
|---|---|---|
| Filename | modeM0/AS1A10_057T03_9000004722_32675cztM0_level2.evt | modeM0/AS1A10_057T03_9000004722_32675cztM0_level2_quad_clean.evt |
| Size (bytes) | 685,368,000 | 61,231,680 |
| Size | 653.6 MB | 58.4 MB |
| Events in quadrant A | 3,688,066 | 373,947 |
| Events in quadrant B | 4,372,030 | 362,082 |
| Events in quadrant C | 3,623,447 | 366,926 |
| Events in quadrant D | 8,670,638 | 335,048 |
| Mode M0 | |||
|---|---|---|---|
| Quadrant | BADHDUFLAG | Total packets | Discarded packets |
| A | 0 | 14899 | 3 |
| B | 0 | 16979 | 2 |
| C | 0 | 14532 | 2 |
| D | 0 | 29815 | 2 |
| Mode M9 | |||
|---|---|---|---|
| Quadrant | BADHDUFLAG | Total packets | Discarded packets |
| A | 0 | 22 | 0 |
| B | 0 | 22 | 0 |
| C | 0 | 22 | 0 |
| D | 0 | 23 | 0 |
| Mode SS | |||
|---|---|---|---|
| Quadrant | BADHDUFLAG | Total packets | Discarded packets |
| A | 0 | 122 | 0 |
| B | 0 | 122 | 0 |
| C | 0 | 122 | 0 |
| D | 0 | 122 | 0 |
| Quadrant | Total seconds | Saturated seconds | Saturation percentage |
|---|---|---|---|
| A | 5946 | 440 | 7.399933% |
| B | 5946 | 135 | 2.270434% |
| C | 5946 | 175 | 2.943155% |
| D | 5946 | 2103 | 35.368315% |
Noise dominated data is calculated using 1-second bins in cleaned event files. If a bin has >2000 counts, and if more than 50% of those come from <1% of pixels, then it is considered to be noise-dominated and hence unusable.
| Quadrant | # 1 sec bins | Bins with >0 counts | Bins with >2000 counts | High rate bins dominated by noise | Noise dominated (total time) | Noise dominated (detector-on time) | Marked lightcurve |
|---|---|---|---|---|---|---|---|
| A | 7318 | 5944 | 167 | 167 | 2.28% | 2.81% | 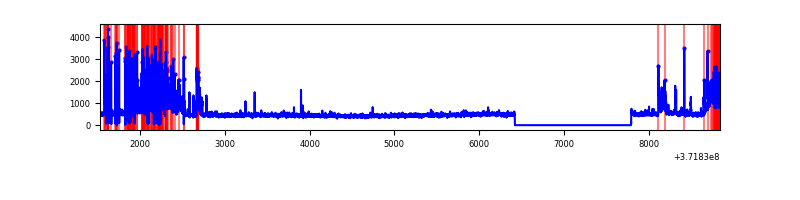 |
| B | 7318 | 5946 | 78 | 78 | 1.07% | 1.31% | 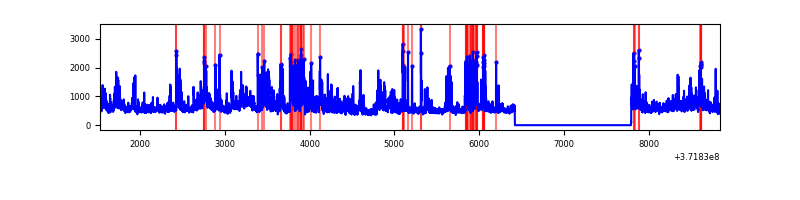 |
| C | 7318 | 5946 | 148 | 148 | 2.02% | 2.49% | 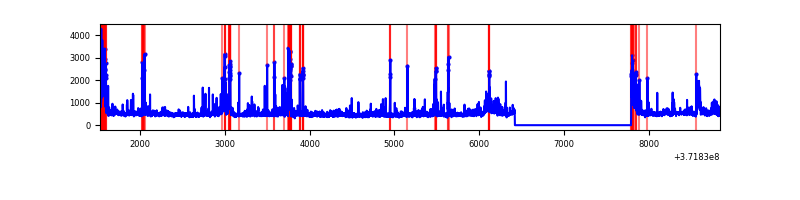 |
| D | 7318 | 5946 | 1739 | 1739 | 23.76% | 29.25% | 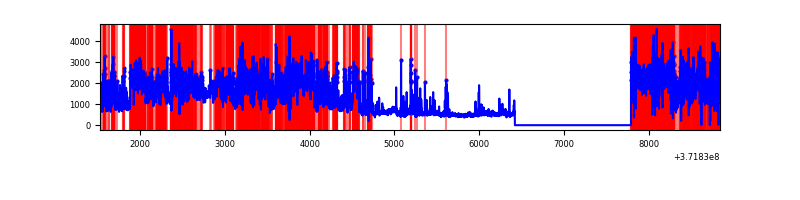 |
Top three noisy pixels from each quadrant. If the there are fewer than three noisy pixels in the level2.evt file, extra rows are filled as -1
| Pixel properties | Quadrant properties | ||||||
|---|---|---|---|---|---|---|---|
| Quadrant | DetID | PixID | Counts | Sigma | Mean | Median | Sigma |
| A | 15 | 249 | 1004329 | 7429.18 | 666 | 653 | 135.1 |
| A | 15 | 174 | 38912 | 283.19 | 666 | 653 | 135.1 |
| A | 7 | 16 | 38614 | 280.99 | 666 | 653 | 135.1 |
| B | 3 | 26 | 627638 | 4689.45 | 700 | 685 | 133.7 |
| B | 0 | 219 | 519113 | 3877.71 | 700 | 685 | 133.7 |
| B | 4 | 251 | 160442 | 1194.94 | 700 | 685 | 133.7 |
| C | 9 | 236 | 329525 | 2086.3 | 669 | 673 | 157.6 |
| C | 0 | 10 | 323342 | 2047.07 | 669 | 673 | 157.6 |
| C | 9 | 54 | 131999 | 833.16 | 669 | 673 | 157.6 |
| D | 7 | 38 | 3715317 | 27212.82 | 567 | 555 | 136.5 |
| D | 8 | 195 | 842025 | 6164.26 | 567 | 555 | 136.5 |
| D | 7 | 80 | 659889 | 4830.01 | 567 | 555 | 136.5 |
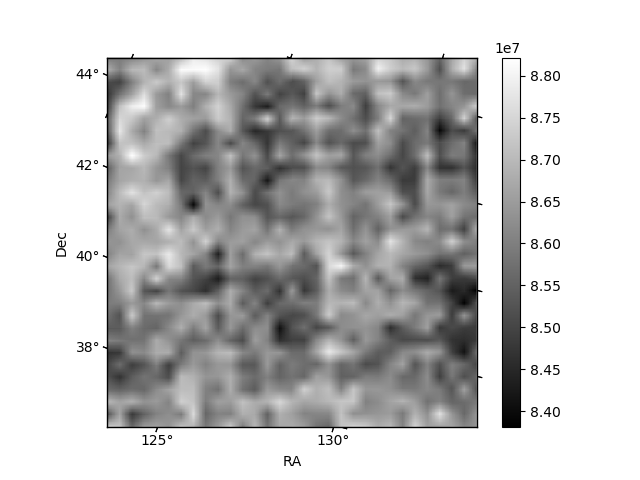
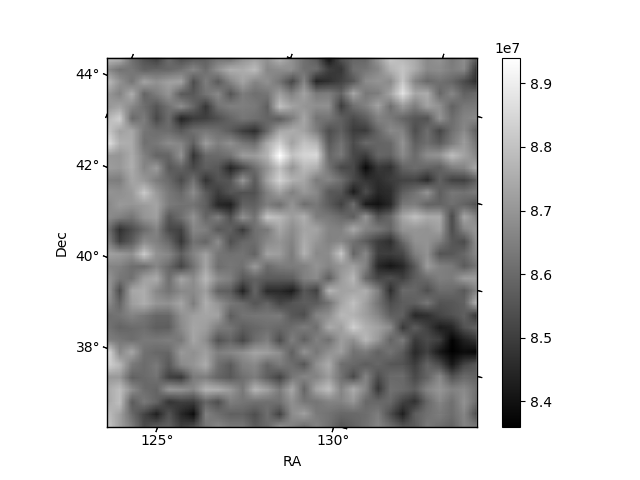
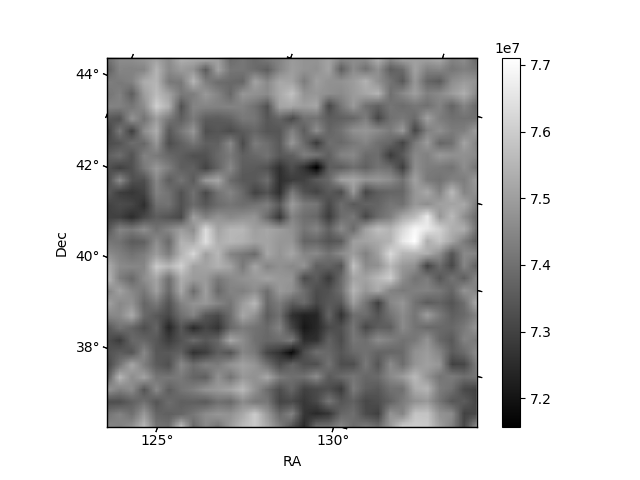
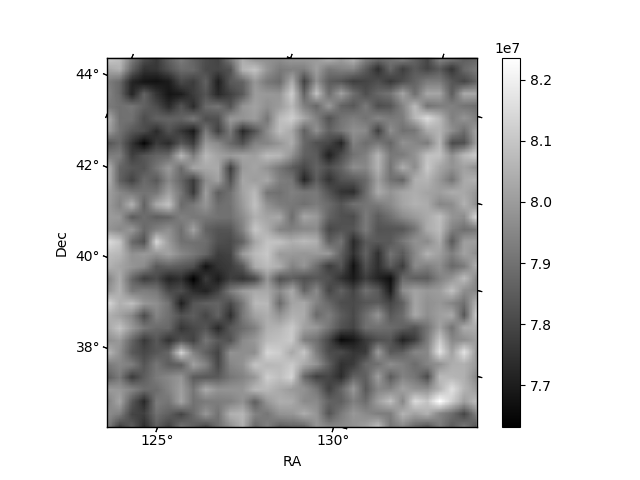
Histogram calculated using DETX and DETY for each event in the final _common_clean file
| Quadrant A |  |
 |
Quadrant B |
|---|---|---|---|
| Quadrant D | 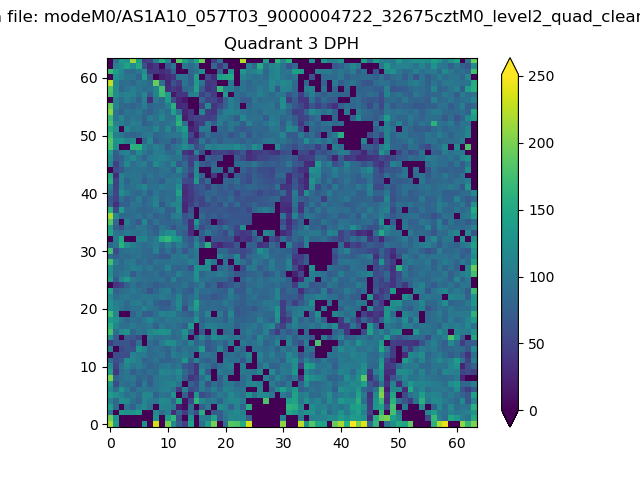 |
 |
Quadrant C |
| Plot type | Count rate plots | Images |
|---|---|---|
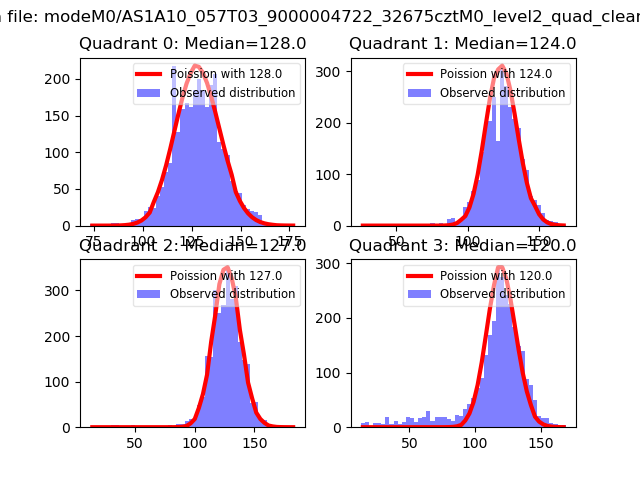
| Comparison with Poisson distribution Blue bars denote a histogram of data divided into 1 sec bins. Red curve is a Poisson curve with rate = median count rate of data. |
 |
 |
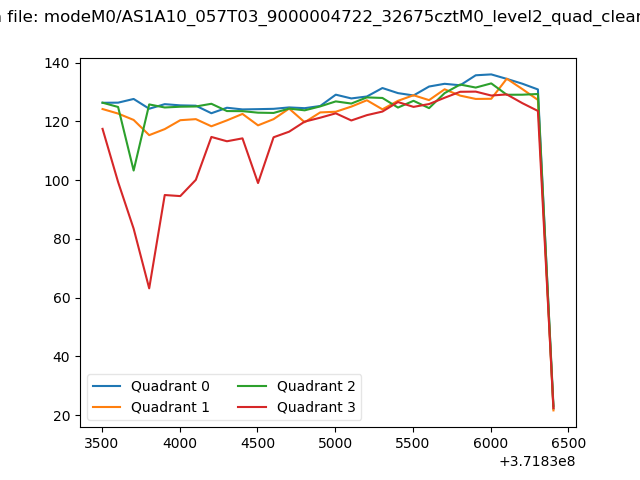
| Quadrant-wise count rates Data is divided into 100 sec bins |
 |
|
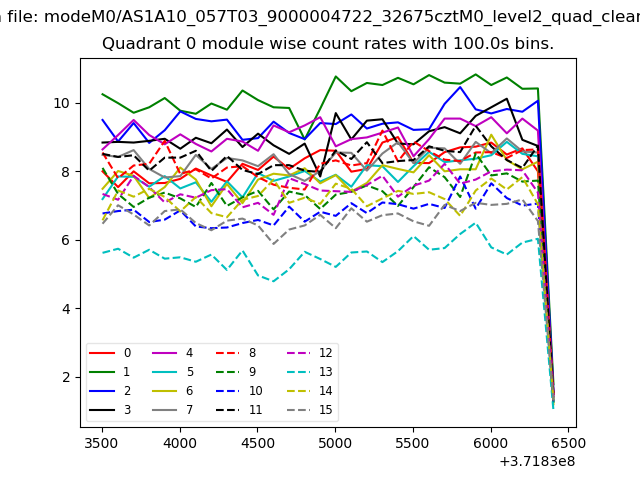
| Module-wise count rates for Quadrant A Data is divided into 100 sec bins |
 |
 |
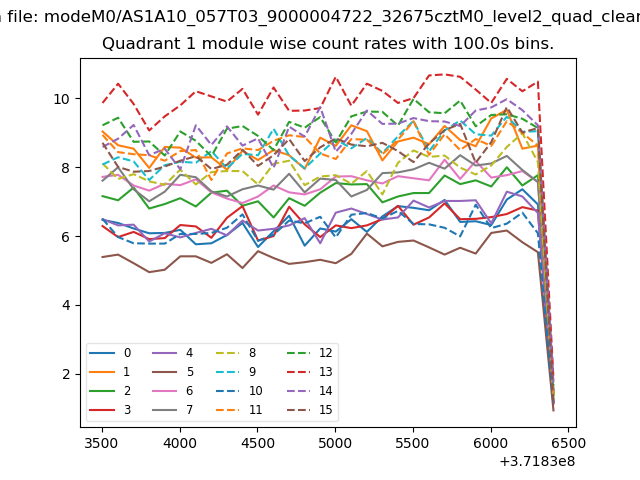
| Module-wise count rates for Quadrant B Data is divided into 100 sec bins |
 |
 |
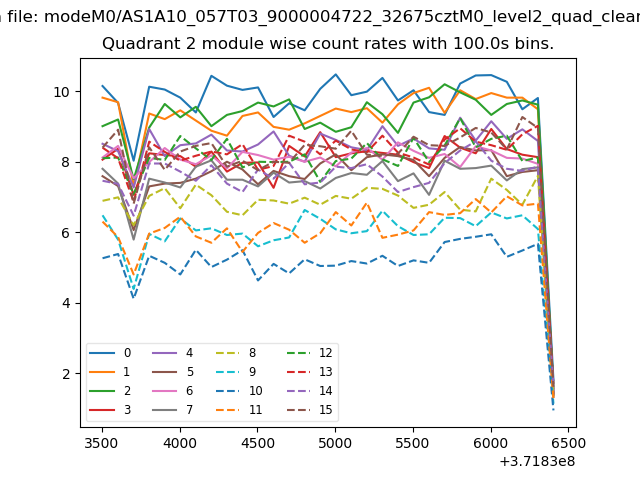
| Module-wise count rates for Quadrant C Data is divided into 100 sec bins |
 |
 |
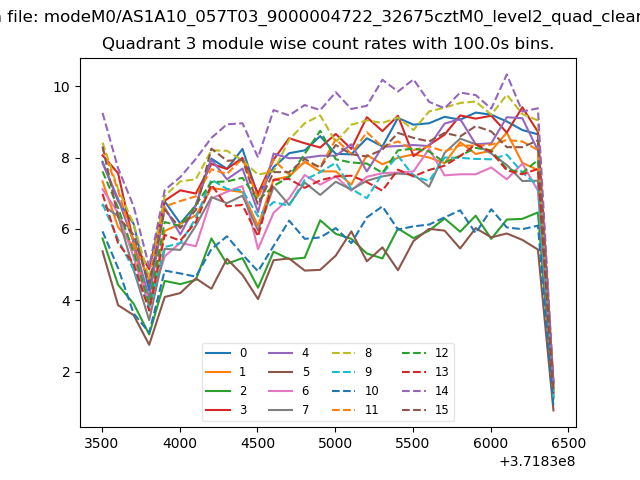
| Module-wise count rates for Quadrant D Data is divided into 100 sec bins |
 |
 |
| Parameter | Plot |
|---|---|
| CZT HV Monitor |  |
| D_VDD | 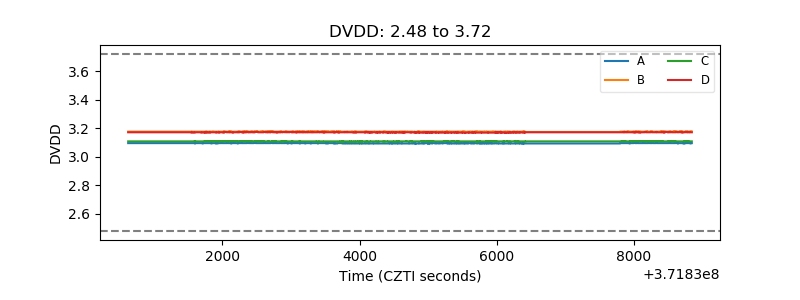 |
| Temperature 1 | 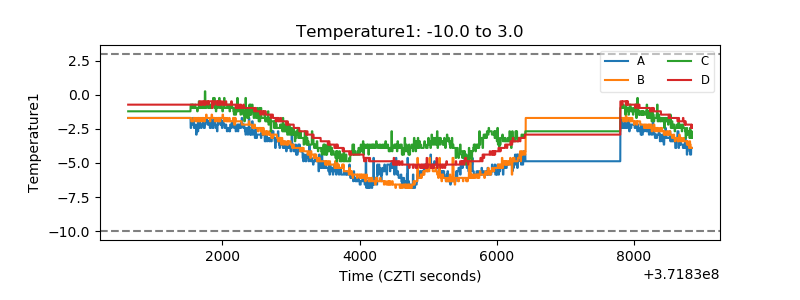 |
| Veto HV Monitor | 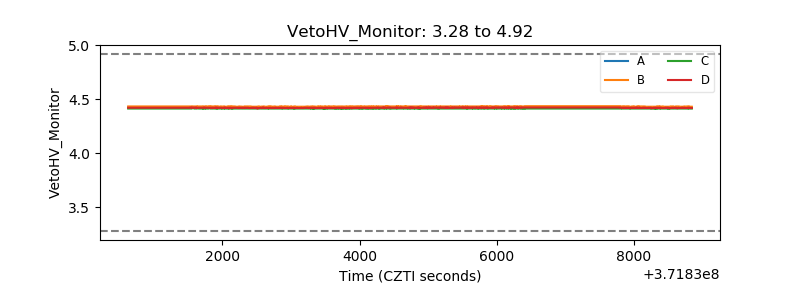 |
| Veto LLD | 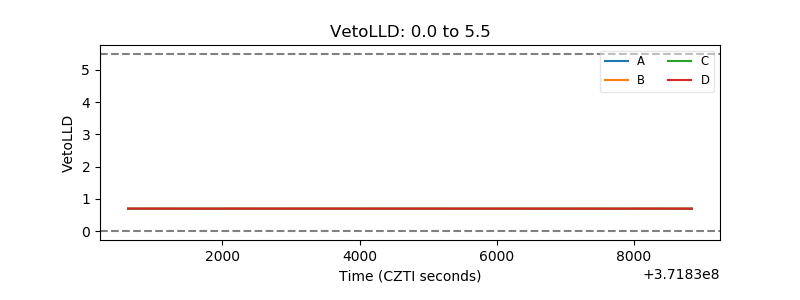 |
| Alpha Counter | 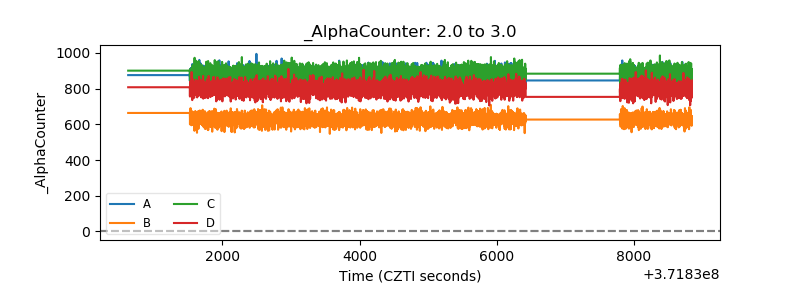 |
| _CPM_Rate | 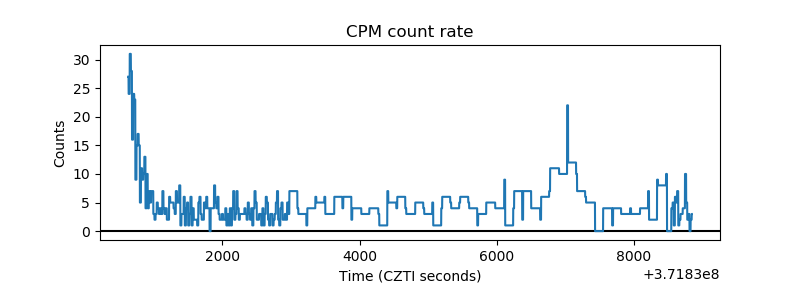 |
| CZT Counter | 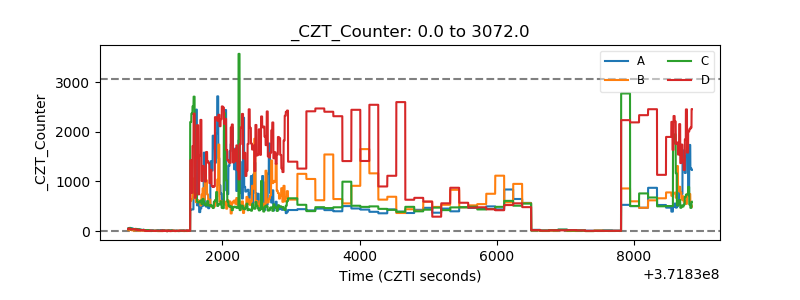 |
| +2.5 Volts monitor |  |
| +5 Volts monitor |  |
| _ROLL_ROT | 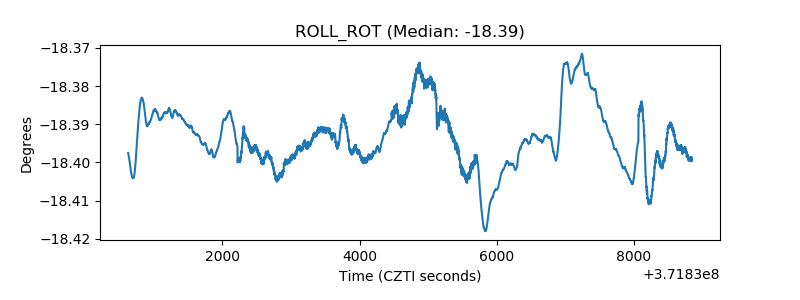 |
| _Roll_DEC | 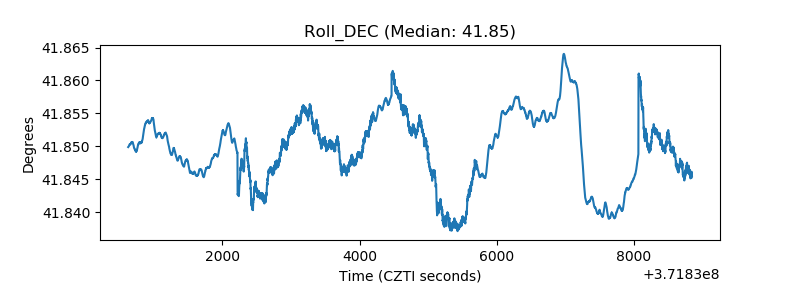 |
| _Roll_RA | 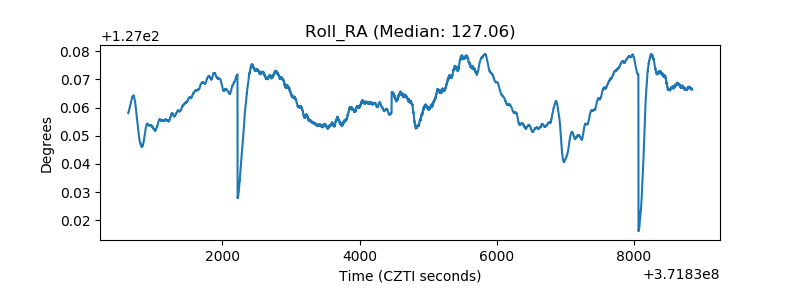 |
| Veto Counter | 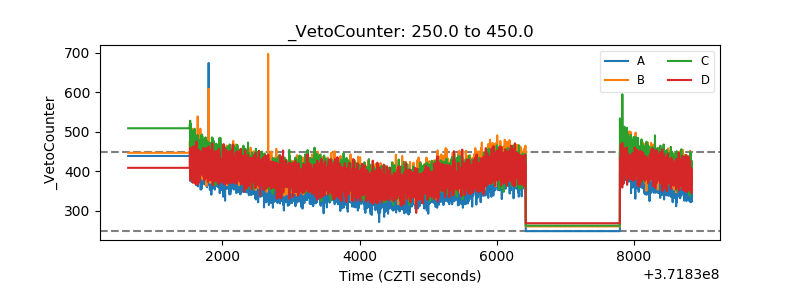 |