| Param | Original file | Final file |
|---|---|---|
| Filename | modeM0/AS1A10_057T03_9000004722_32676cztM0_level2.evt | modeM0/AS1A10_057T03_9000004722_32676cztM0_level2_quad_clean.evt |
| Size (bytes) | 744,160,320 | 64,356,480 |
| Size | 709.7 MB | 61.4 MB |
| Events in quadrant A | 4,106,301 | 400,552 |
| Events in quadrant B | 4,030,288 | 421,832 |
| Events in quadrant C | 3,964,263 | 416,077 |
| Events in quadrant D | 10,039,299 | 298,923 |
| Mode M0 | |||
|---|---|---|---|
| Quadrant | BADHDUFLAG | Total packets | Discarded packets |
| A | 0 | 15914 | 3 |
| B | 0 | 15894 | 2 |
| C | 0 | 15457 | 2 |
| D | 0 | 33840 | 2 |
| Mode M9 | |||
|---|---|---|---|
| Quadrant | BADHDUFLAG | Total packets | Discarded packets |
| A | 0 | 14 | 0 |
| B | 0 | 14 | 0 |
| C | 0 | 14 | 0 |
| D | 0 | 15 | 0 |
| Mode SS | |||
|---|---|---|---|
| Quadrant | BADHDUFLAG | Total packets | Discarded packets |
| A | 0 | 120 | 0 |
| B | 0 | 120 | 0 |
| C | 0 | 120 | 0 |
| D | 0 | 120 | 0 |
| Quadrant | Total seconds | Saturated seconds | Saturation percentage |
|---|---|---|---|
| A | 5869 | 394 | 6.713239% |
| B | 5869 | 103 | 1.754984% |
| C | 5869 | 222 | 3.782586% |
| D | 5869 | 3234 | 55.103084% |
Noise dominated data is calculated using 1-second bins in cleaned event files. If a bin has >2000 counts, and if more than 50% of those come from <1% of pixels, then it is considered to be noise-dominated and hence unusable.
| Quadrant | # 1 sec bins | Bins with >0 counts | Bins with >2000 counts | High rate bins dominated by noise | Noise dominated (total time) | Noise dominated (detector-on time) | Marked lightcurve |
|---|---|---|---|---|---|---|---|
| A | 7182 | 5870 | 184 | 184 | 2.56% | 3.13% | 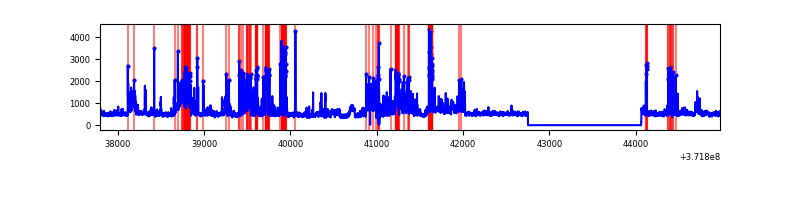 |
| B | 7182 | 5870 | 75 | 75 | 1.04% | 1.28% | 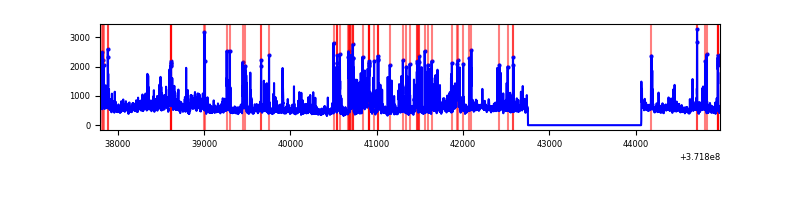 |
| C | 7182 | 5870 | 212 | 212 | 2.95% | 3.61% | 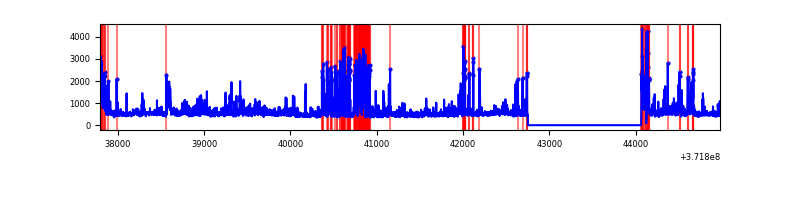 |
| D | 7182 | 5870 | 2526 | 2526 | 35.17% | 43.03% | 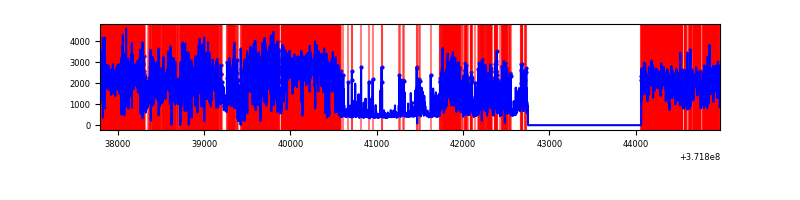 |
Top three noisy pixels from each quadrant. If the there are fewer than three noisy pixels in the level2.evt file, extra rows are filled as -1
| Pixel properties | Quadrant properties | ||||||
|---|---|---|---|---|---|---|---|
| Quadrant | DetID | PixID | Counts | Sigma | Mean | Median | Sigma |
| A | 15 | 249 | 1460967 | 10871.54 | 665 | 651 | 134.3 |
| A | 0 | 254 | 23318 | 168.74 | 665 | 651 | 134.3 |
| A | 13 | 6 | 20879 | 150.59 | 665 | 651 | 134.3 |
| B | 3 | 26 | 501753 | 3730.78 | 692 | 677 | 134.3 |
| B | 0 | 219 | 312559 | 2322.13 | 692 | 677 | 134.3 |
| B | 4 | 251 | 124609 | 922.74 | 692 | 677 | 134.3 |
| C | 0 | 10 | 769364 | 4938.01 | 659 | 665 | 155.7 |
| C | 9 | 236 | 239394 | 1533.56 | 659 | 665 | 155.7 |
| C | 8 | 50 | 126632 | 809.19 | 659 | 665 | 155.7 |
| D | 7 | 38 | 4690930 | 41622.91 | 468 | 457 | 112.7 |
| D | 12 | 2 | 954148 | 8462.98 | 468 | 457 | 112.7 |
| D | 12 | 218 | 791572 | 7020.3 | 468 | 457 | 112.7 |
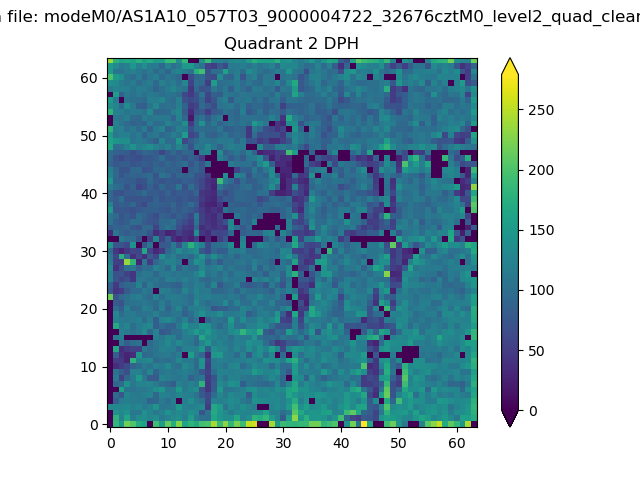
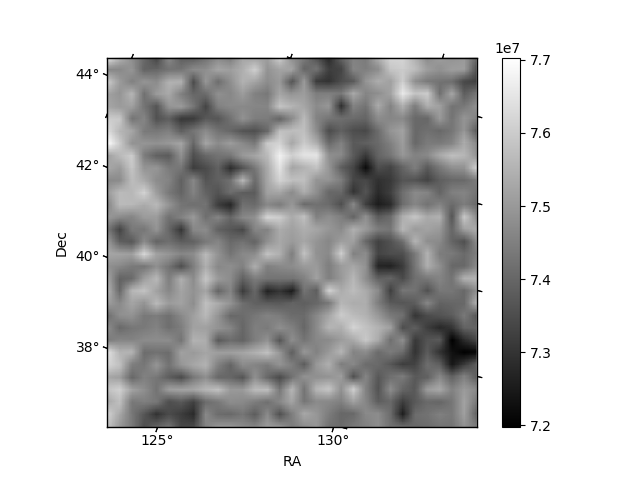
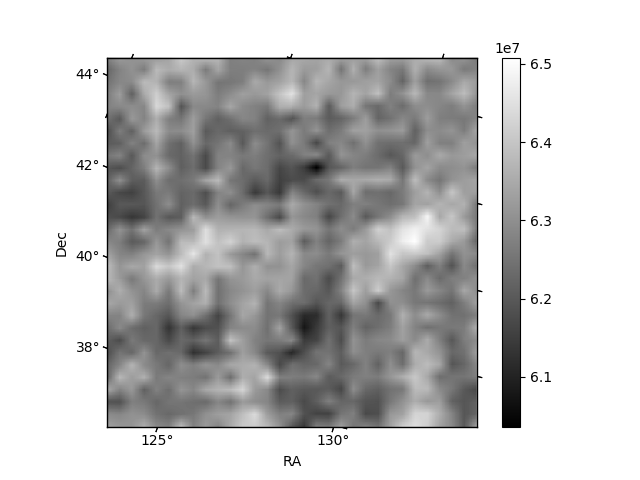
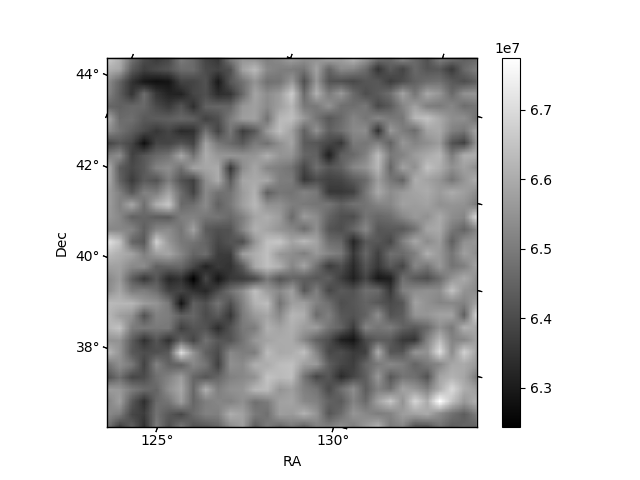
Histogram calculated using DETX and DETY for each event in the final _common_clean file
| Quadrant A | 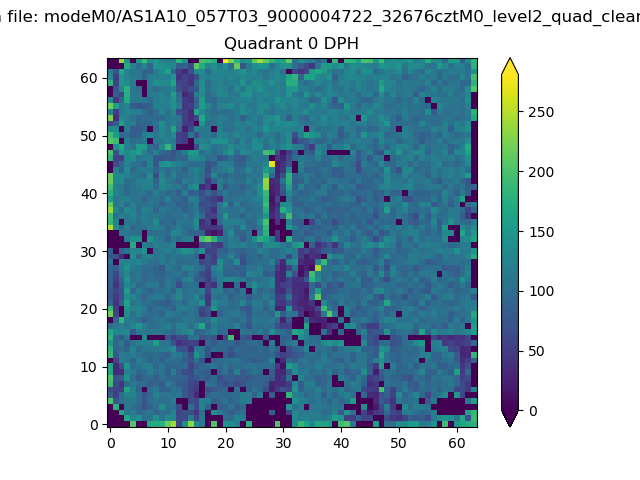 |
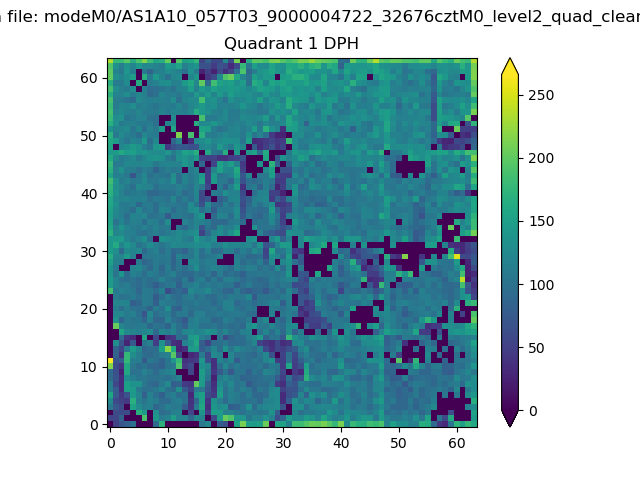 |
Quadrant B |
|---|---|---|---|
| Quadrant D | 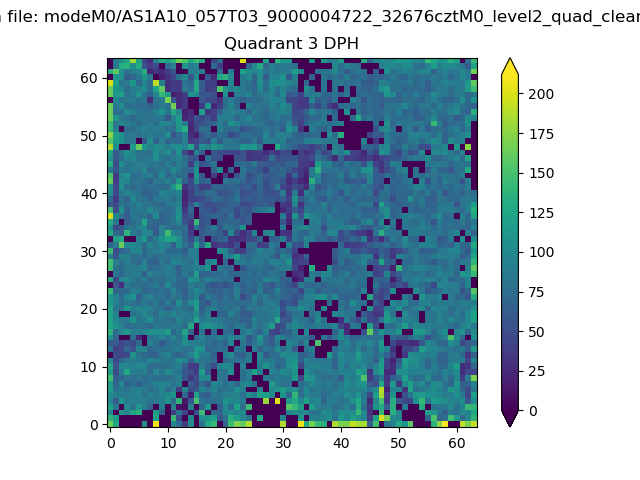 |
 |
Quadrant C |
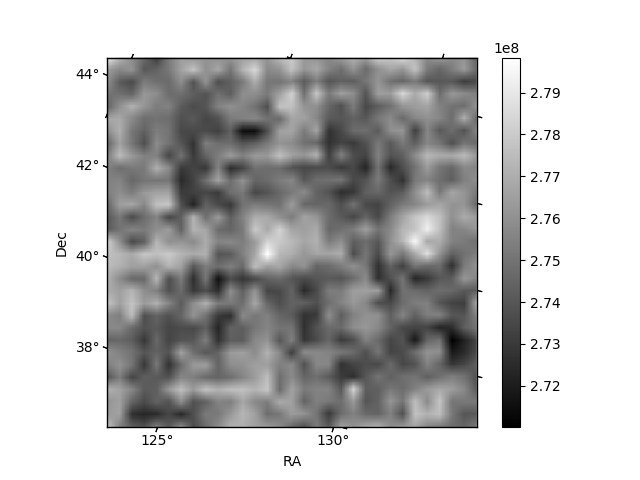
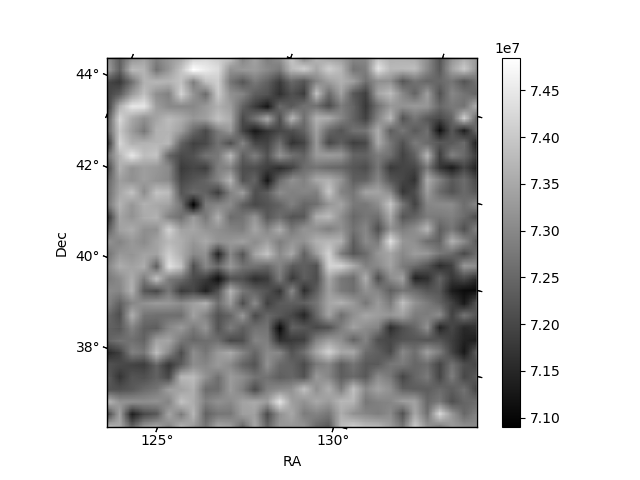
| Plot type | Count rate plots | Images |
|---|---|---|
| Comparison with Poisson distribution Blue bars denote a histogram of data divided into 1 sec bins. Red curve is a Poisson curve with rate = median count rate of data. |
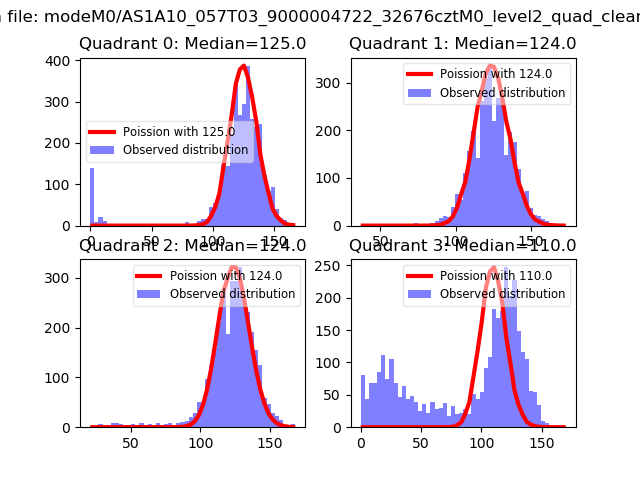 |
 |
| Quadrant-wise count rates Data is divided into 100 sec bins |
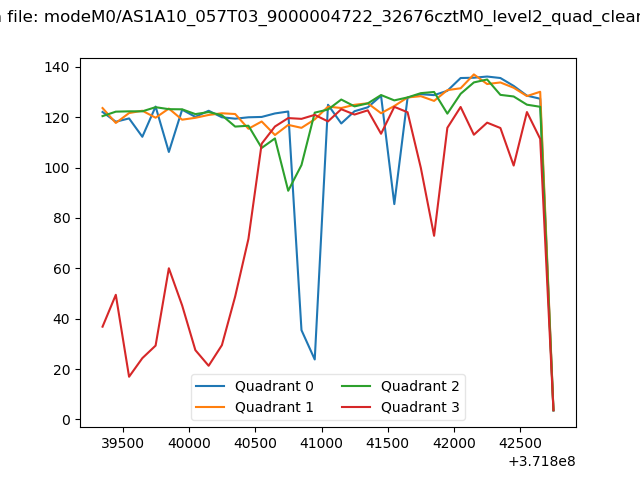 |
|
| Module-wise count rates for Quadrant A Data is divided into 100 sec bins |
 |
 |
| Module-wise count rates for Quadrant B Data is divided into 100 sec bins |
 |
 |
| Module-wise count rates for Quadrant C Data is divided into 100 sec bins |
 |
 |
| Module-wise count rates for Quadrant D Data is divided into 100 sec bins |
 |
 |
| Parameter | Plot |
|---|---|
| CZT HV Monitor | 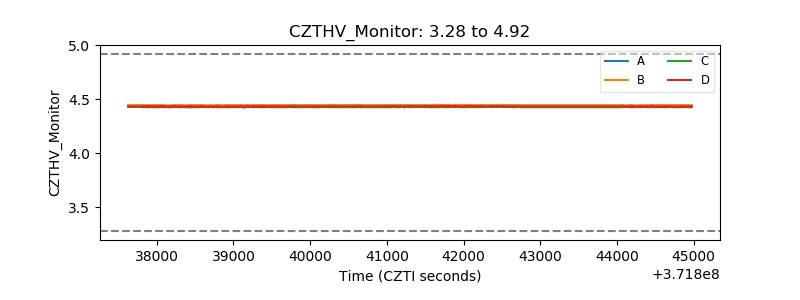 |
| D_VDD | 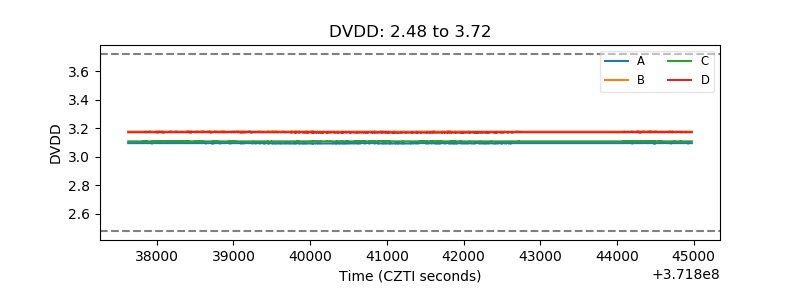 |
| Temperature 1 | 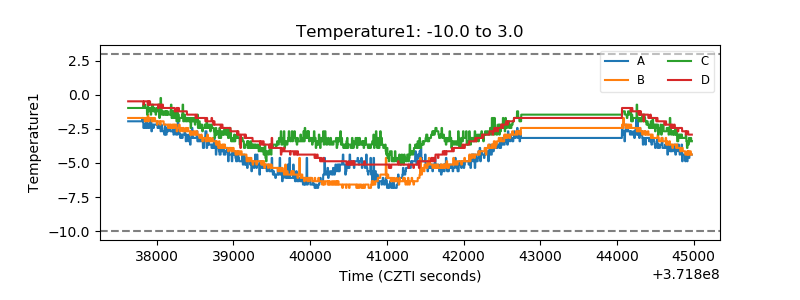 |
| Veto HV Monitor | 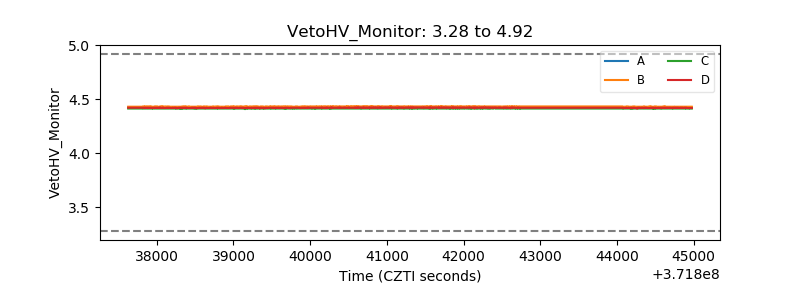 |
| Veto LLD | 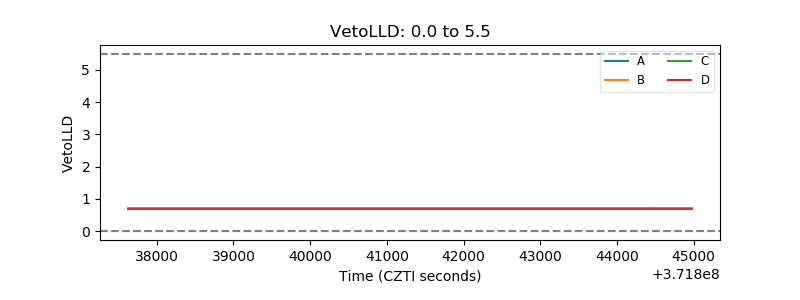 |
| Alpha Counter | 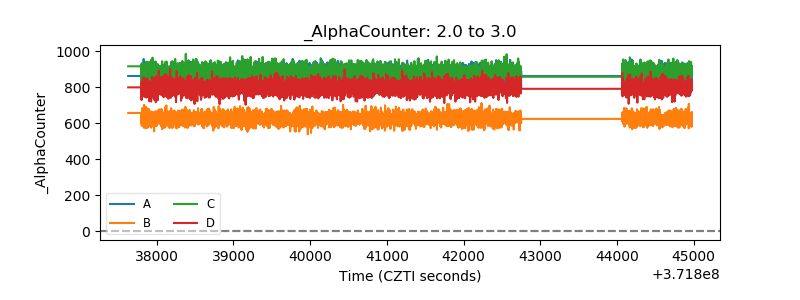 |
| _CPM_Rate | 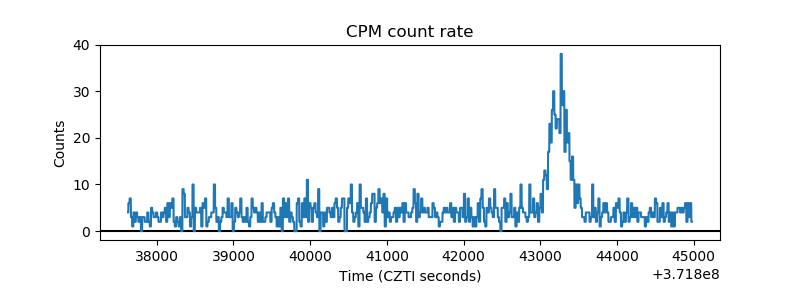 |
| CZT Counter | 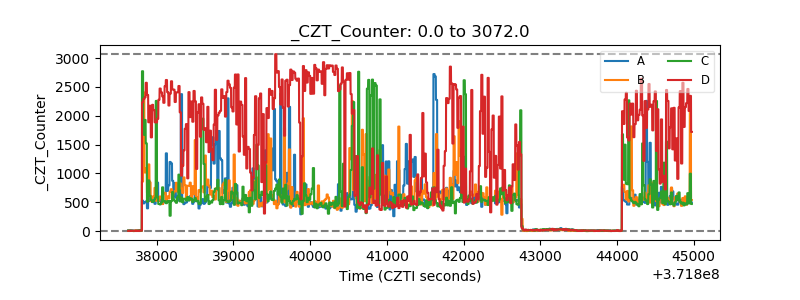 |
| +2.5 Volts monitor | 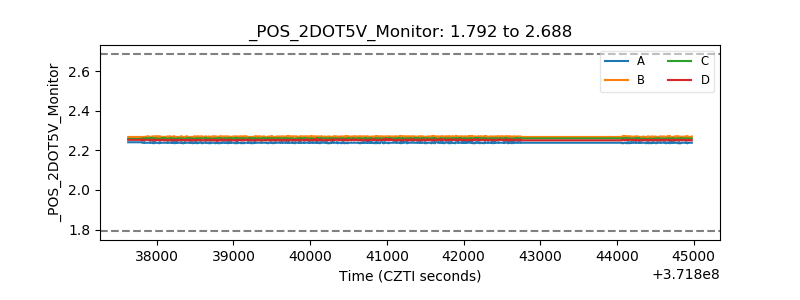 |
| +5 Volts monitor |  |
| _ROLL_ROT |  |
| _Roll_DEC | 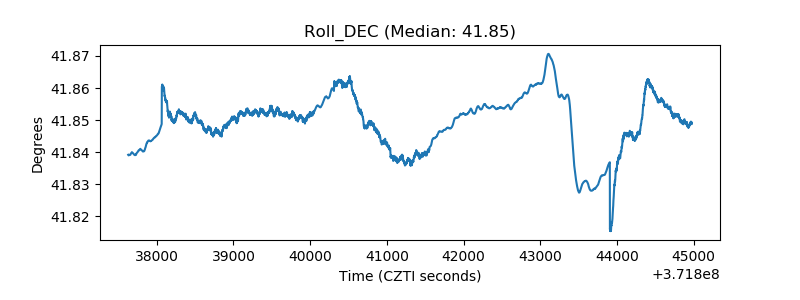 |
| _Roll_RA | 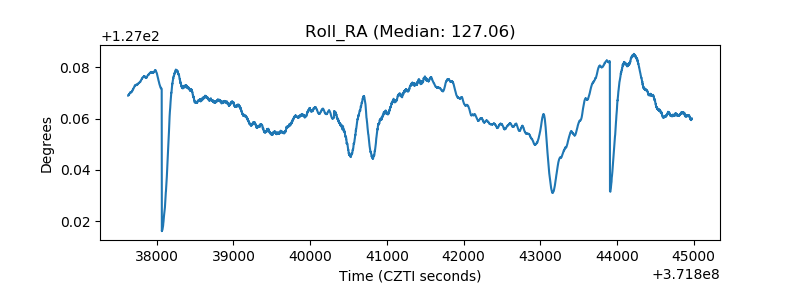 |
| Veto Counter |  |