| Param | Original file | Final file |
|---|---|---|
| Filename | modeM0/AS1A10_057T03_9000004722_32680cztM0_level2.evt | modeM0/AS1A10_057T03_9000004722_32680cztM0_level2_quad_clean.evt |
| Size (bytes) | 909,541,440 | 124,931,520 |
| Size | 867.4 MB | 119.1 MB |
| Events in quadrant A | 6,249,395 | 783,469 |
| Events in quadrant B | 5,244,345 | 840,738 |
| Events in quadrant C | 5,036,723 | 830,324 |
| Events in quadrant D | 10,451,734 | 748,355 |
| Mode M0 | |||
|---|---|---|---|
| Quadrant | BADHDUFLAG | Total packets | Discarded packets |
| A | 0 | 24271 | 3 |
| B | 0 | 21315 | 2 |
| C | 0 | 20389 | 2 |
| D | 0 | 36887 | 2 |
| Mode M9 | |||
|---|---|---|---|
| Quadrant | BADHDUFLAG | Total packets | Discarded packets |
| A | 0 | 33 | 0 |
| B | 0 | 33 | 0 |
| C | 0 | 33 | 0 |
| D | 0 | 33 | 0 |
| Mode SS | |||
|---|---|---|---|
| Quadrant | BADHDUFLAG | Total packets | Discarded packets |
| A | 0 | 170 | 0 |
| B | 0 | 170 | 0 |
| C | 0 | 170 | 0 |
| D | 0 | 170 | 0 |
| Quadrant | Total seconds | Saturated seconds | Saturation percentage |
|---|---|---|---|
| A | 8354 | 907 | 10.857074% |
| B | 8354 | 133 | 1.592052% |
| C | 8354 | 158 | 1.891310% |
| D | 8354 | 2209 | 26.442423% |
Noise dominated data is calculated using 1-second bins in cleaned event files. If a bin has >2000 counts, and if more than 50% of those come from <1% of pixels, then it is considered to be noise-dominated and hence unusable.
| Quadrant | # 1 sec bins | Bins with >0 counts | Bins with >2000 counts | High rate bins dominated by noise | Noise dominated (total time) | Noise dominated (detector-on time) | Marked lightcurve |
|---|---|---|---|---|---|---|---|
| A | 11577 | 8356 | 741 | 741 | 6.40% | 8.87% |  |
| B | 11577 | 8356 | 93 | 93 | 0.80% | 1.11% |  |
| C | 11577 | 8356 | 119 | 119 | 1.03% | 1.42% | 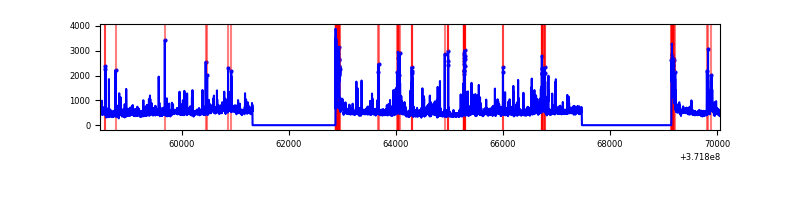 |
| D | 11577 | 8356 | 1978 | 1978 | 17.09% | 23.67% |  |
Top three noisy pixels from each quadrant. If the there are fewer than three noisy pixels in the level2.evt file, extra rows are filled as -1
| Pixel properties | Quadrant properties | ||||||
|---|---|---|---|---|---|---|---|
| Quadrant | DetID | PixID | Counts | Sigma | Mean | Median | Sigma |
| A | 15 | 249 | 2582437 | 14256.32 | 913 | 897 | 181.1 |
| A | 14 | 63 | 47226 | 255.85 | 913 | 897 | 181.1 |
| A | 12 | 189 | 26893 | 143.56 | 913 | 897 | 181.1 |
| B | 3 | 26 | 390463 | 2118.58 | 972 | 951 | 183.9 |
| B | 0 | 219 | 339083 | 1839.12 | 972 | 951 | 183.9 |
| B | 4 | 251 | 141181 | 762.72 | 972 | 951 | 183.9 |
| C | 0 | 10 | 646079 | 3012.97 | 928 | 936 | 214.1 |
| C | 9 | 236 | 151982 | 705.42 | 928 | 936 | 214.1 |
| C | 8 | 35 | 144330 | 669.68 | 928 | 936 | 214.1 |
| D | 7 | 38 | 3293002 | 16765.24 | 824 | 807 | 196.4 |
| D | 2 | 249 | 831146 | 4228.44 | 824 | 807 | 196.4 |
| D | 8 | 195 | 730518 | 3716.0 | 824 | 807 | 196.4 |
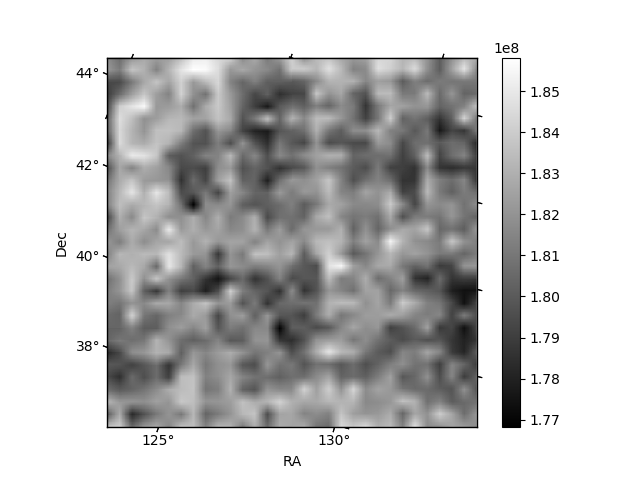
Histogram calculated using DETX and DETY for each event in the final _common_clean file
| Quadrant A | 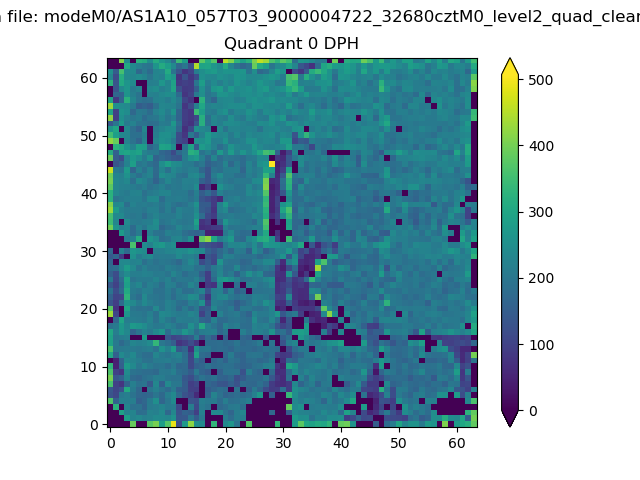 |
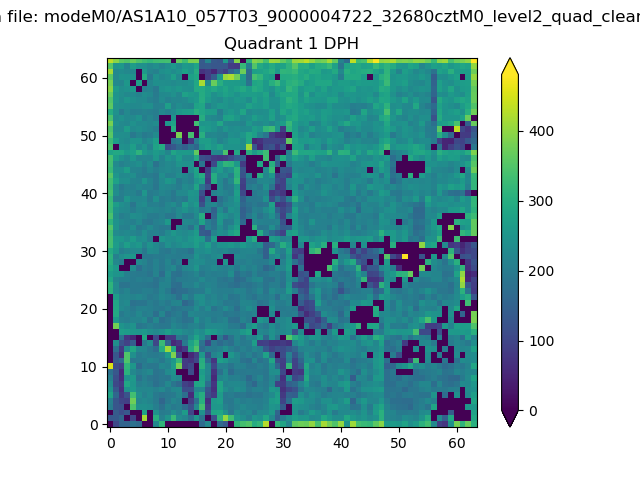 |
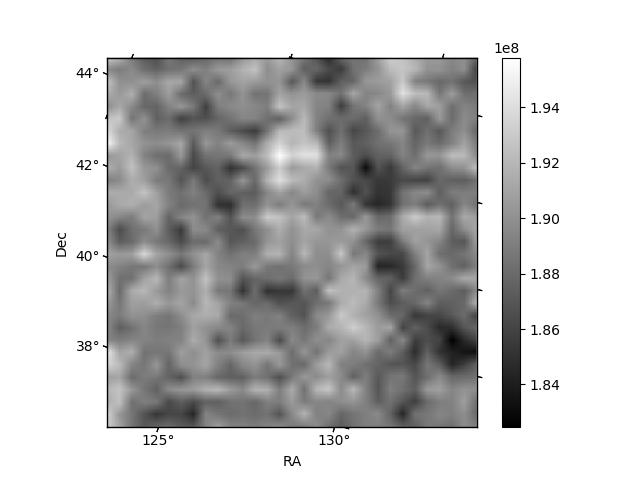
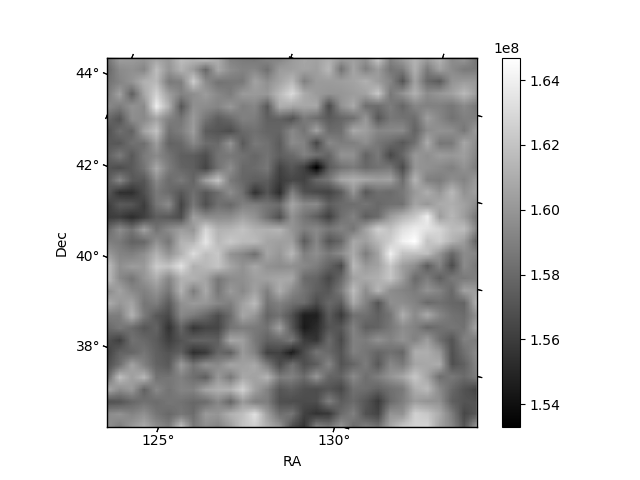
Quadrant B |
|---|---|---|---|
| Quadrant D | 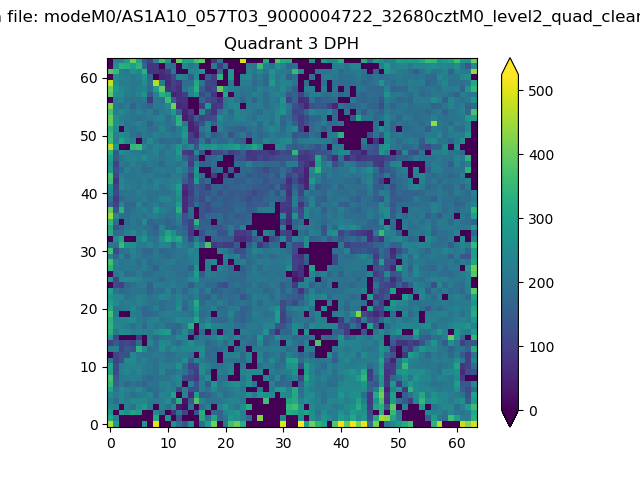 |
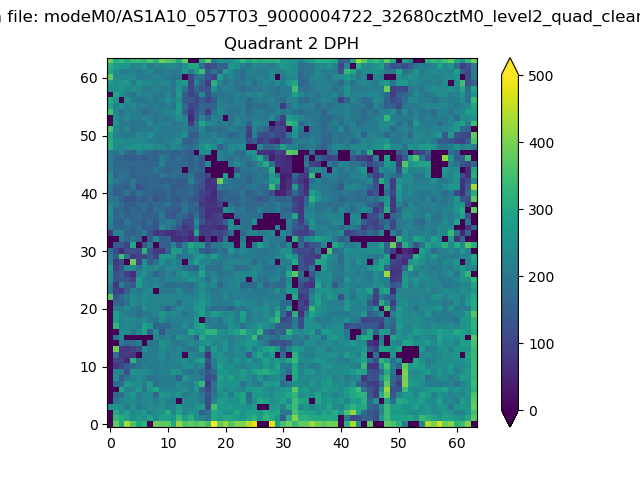 |
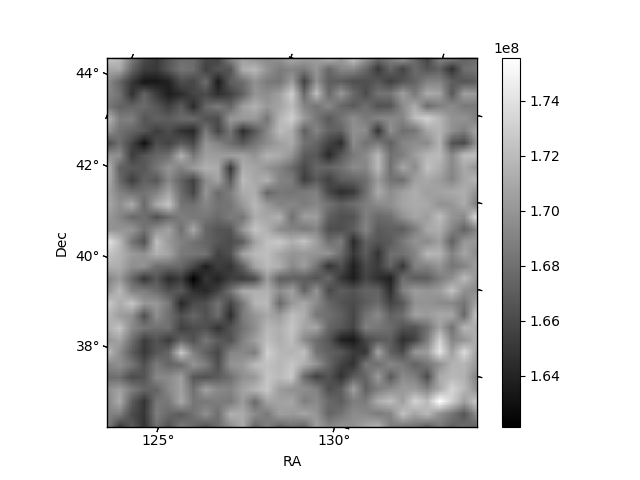
Quadrant C |
| Plot type | Count rate plots | Images |
|---|---|---|
| Comparison with Poisson distribution Blue bars denote a histogram of data divided into 1 sec bins. Red curve is a Poisson curve with rate = median count rate of data. |
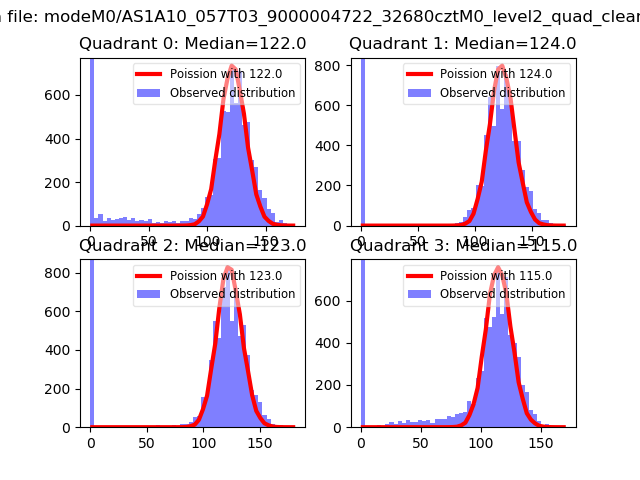 |
 |
| Quadrant-wise count rates Data is divided into 100 sec bins |
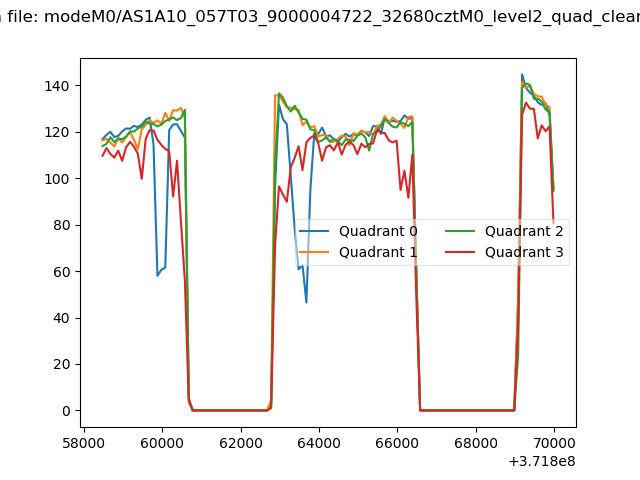 |
|
| Module-wise count rates for Quadrant A Data is divided into 100 sec bins |
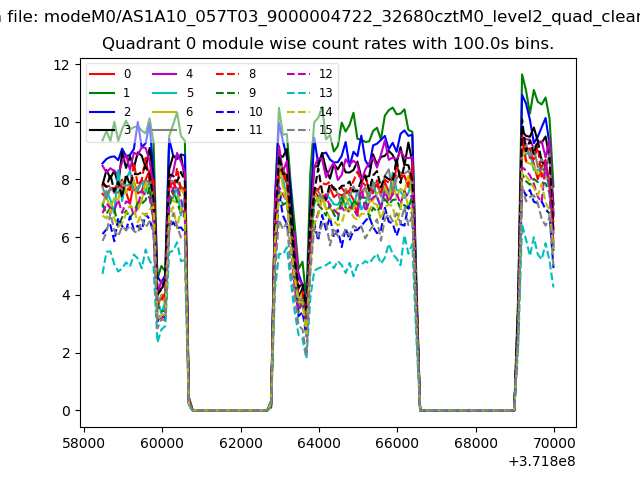 |
 |
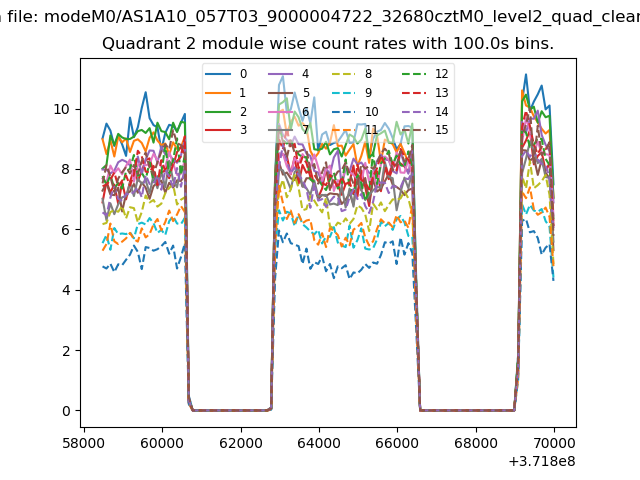
| Module-wise count rates for Quadrant B Data is divided into 100 sec bins |
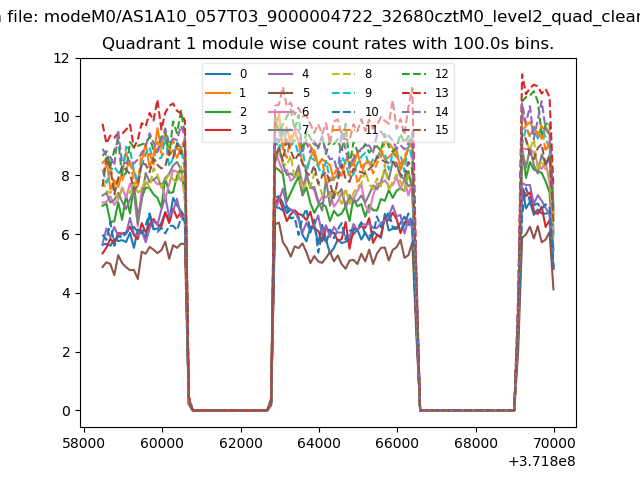 |
 |
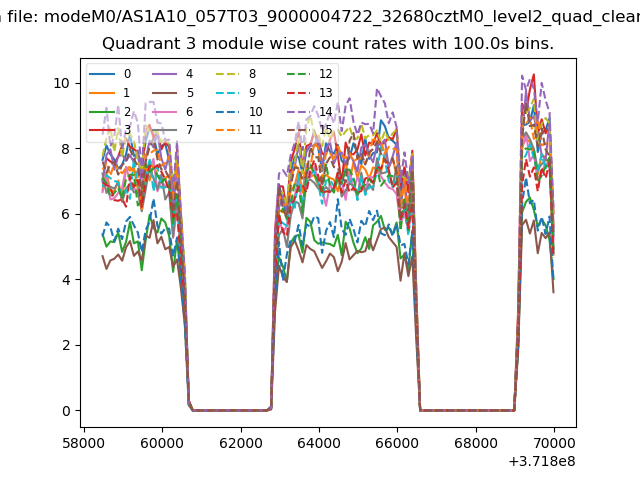
| Module-wise count rates for Quadrant C Data is divided into 100 sec bins |
 |
 |
| Module-wise count rates for Quadrant D Data is divided into 100 sec bins |
 |
 |
| Parameter | Plot |
|---|---|
| CZT HV Monitor | 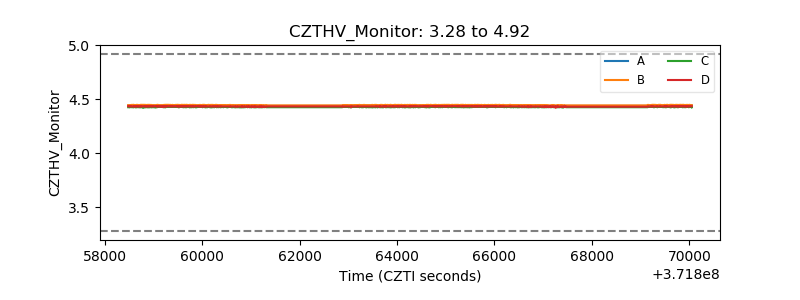 |
| D_VDD | 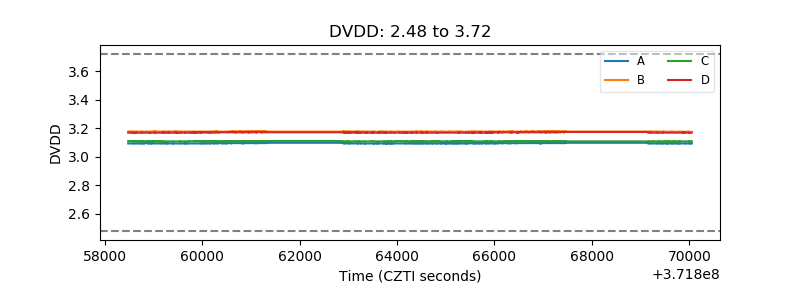 |
| Temperature 1 | 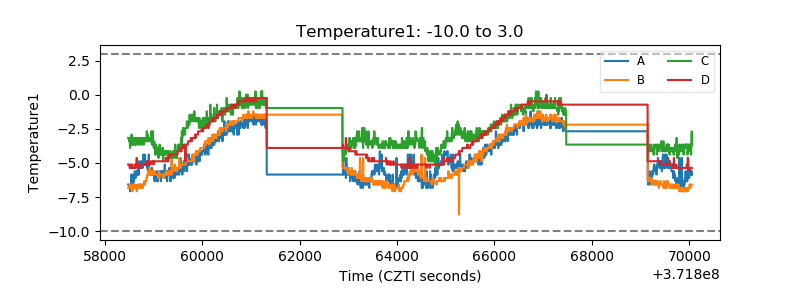 |
| Veto HV Monitor |  |
| Veto LLD | 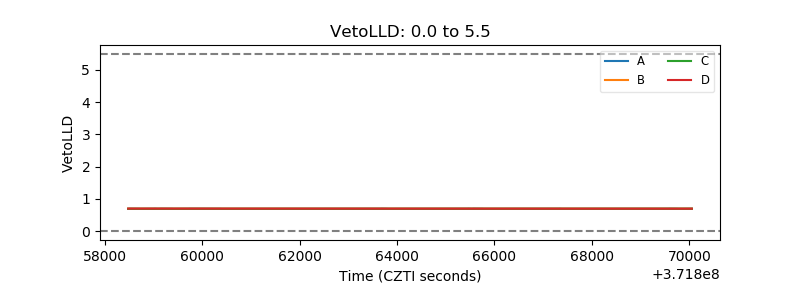 |
| Alpha Counter | 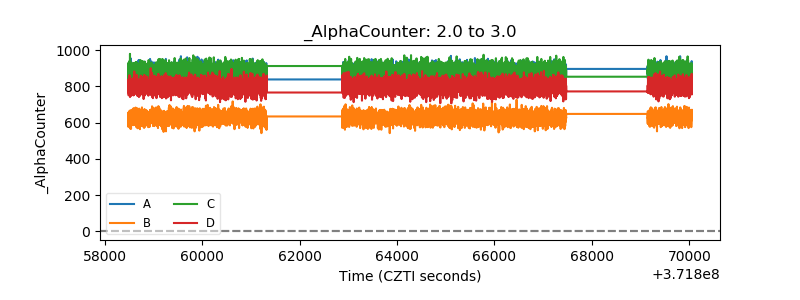 |
| _CPM_Rate | 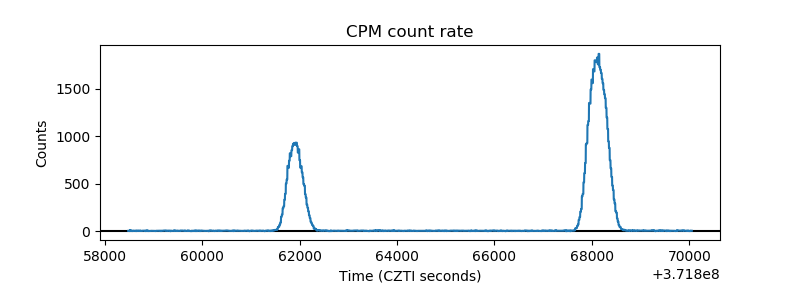 |
| CZT Counter | 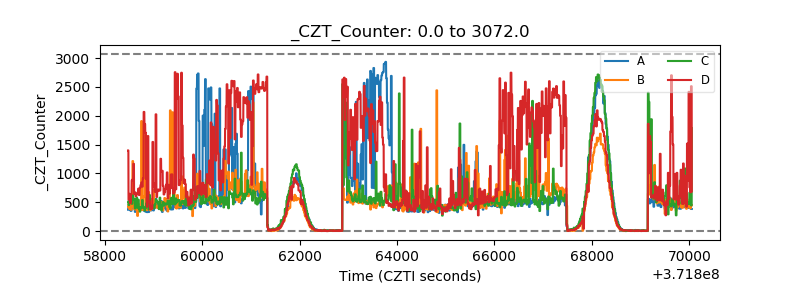 |
| +2.5 Volts monitor | 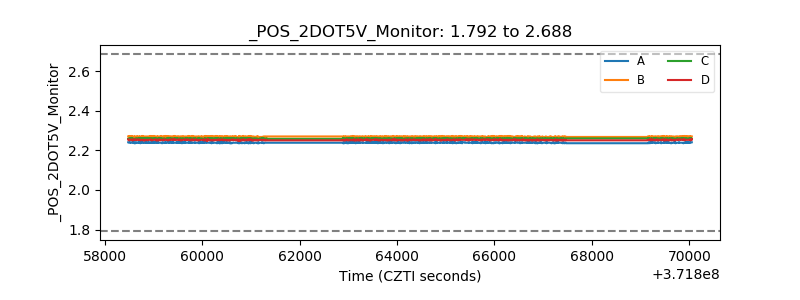 |
| +5 Volts monitor |  |
| _ROLL_ROT |  |
| _Roll_DEC |  |
| _Roll_RA | 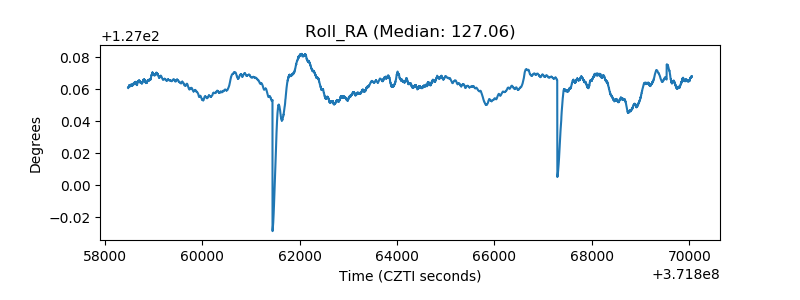 |
| Veto Counter | 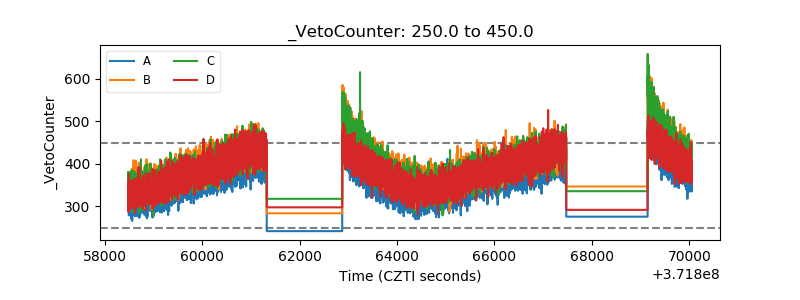 |