| Param | Original file | Final file |
|---|---|---|
| Filename | modeM0/AS1A10_057T03_9000004722_32682cztM0_level2.evt | modeM0/AS1A10_057T03_9000004722_32682cztM0_level2_quad_clean.evt |
| Size (bytes) | 543,568,320 | 80,519,040 |
| Size | 518.4 MB | 76.8 MB |
| Events in quadrant A | 2,540,505 | 537,733 |
| Events in quadrant B | 3,062,555 | 541,006 |
| Events in quadrant C | 3,042,232 | 530,572 |
| Events in quadrant D | 7,454,478 | 454,312 |
| Mode M0 | |||
|---|---|---|---|
| Quadrant | BADHDUFLAG | Total packets | Discarded packets |
| A | 0 | 11014 | 3 |
| B | 0 | 12544 | 2 |
| C | 0 | 12371 | 2 |
| D | 0 | 25806 | 2 |
| Mode M9 | |||
|---|---|---|---|
| Quadrant | BADHDUFLAG | Total packets | Discarded packets |
| A | 0 | 22 | 0 |
| B | 0 | 22 | 0 |
| C | 0 | 22 | 0 |
| D | 0 | 23 | 0 |
| Mode SS | |||
|---|---|---|---|
| Quadrant | BADHDUFLAG | Total packets | Discarded packets |
| A | 0 | 108 | 0 |
| B | 0 | 108 | 0 |
| C | 0 | 108 | 0 |
| D | 0 | 108 | 0 |
| Quadrant | Total seconds | Saturated seconds | Saturation percentage |
|---|---|---|---|
| A | 5350 | 9 | 0.168224% |
| B | 5350 | 65 | 1.214953% |
| C | 5350 | 79 | 1.476636% |
| D | 5350 | 1603 | 29.962617% |
Noise dominated data is calculated using 1-second bins in cleaned event files. If a bin has >2000 counts, and if more than 50% of those come from <1% of pixels, then it is considered to be noise-dominated and hence unusable.
| Quadrant | # 1 sec bins | Bins with >0 counts | Bins with >2000 counts | High rate bins dominated by noise | Noise dominated (total time) | Noise dominated (detector-on time) | Marked lightcurve |
|---|---|---|---|---|---|---|---|
| A | 7143 | 5351 | 2 | 2 | 0.03% | 0.04% | 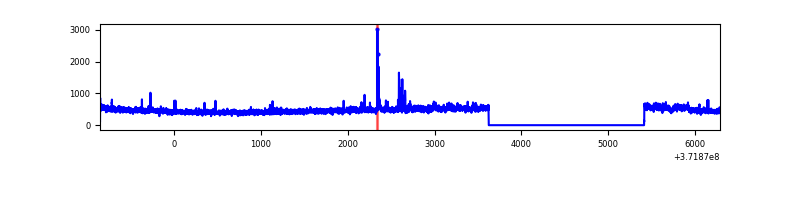 |
| B | 7143 | 5351 | 38 | 38 | 0.53% | 0.71% |  |
| C | 7143 | 5351 | 71 | 71 | 0.99% | 1.33% | 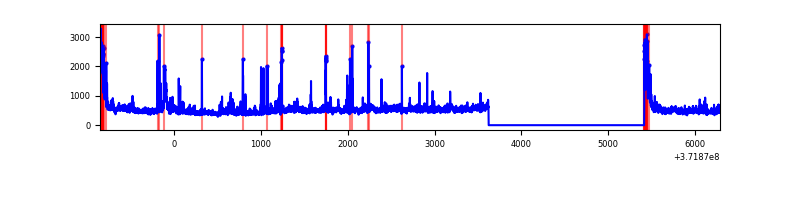 |
| D | 7143 | 5351 | 1404 | 1404 | 19.66% | 26.24% | 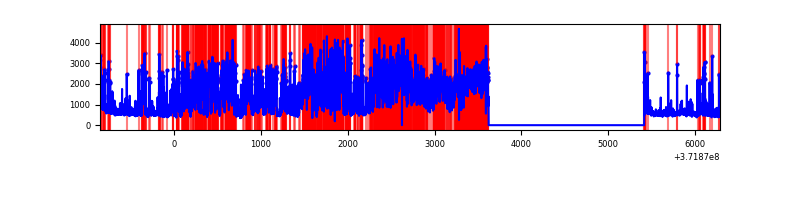 |
Top three noisy pixels from each quadrant. If the there are fewer than three noisy pixels in the level2.evt file, extra rows are filled as -1
| Pixel properties | Quadrant properties | ||||||
|---|---|---|---|---|---|---|---|
| Quadrant | DetID | PixID | Counts | Sigma | Mean | Median | Sigma |
| A | 15 | 249 | 33089 | 258.63 | 627 | 616 | 125.6 |
| A | 0 | 191 | 20511 | 158.45 | 627 | 616 | 125.6 |
| A | 14 | 63 | 16645 | 127.66 | 627 | 616 | 125.6 |
| B | 3 | 26 | 140703 | 1168.03 | 632 | 620 | 119.9 |
| B | 0 | 199 | 97706 | 809.52 | 632 | 620 | 119.9 |
| B | 0 | 219 | 87027 | 720.47 | 632 | 620 | 119.9 |
| C | 0 | 10 | 298764 | 2143.94 | 603 | 608 | 139.1 |
| C | 3 | 233 | 153873 | 1102.08 | 603 | 608 | 139.1 |
| C | 9 | 236 | 69277 | 493.78 | 603 | 608 | 139.1 |
| D | 7 | 80 | 2080798 | 16799.02 | 519 | 508 | 123.8 |
| D | 7 | 38 | 1311143 | 10583.81 | 519 | 508 | 123.8 |
| D | 2 | 249 | 666881 | 5381.18 | 519 | 508 | 123.8 |
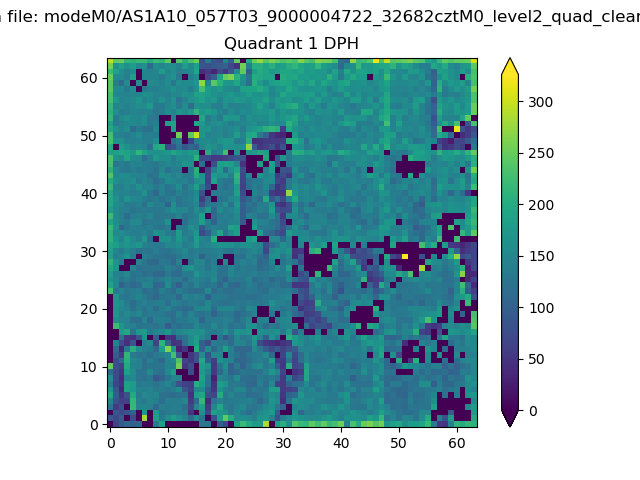
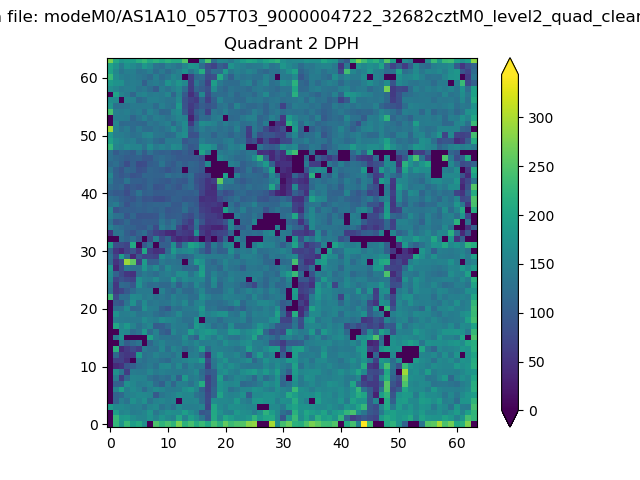
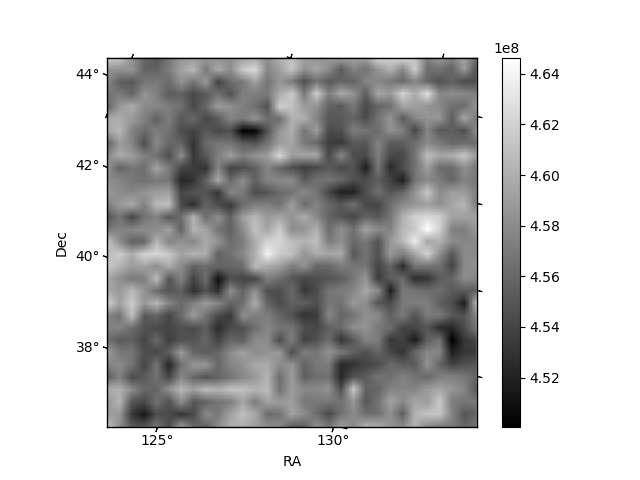
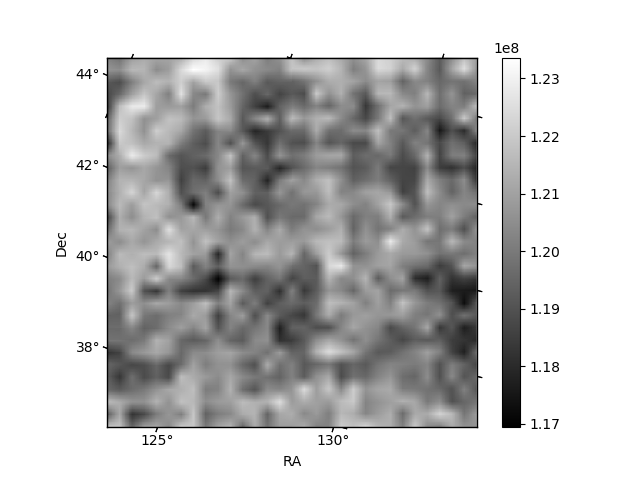
Histogram calculated using DETX and DETY for each event in the final _common_clean file
| Quadrant A | 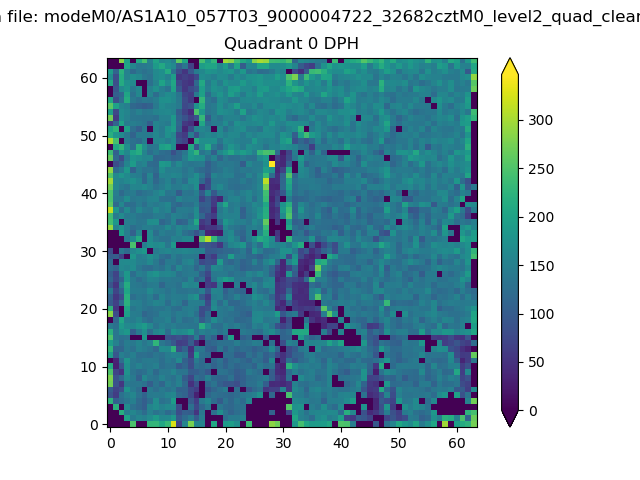 |
 |
Quadrant B |
|---|---|---|---|
| Quadrant D | 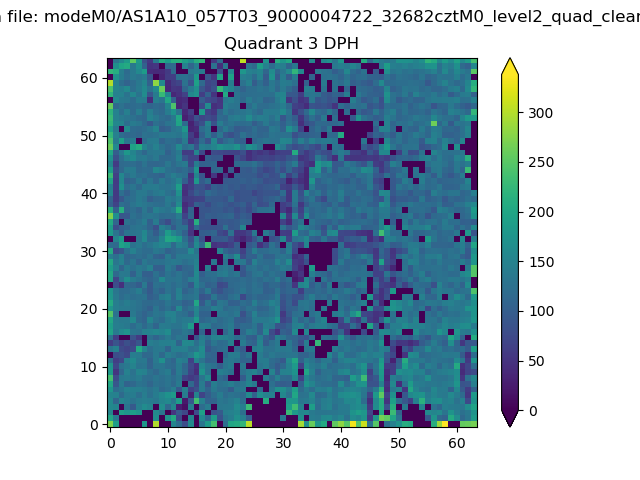 |
 |
Quadrant C |
| Plot type | Count rate plots | Images |
|---|---|---|
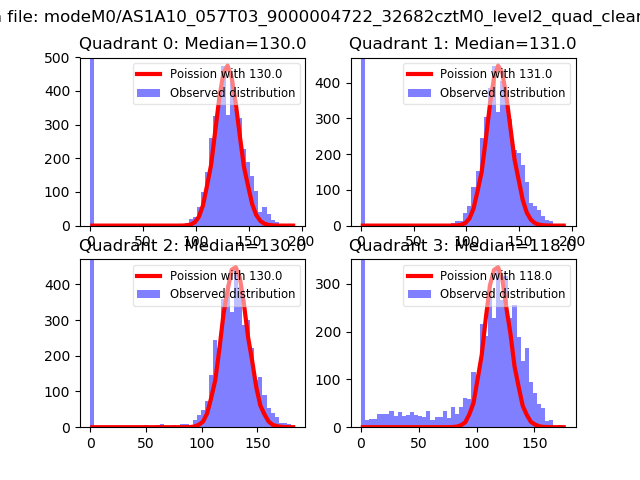
| Comparison with Poisson distribution Blue bars denote a histogram of data divided into 1 sec bins. Red curve is a Poisson curve with rate = median count rate of data. |
 |
 |
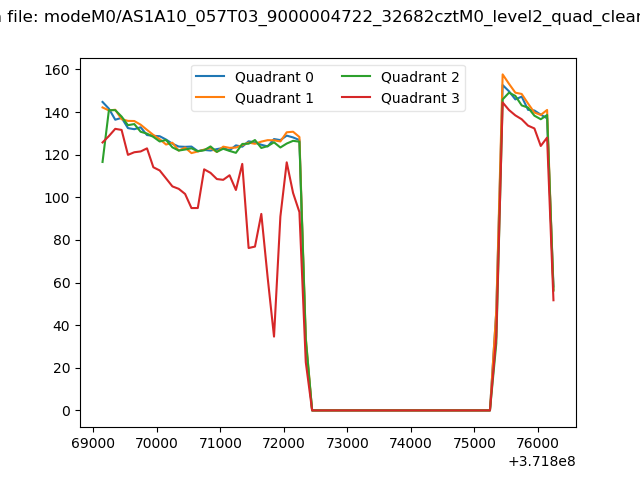
| Quadrant-wise count rates Data is divided into 100 sec bins |
 |
|
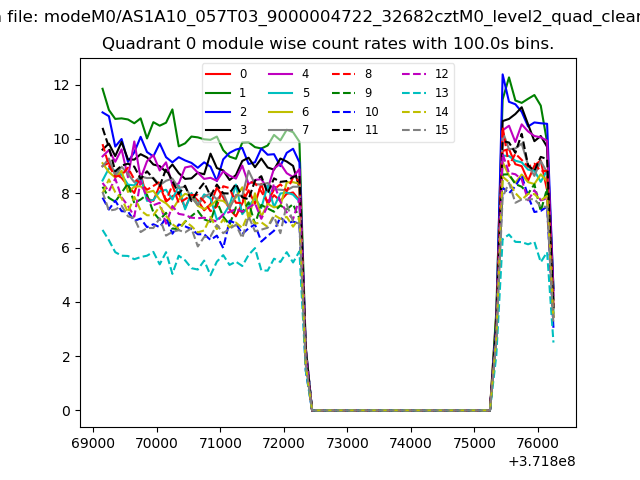
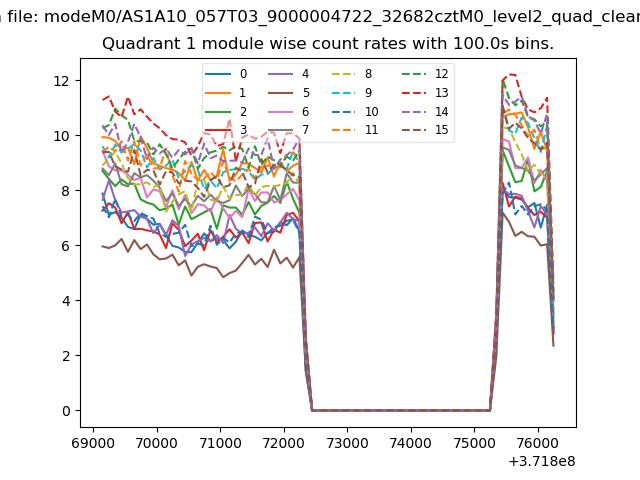
| Module-wise count rates for Quadrant A Data is divided into 100 sec bins |
 |
 |
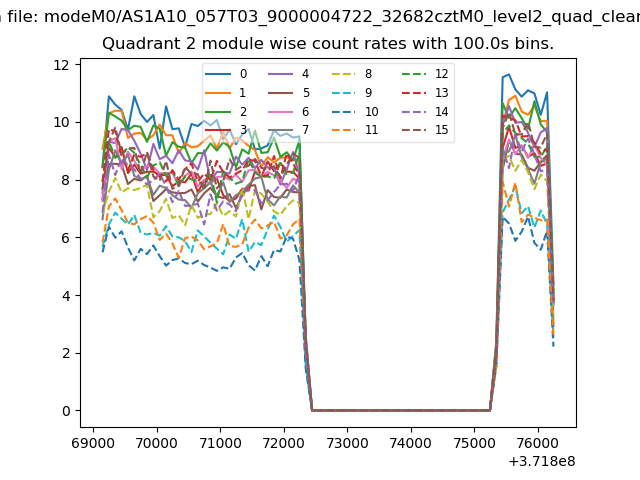
| Module-wise count rates for Quadrant B Data is divided into 100 sec bins |
 |
 |
| Module-wise count rates for Quadrant C Data is divided into 100 sec bins |
 |
 |
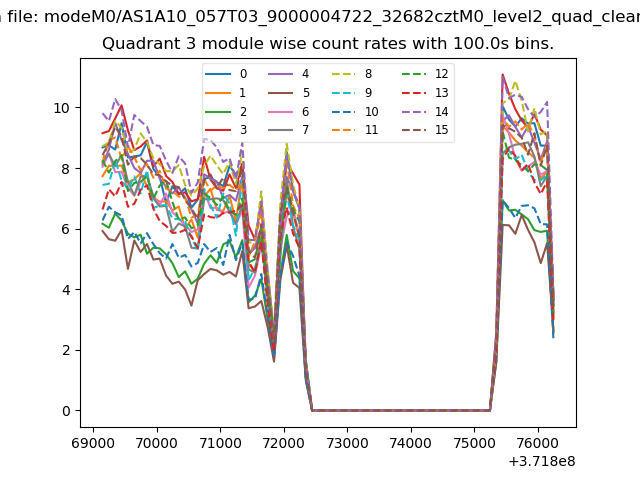
| Module-wise count rates for Quadrant D Data is divided into 100 sec bins |
 |
 |
| Parameter | Plot |
|---|---|
| CZT HV Monitor | 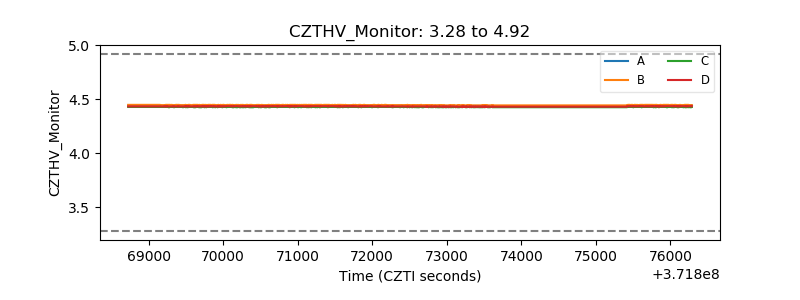 |
| D_VDD | 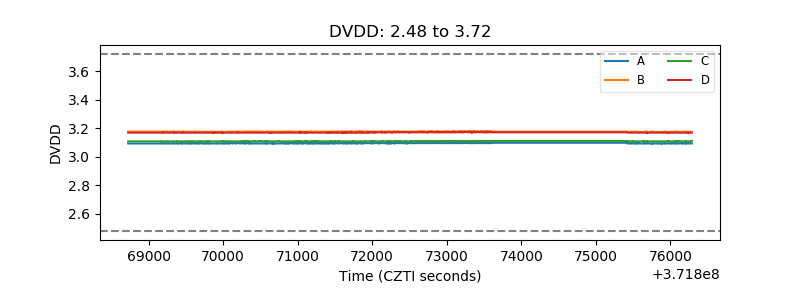 |
| Temperature 1 | 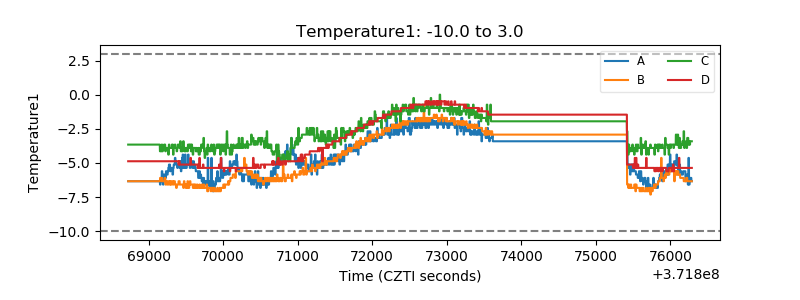 |
| Veto HV Monitor | 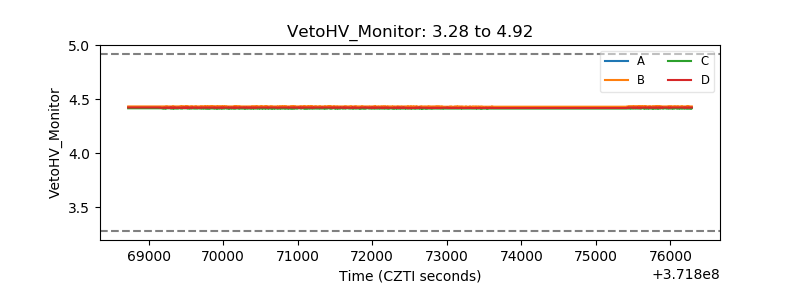 |
| Veto LLD | 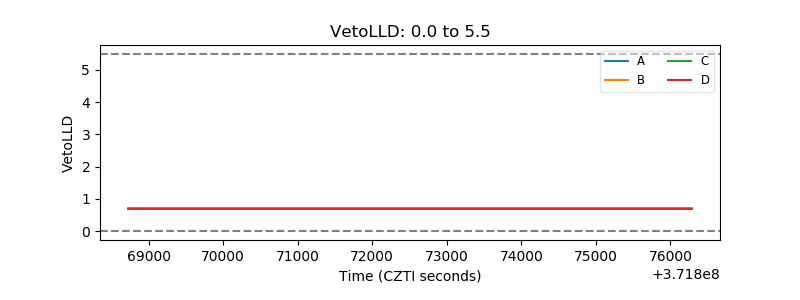 |
| Alpha Counter | 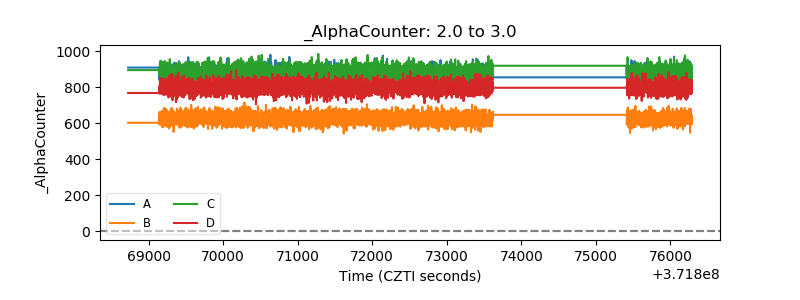 |
| _CPM_Rate | 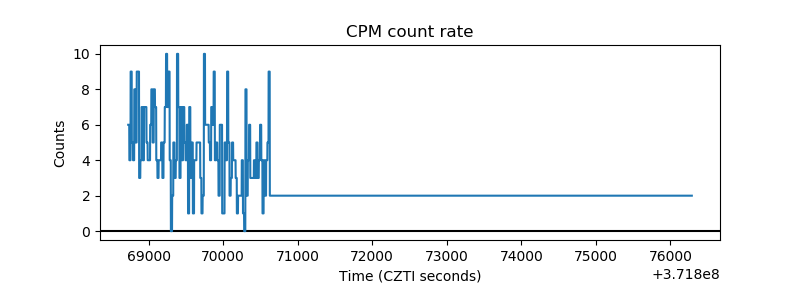 |
| CZT Counter | 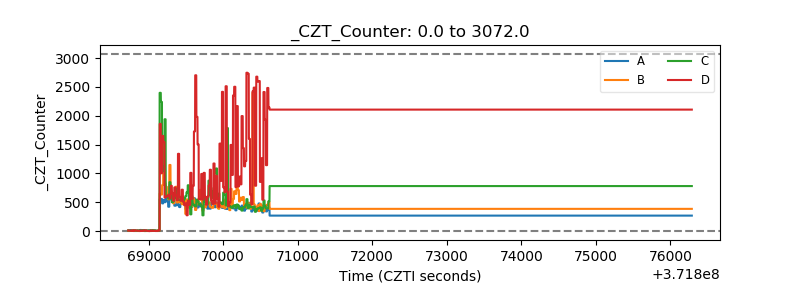 |
| +2.5 Volts monitor | 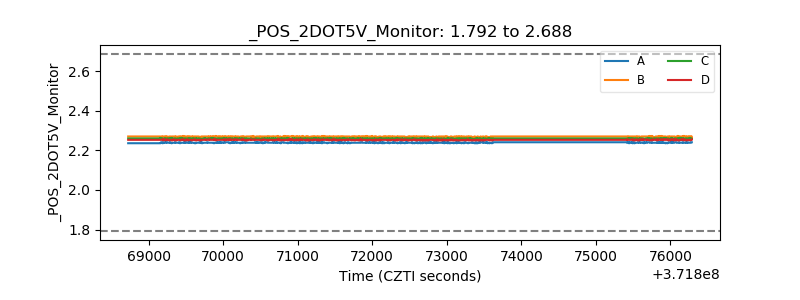 |
| +5 Volts monitor |  |
| _ROLL_ROT | 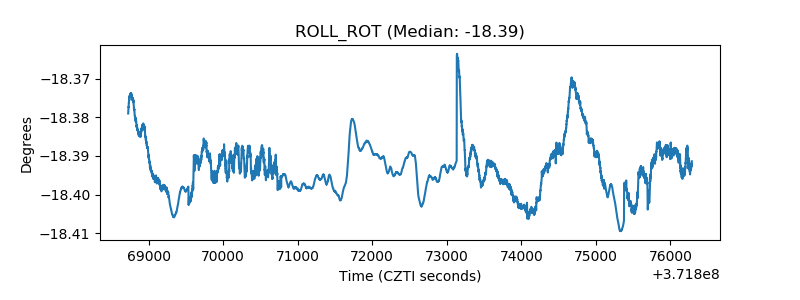 |
| _Roll_DEC | 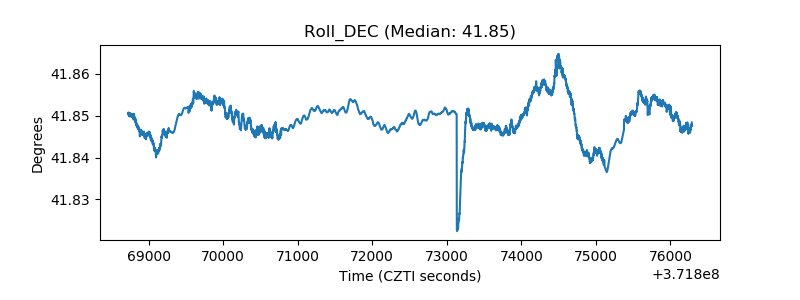 |
| _Roll_RA | 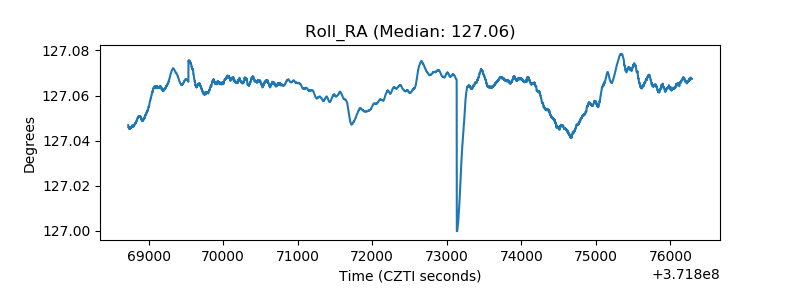 |
| Veto Counter | 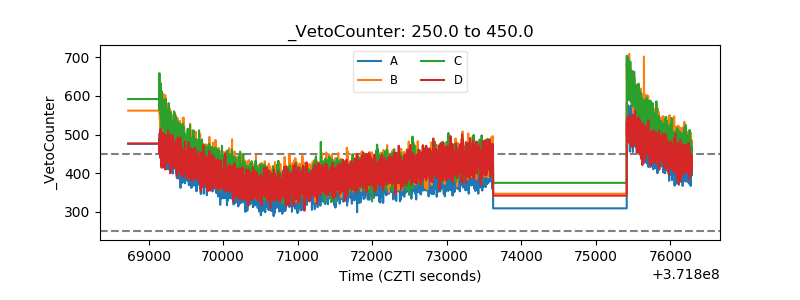 |