| Param | Original file | Final file |
|---|---|---|
| Filename | modeM0/AS1A10_057T03_9000004722_32683cztM0_level2.evt | modeM0/AS1A10_057T03_9000004722_32683cztM0_level2_quad_clean.evt |
| Size (bytes) | 513,288,000 | 80,861,760 |
| Size | 489.5 MB | 77.1 MB |
| Events in quadrant A | 3,182,843 | 525,045 |
| Events in quadrant B | 3,198,773 | 538,068 |
| Events in quadrant C | 2,871,555 | 523,227 |
| Events in quadrant D | 5,928,422 | 487,044 |
| Mode M0 | |||
|---|---|---|---|
| Quadrant | BADHDUFLAG | Total packets | Discarded packets |
| A | 0 | 12893 | 3 |
| B | 0 | 12959 | 2 |
| C | 0 | 11883 | 2 |
| D | 0 | 21218 | 2 |
| Mode M9 | |||
|---|---|---|---|
| Quadrant | BADHDUFLAG | Total packets | Discarded packets |
| A | 0 | 28 | 0 |
| B | 0 | 28 | 0 |
| C | 0 | 28 | 0 |
| D | 0 | 29 | 0 |
| Mode SS | |||
|---|---|---|---|
| Quadrant | BADHDUFLAG | Total packets | Discarded packets |
| A | 0 | 110 | 0 |
| B | 0 | 110 | 0 |
| C | 0 | 110 | 0 |
| D | 0 | 110 | 0 |
| Quadrant | Total seconds | Saturated seconds | Saturation percentage |
|---|---|---|---|
| A | 5355 | 77 | 1.437908% |
| B | 5355 | 72 | 1.344538% |
| C | 5355 | 67 | 1.251167% |
| D | 5355 | 1109 | 20.709617% |
Noise dominated data is calculated using 1-second bins in cleaned event files. If a bin has >2000 counts, and if more than 50% of those come from <1% of pixels, then it is considered to be noise-dominated and hence unusable.
| Quadrant | # 1 sec bins | Bins with >0 counts | Bins with >2000 counts | High rate bins dominated by noise | Noise dominated (total time) | Noise dominated (detector-on time) | Marked lightcurve |
|---|---|---|---|---|---|---|---|
| A | 7268 | 5356 | 65 | 65 | 0.89% | 1.21% | 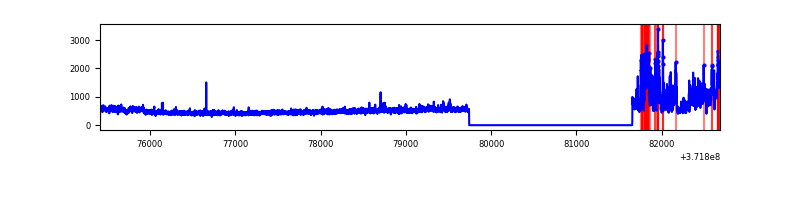 |
| B | 7268 | 5356 | 45 | 45 | 0.62% | 0.84% | 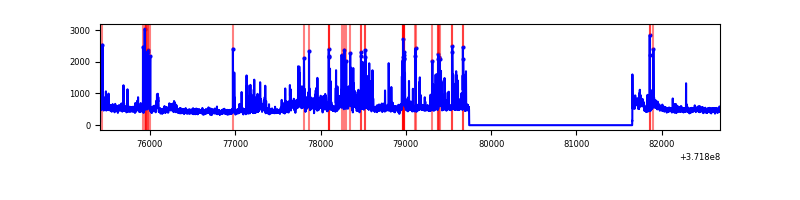 |
| C | 7268 | 5356 | 40 | 40 | 0.55% | 0.75% | 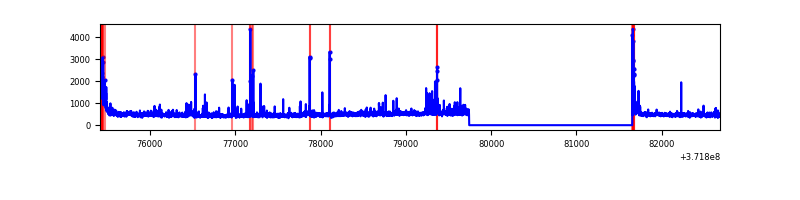 |
| D | 7268 | 5356 | 895 | 895 | 12.31% | 16.71% | 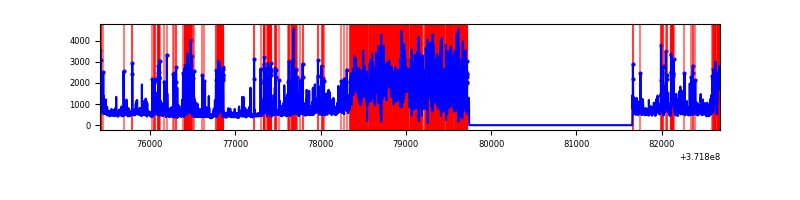 |
Top three noisy pixels from each quadrant. If the there are fewer than three noisy pixels in the level2.evt file, extra rows are filled as -1
| Pixel properties | Quadrant properties | ||||||
|---|---|---|---|---|---|---|---|
| Quadrant | DetID | PixID | Counts | Sigma | Mean | Median | Sigma |
| A | 15 | 249 | 620630 | 4803.52 | 642 | 632 | 129.1 |
| A | 0 | 253 | 25593 | 193.39 | 642 | 632 | 129.1 |
| A | 12 | 189 | 22121 | 166.49 | 642 | 632 | 129.1 |
| B | 3 | 26 | 295084 | 2412.93 | 649 | 636 | 122.0 |
| B | 0 | 219 | 107647 | 876.93 | 649 | 636 | 122.0 |
| B | 15 | 36 | 54112 | 438.22 | 649 | 636 | 122.0 |
| C | 0 | 10 | 186593 | 1302.82 | 618 | 623 | 142.7 |
| C | 8 | 35 | 70672 | 490.73 | 618 | 623 | 142.7 |
| C | 0 | 207 | 58381 | 404.63 | 618 | 623 | 142.7 |
| D | 7 | 38 | 1164265 | 8859.55 | 558 | 547 | 131.4 |
| D | 12 | 218 | 623908 | 4745.73 | 558 | 547 | 131.4 |
| D | 2 | 249 | 513795 | 3907.43 | 558 | 547 | 131.4 |
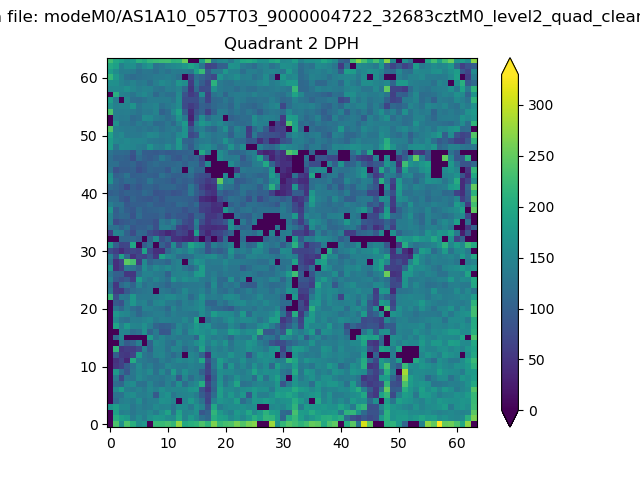
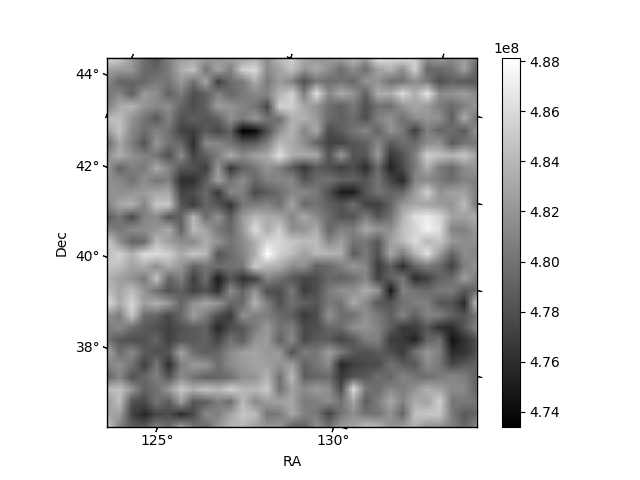
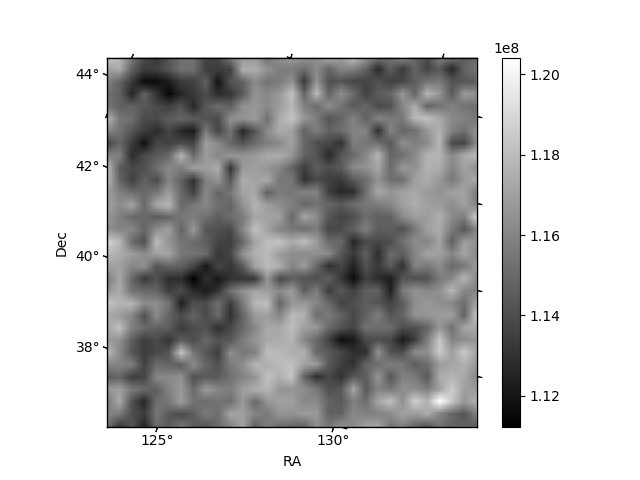
Histogram calculated using DETX and DETY for each event in the final _common_clean file
| Quadrant A | 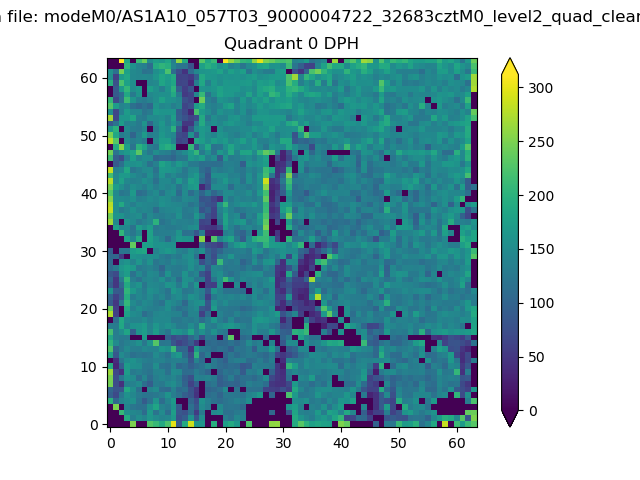 |
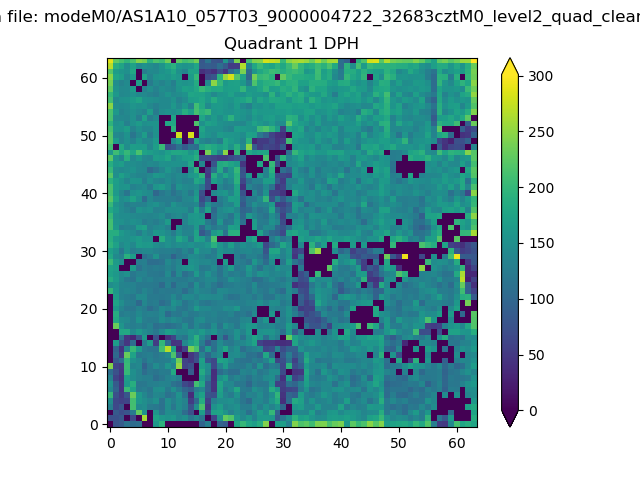 |
Quadrant B |
|---|---|---|---|
| Quadrant D | 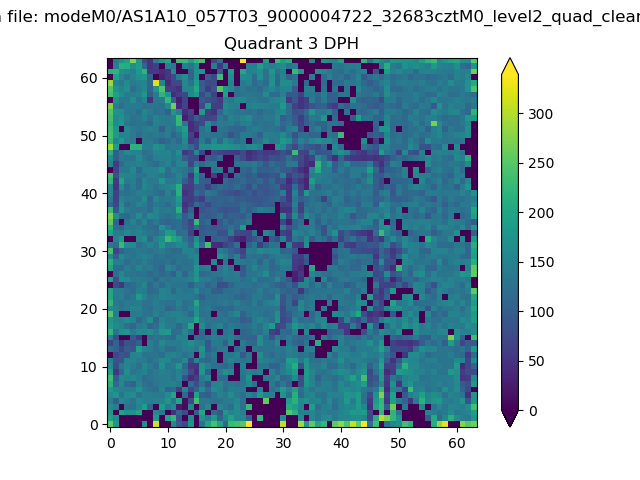 |
 |
Quadrant C |
| Plot type | Count rate plots | Images |
|---|---|---|
| Comparison with Poisson distribution Blue bars denote a histogram of data divided into 1 sec bins. Red curve is a Poisson curve with rate = median count rate of data. |
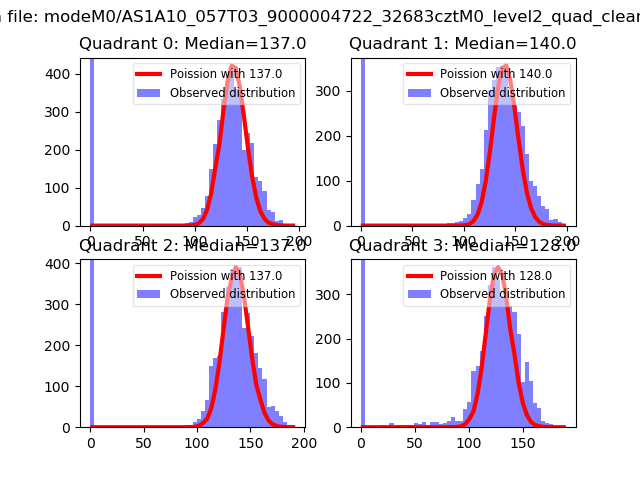 |
 |
| Quadrant-wise count rates Data is divided into 100 sec bins |
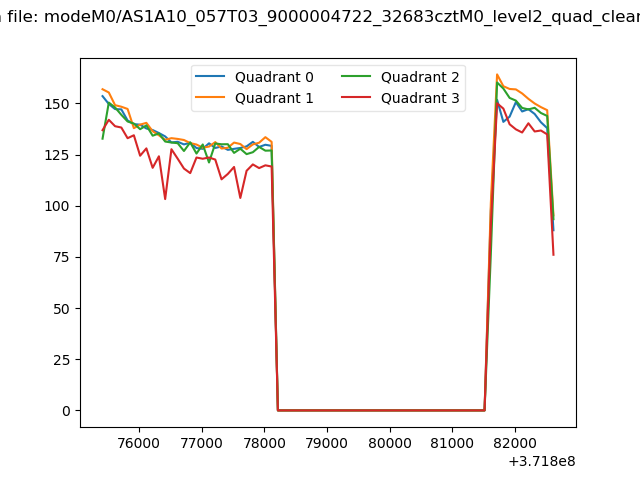 |
|
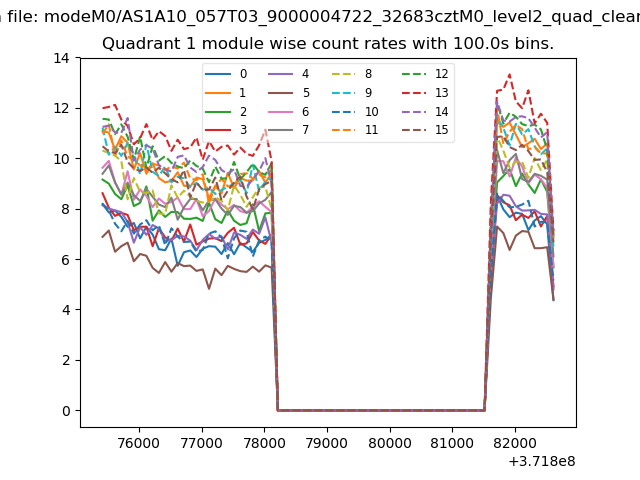
| Module-wise count rates for Quadrant A Data is divided into 100 sec bins |
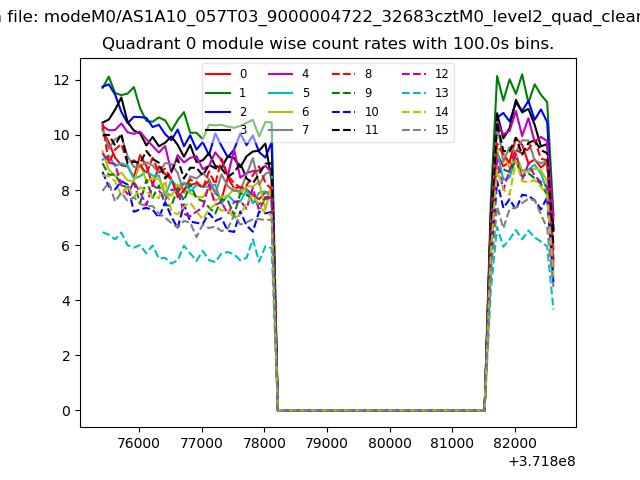 |
 |
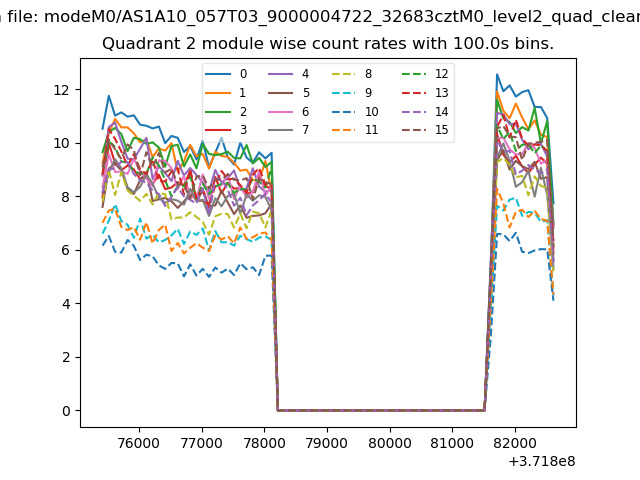
| Module-wise count rates for Quadrant B Data is divided into 100 sec bins |
 |
 |
| Module-wise count rates for Quadrant C Data is divided into 100 sec bins |
 |
 |
| Module-wise count rates for Quadrant D Data is divided into 100 sec bins |
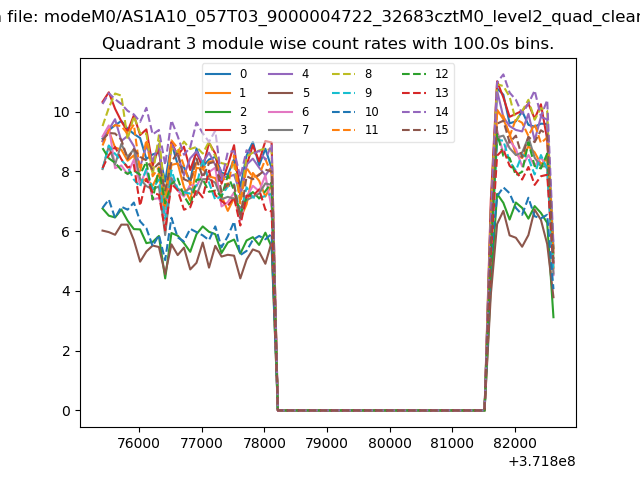 |
 |
| Parameter | Plot |
|---|---|
| CZT HV Monitor | 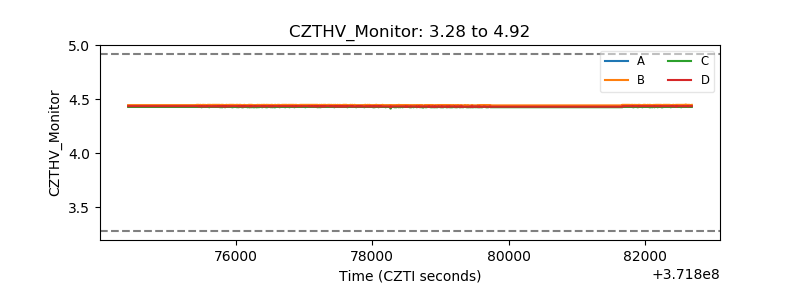 |
| D_VDD | 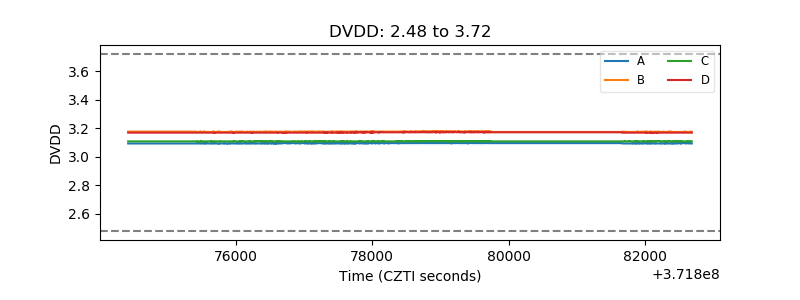 |
| Temperature 1 | 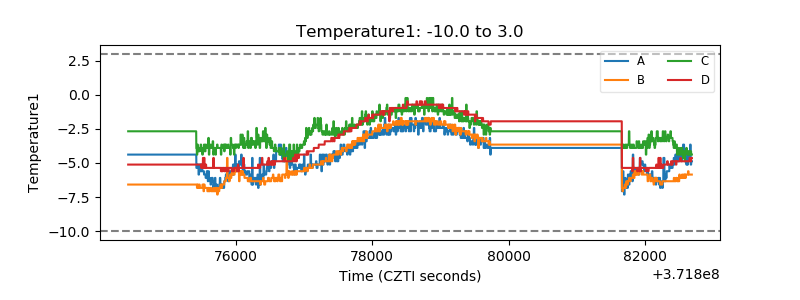 |
| Veto HV Monitor | 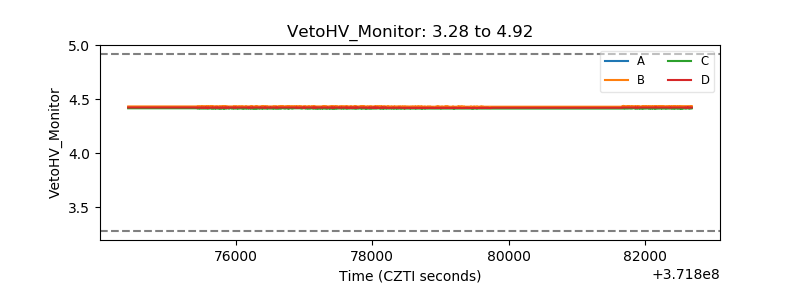 |
| Veto LLD |  |
| Alpha Counter | 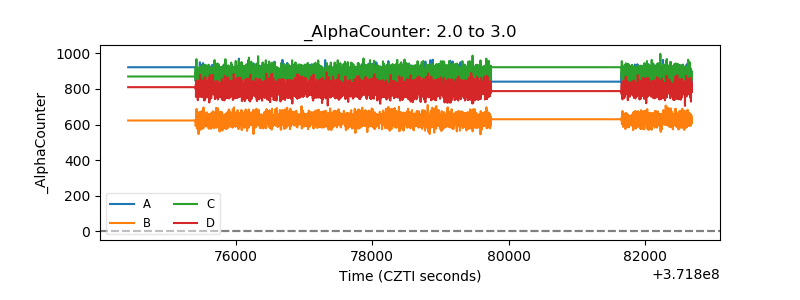 |
| _CPM_Rate | 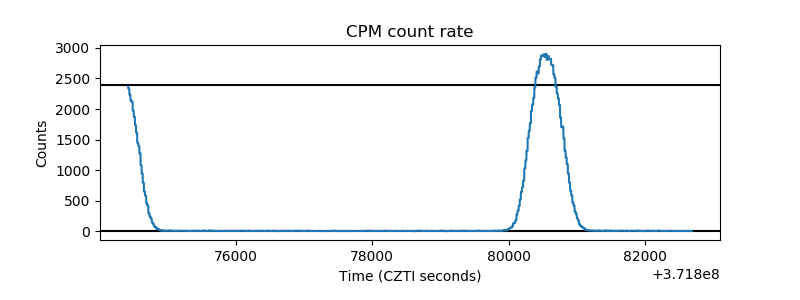 |
| CZT Counter | 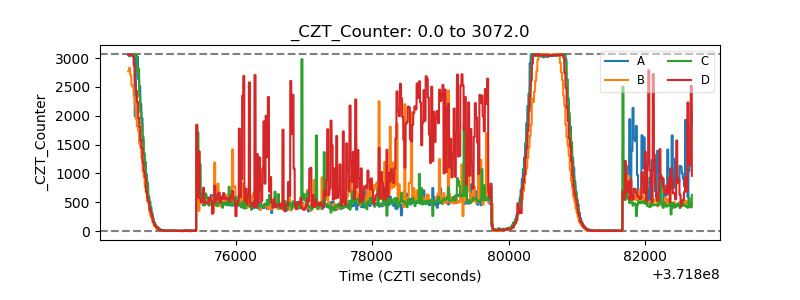 |
| +2.5 Volts monitor |  |
| +5 Volts monitor | 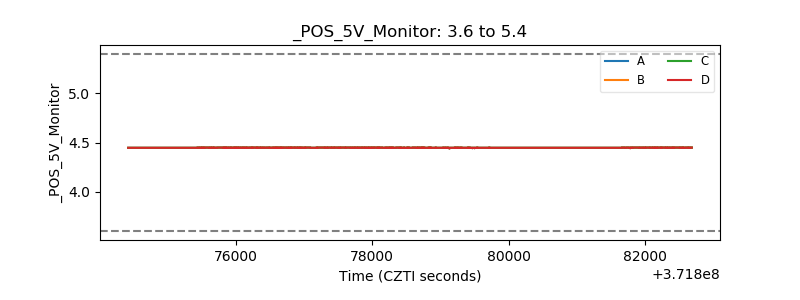 |
| _ROLL_ROT | 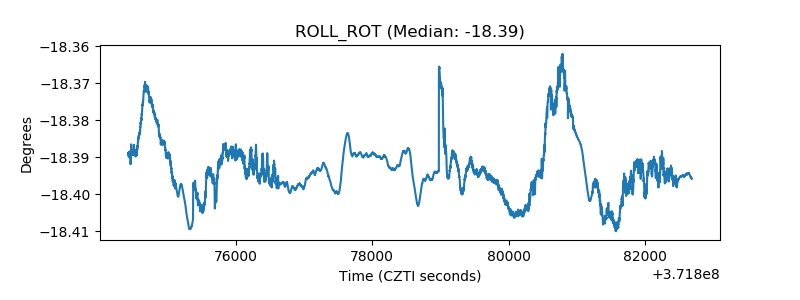 |
| _Roll_DEC | 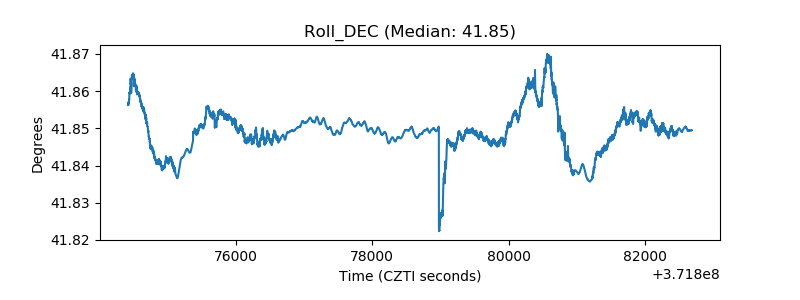 |
| _Roll_RA | 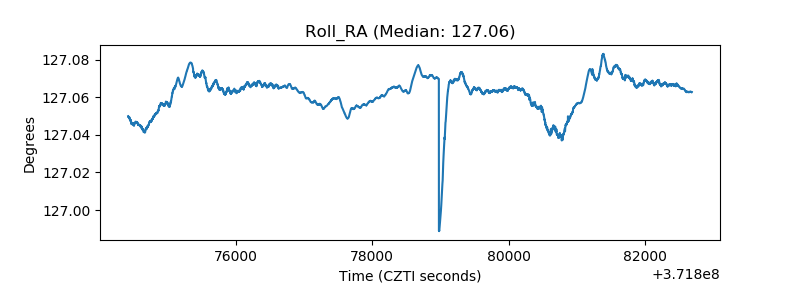 |
| Veto Counter | 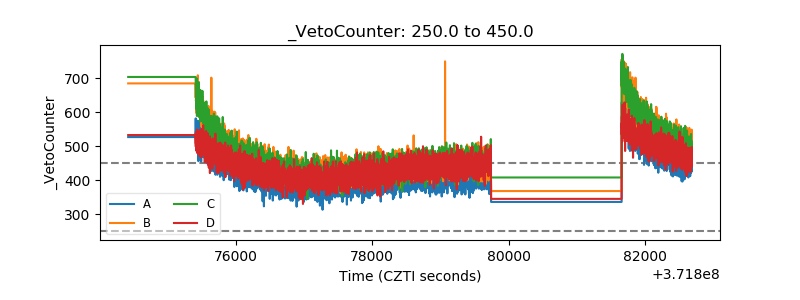 |