| Param | Original file | Final file |
|---|---|---|
| Filename | modeM0/AS1A10_057T03_9000004722_32684cztM0_level2.evt | modeM0/AS1A10_057T03_9000004722_32684cztM0_level2_quad_clean.evt |
| Size (bytes) | 680,742,720 | 72,832,320 |
| Size | 649.2 MB | 69.5 MB |
| Events in quadrant A | 7,424,173 | 361,362 |
| Events in quadrant B | 3,177,626 | 526,117 |
| Events in quadrant C | 2,900,246 | 504,926 |
| Events in quadrant D | 6,750,311 | 434,541 |
| Mode M0 | |||
|---|---|---|---|
| Quadrant | BADHDUFLAG | Total packets | Discarded packets |
| A | 0 | 25719 | 3 |
| B | 0 | 12830 | 2 |
| C | 0 | 11938 | 2 |
| D | 0 | 23795 | 2 |
| Mode M9 | |||
|---|---|---|---|
| Quadrant | BADHDUFLAG | Total packets | Discarded packets |
| A | 0 | 20 | 0 |
| B | 0 | 20 | 0 |
| C | 0 | 20 | 0 |
| D | 0 | 21 | 0 |
| Mode SS | |||
|---|---|---|---|
| Quadrant | BADHDUFLAG | Total packets | Discarded packets |
| A | 0 | 110 | 0 |
| B | 0 | 110 | 0 |
| C | 0 | 110 | 0 |
| D | 0 | 110 | 0 |
| Quadrant | Total seconds | Saturated seconds | Saturation percentage |
|---|---|---|---|
| A | 5391 | 1740 | 32.276016% |
| B | 5391 | 49 | 0.908922% |
| C | 5391 | 49 | 0.908922% |
| D | 5391 | 1120 | 20.775366% |
Noise dominated data is calculated using 1-second bins in cleaned event files. If a bin has >2000 counts, and if more than 50% of those come from <1% of pixels, then it is considered to be noise-dominated and hence unusable.
| Quadrant | # 1 sec bins | Bins with >0 counts | Bins with >2000 counts | High rate bins dominated by noise | Noise dominated (total time) | Noise dominated (detector-on time) | Marked lightcurve |
|---|---|---|---|---|---|---|---|
| A | 7392 | 5392 | 1560 | 1560 | 21.10% | 28.93% | 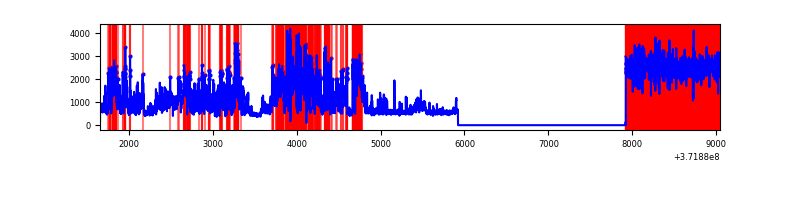 |
| B | 7392 | 5391 | 29 | 29 | 0.39% | 0.54% | 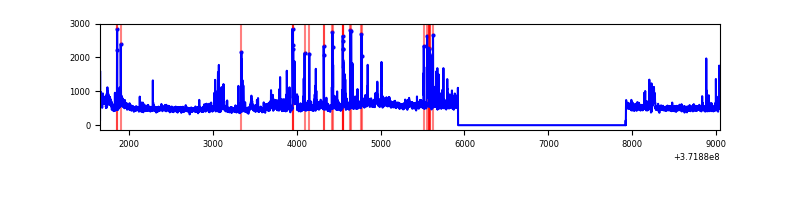 |
| C | 7392 | 5392 | 40 | 40 | 0.54% | 0.74% | 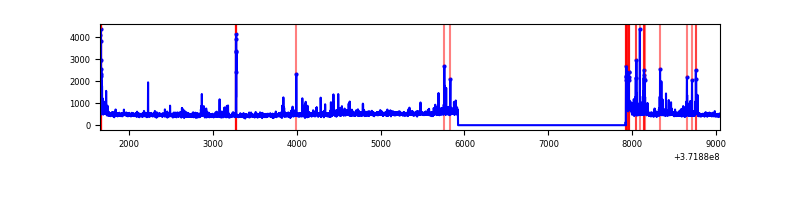 |
| D | 7392 | 5391 | 951 | 951 | 12.87% | 17.64% | 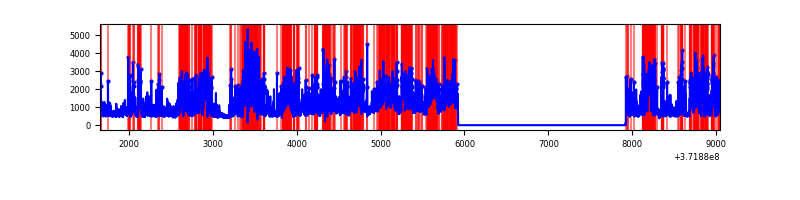 |
Top three noisy pixels from each quadrant. If the there are fewer than three noisy pixels in the level2.evt file, extra rows are filled as -1
| Pixel properties | Quadrant properties | ||||||
|---|---|---|---|---|---|---|---|
| Quadrant | DetID | PixID | Counts | Sigma | Mean | Median | Sigma |
| A | 15 | 249 | 4846481 | 44750.72 | 549 | 541 | 108.3 |
| A | 0 | 253 | 375118 | 3459.1 | 549 | 541 | 108.3 |
| A | 12 | 189 | 30932 | 280.65 | 549 | 541 | 108.3 |
| B | 3 | 26 | 195678 | 1551.07 | 674 | 662 | 125.7 |
| B | 12 | 1 | 74548 | 587.65 | 674 | 662 | 125.7 |
| B | 0 | 199 | 63234 | 497.67 | 674 | 662 | 125.7 |
| C | 9 | 236 | 103338 | 707.56 | 641 | 648 | 145.1 |
| C | 0 | 10 | 101492 | 694.84 | 641 | 648 | 145.1 |
| C | 0 | 207 | 39437 | 267.26 | 641 | 648 | 145.1 |
| D | 2 | 249 | 652343 | 4687.5 | 585 | 573 | 139.0 |
| D | 4 | 239 | 640799 | 4604.47 | 585 | 573 | 139.0 |
| D | 7 | 80 | 625458 | 4494.14 | 585 | 573 | 139.0 |
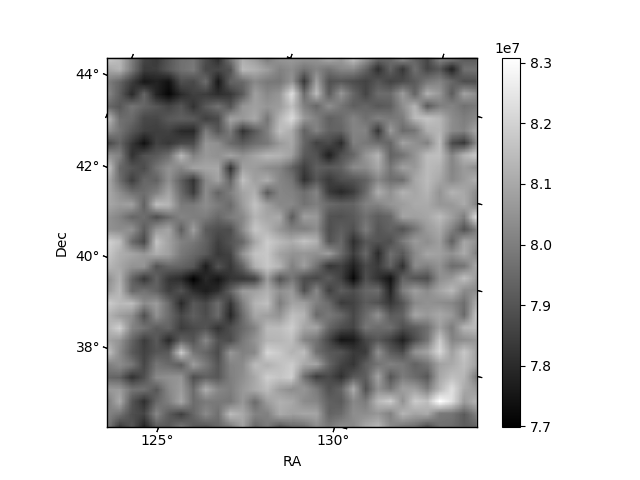
Histogram calculated using DETX and DETY for each event in the final _common_clean file
| Quadrant A | 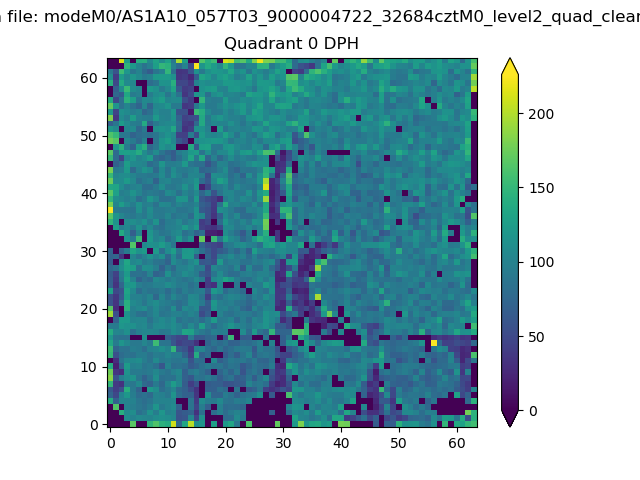 |
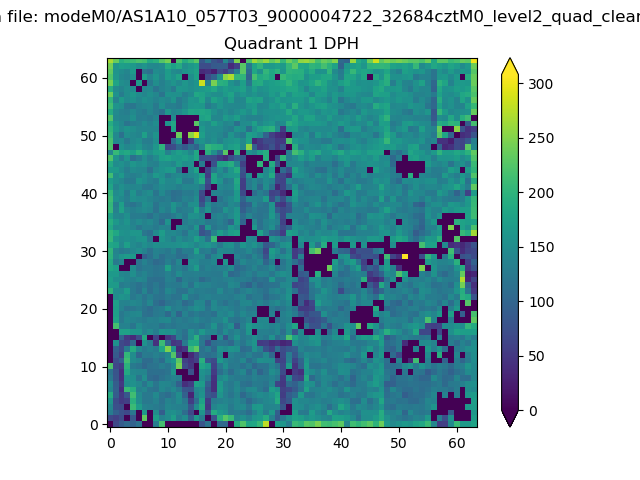 |
Quadrant B |
|---|---|---|---|
| Quadrant D |  |
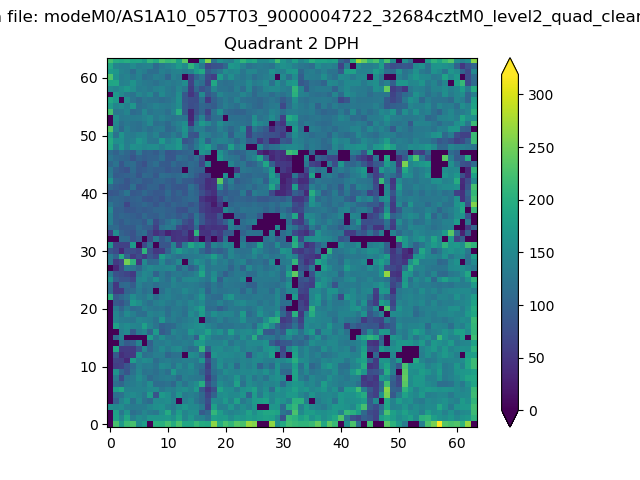 |
Quadrant C |
| Plot type | Count rate plots | Images |
|---|---|---|
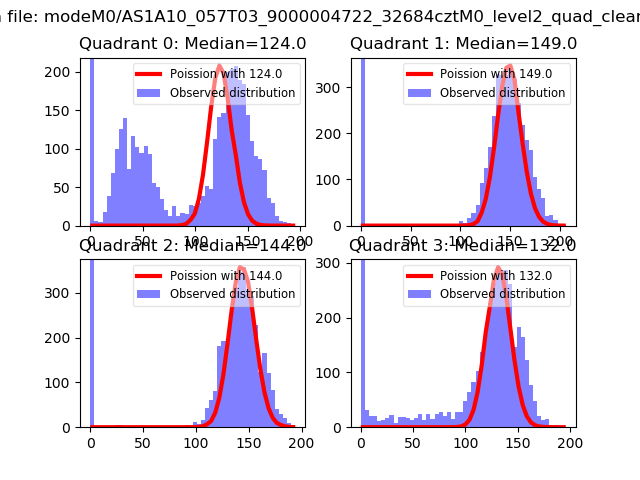
| Comparison with Poisson distribution Blue bars denote a histogram of data divided into 1 sec bins. Red curve is a Poisson curve with rate = median count rate of data. |
 |
 |
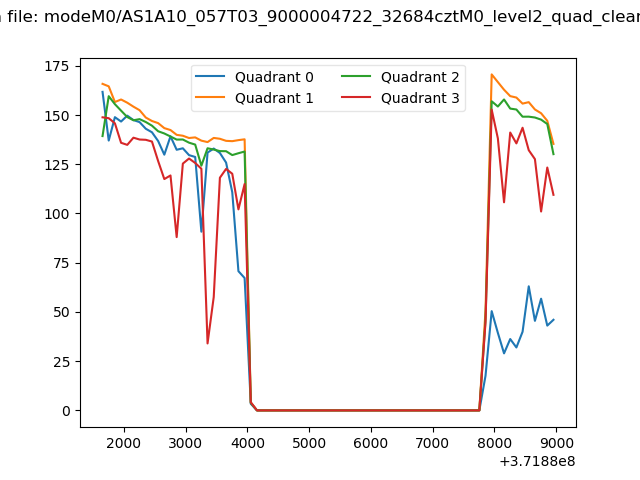
| Quadrant-wise count rates Data is divided into 100 sec bins |
 |
|
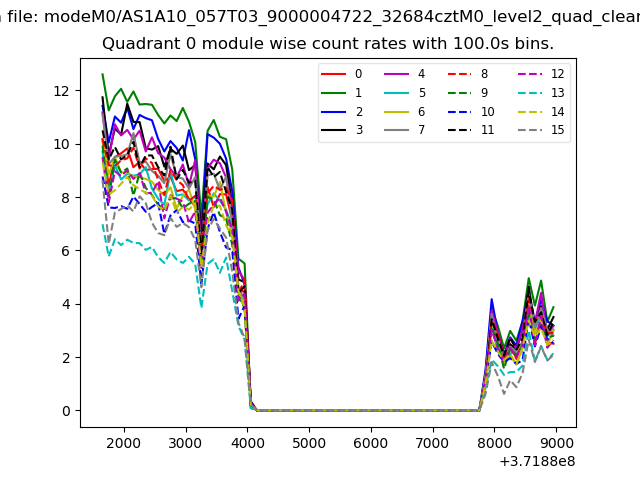
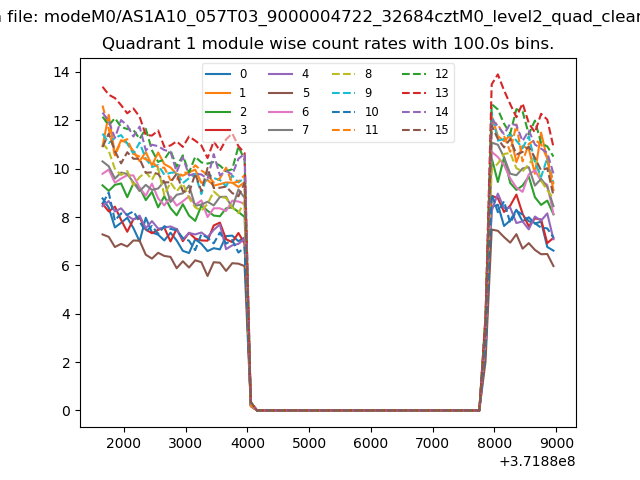
| Module-wise count rates for Quadrant A Data is divided into 100 sec bins |
 |
 |
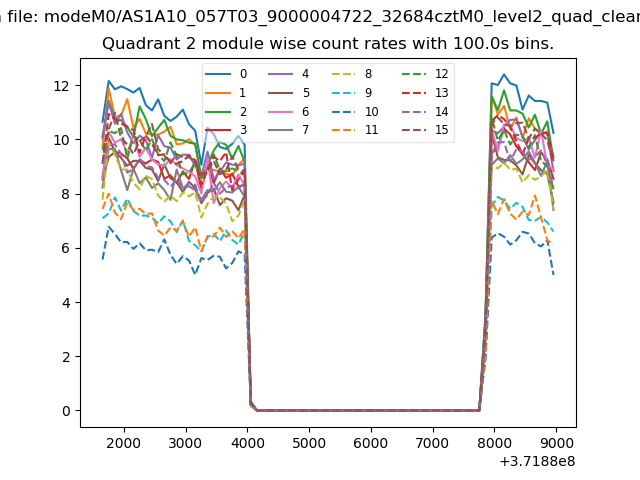
| Module-wise count rates for Quadrant B Data is divided into 100 sec bins |
 |
 |
| Module-wise count rates for Quadrant C Data is divided into 100 sec bins |
 |
 |
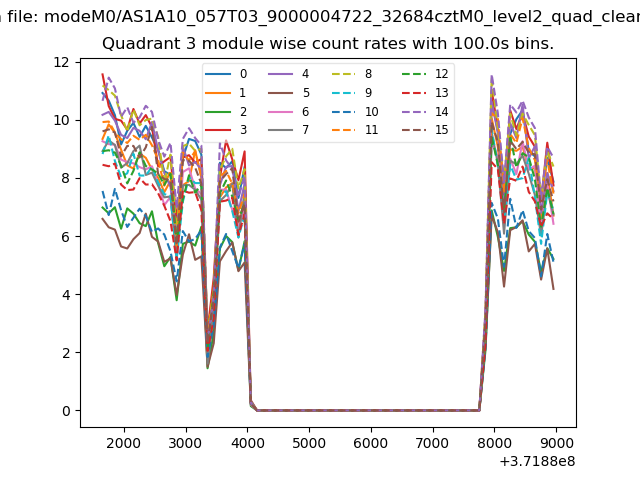
| Module-wise count rates for Quadrant D Data is divided into 100 sec bins |
 |
 |
| Parameter | Plot |
|---|---|
| CZT HV Monitor | 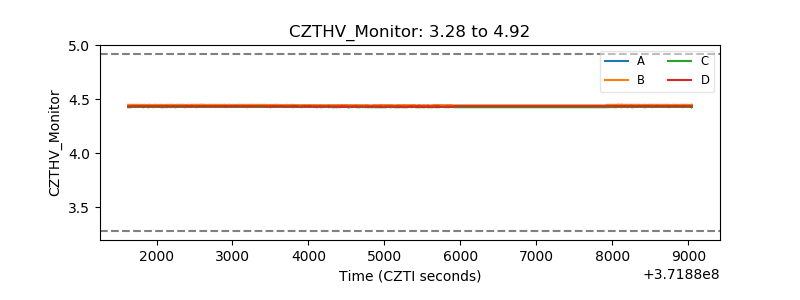 |
| D_VDD | 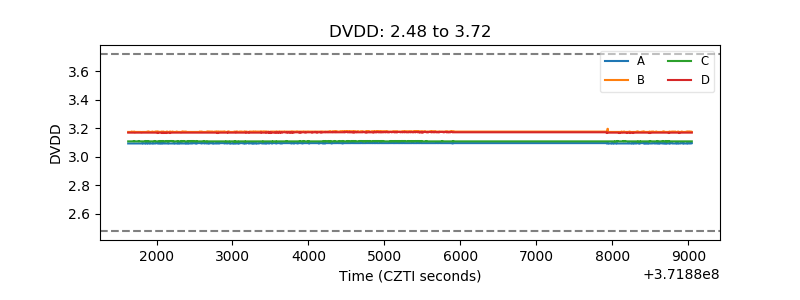 |
| Temperature 1 | 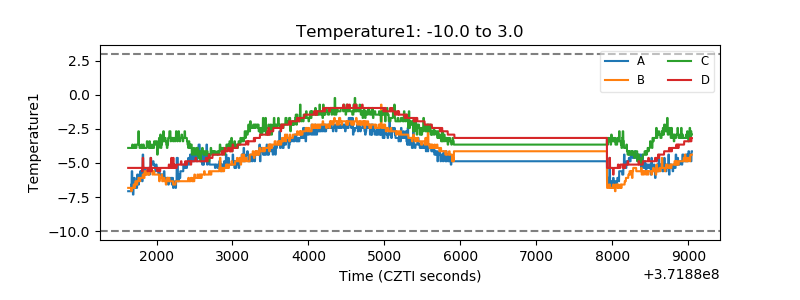 |
| Veto HV Monitor | 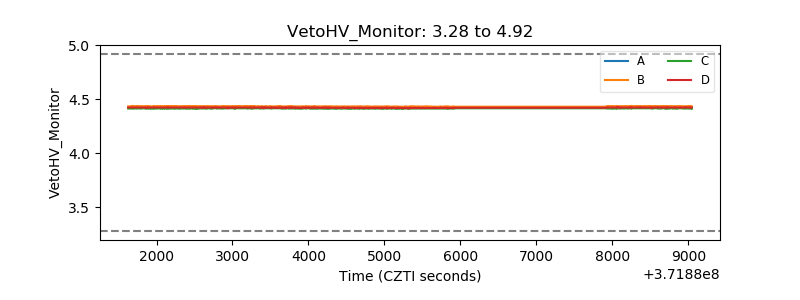 |
| Veto LLD | 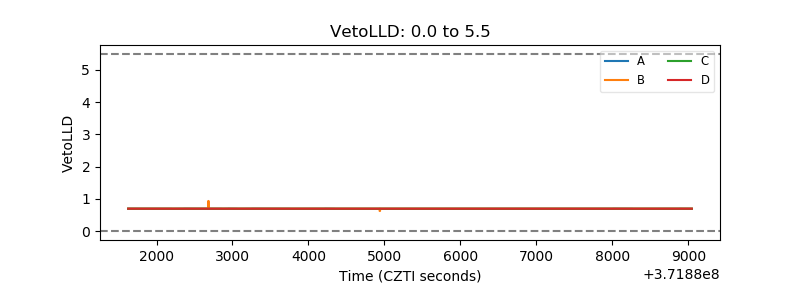 |
| Alpha Counter | 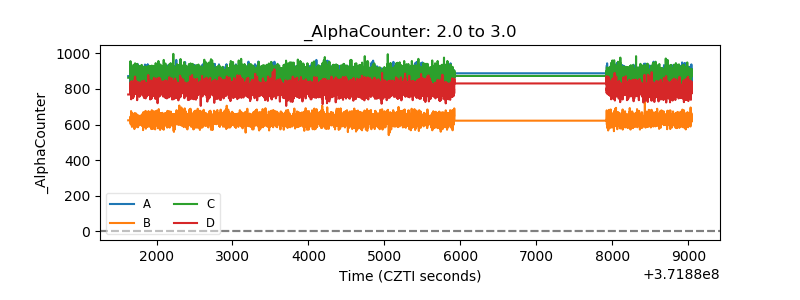 |
| _CPM_Rate | 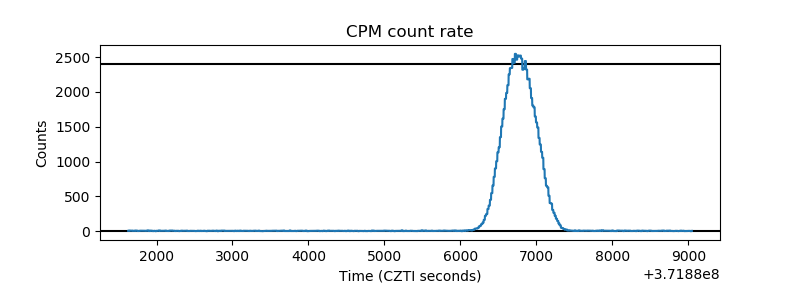 |
| CZT Counter | 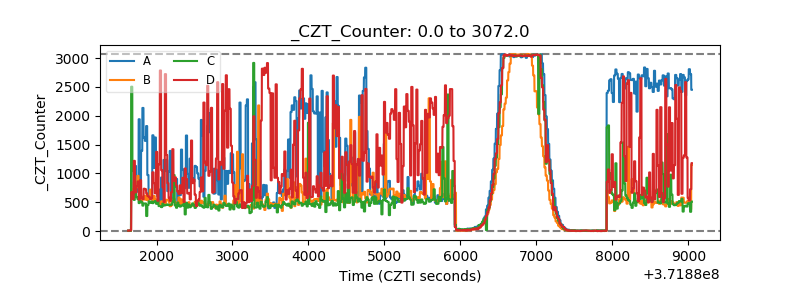 |
| +2.5 Volts monitor |  |
| +5 Volts monitor |  |
| _ROLL_ROT | 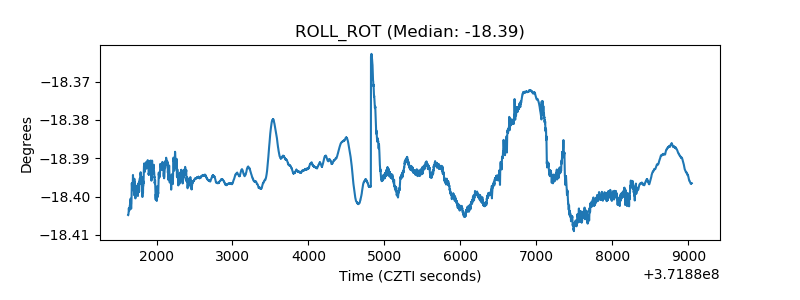 |
| _Roll_DEC | 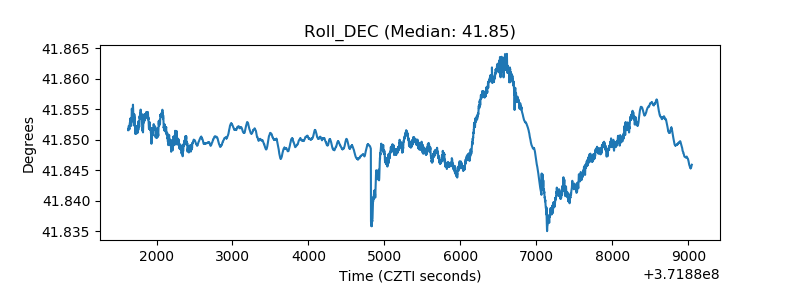 |
| _Roll_RA | 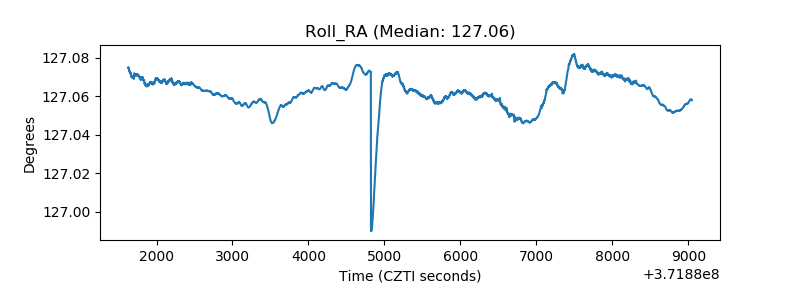 |
| Veto Counter | 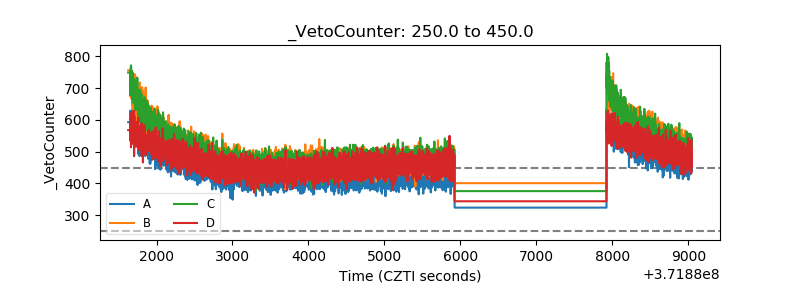 |