| Param | Original file | Final file |
|---|---|---|
| Filename | modeM0/AS1A10_057T03_9000004722_32686cztM0_level2.evt | modeM0/AS1A10_057T03_9000004722_32686cztM0_level2_quad_clean.evt |
| Size (bytes) | 686,551,680 | 58,161,600 |
| Size | 654.7 MB | 55.5 MB |
| Events in quadrant A | 8,186,231 | 233,250 |
| Events in quadrant B | 2,867,761 | 417,961 |
| Events in quadrant C | 2,852,657 | 405,627 |
| Events in quadrant D | 6,552,860 | 357,106 |
| Mode M0 | |||
|---|---|---|---|
| Quadrant | BADHDUFLAG | Total packets | Discarded packets |
| A | 0 | 27646 | 2 |
| B | 0 | 11401 | 1 |
| C | 0 | 11438 | 1 |
| D | 0 | 22924 | 1 |
| Mode M9 | |||
|---|---|---|---|
| Quadrant | BADHDUFLAG | Total packets | Discarded packets |
| A | 0 | 21 | 0 |
| B | 0 | 21 | 0 |
| C | 0 | 21 | 0 |
| D | 0 | 21 | 0 |
| Mode SS | |||
|---|---|---|---|
| Quadrant | BADHDUFLAG | Total packets | Discarded packets |
| A | 0 | 100 | 0 |
| B | 0 | 100 | 0 |
| C | 0 | 100 | 0 |
| D | 0 | 100 | 0 |
| Quadrant | Total seconds | Saturated seconds | Saturation percentage |
|---|---|---|---|
| A | 4932 | 2134 | 43.268451% |
| B | 4932 | 55 | 1.115166% |
| C | 4932 | 102 | 2.068127% |
| D | 4932 | 1230 | 24.939173% |
Noise dominated data is calculated using 1-second bins in cleaned event files. If a bin has >2000 counts, and if more than 50% of those come from <1% of pixels, then it is considered to be noise-dominated and hence unusable.
| Quadrant | # 1 sec bins | Bins with >0 counts | Bins with >2000 counts | High rate bins dominated by noise | Noise dominated (total time) | Noise dominated (detector-on time) | Marked lightcurve |
|---|---|---|---|---|---|---|---|
| A | 7084 | 4933 | 1946 | 1946 | 27.47% | 39.45% | 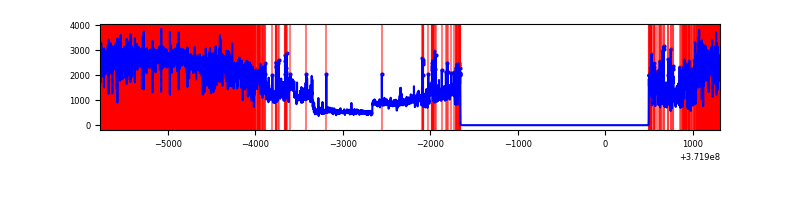 |
| B | 7084 | 4933 | 27 | 27 | 0.38% | 0.55% | 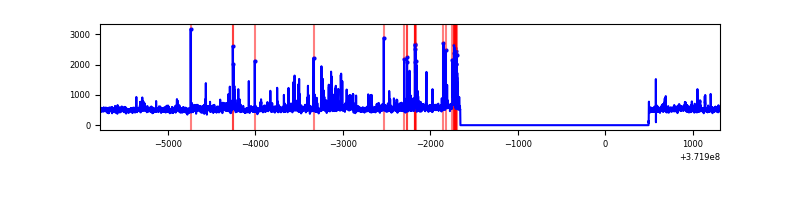 |
| C | 7084 | 4933 | 84 | 84 | 1.19% | 1.70% | 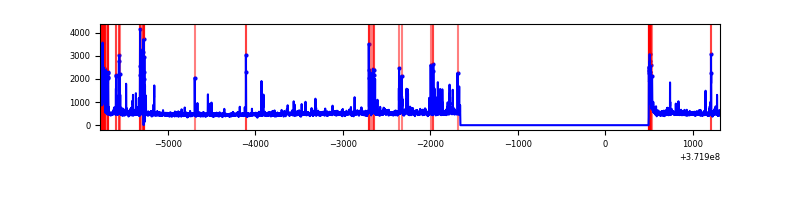 |
| D | 7084 | 4933 | 1098 | 1098 | 15.50% | 22.26% | 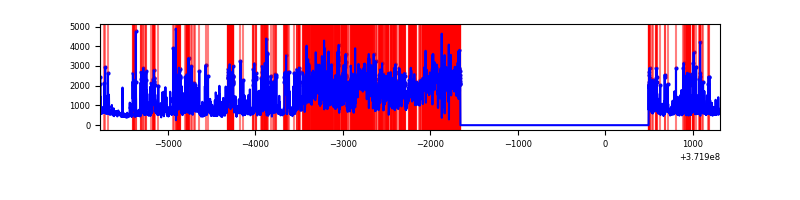 |
Top three noisy pixels from each quadrant. If the there are fewer than three noisy pixels in the level2.evt file, extra rows are filled as -1
| Pixel properties | Quadrant properties | ||||||
|---|---|---|---|---|---|---|---|
| Quadrant | DetID | PixID | Counts | Sigma | Mean | Median | Sigma |
| A | 15 | 249 | 6256242 | 66000.17 | 477 | 468 | 94.8 |
| A | 7 | 16 | 34584 | 359.93 | 477 | 468 | 94.8 |
| A | 13 | 6 | 17583 | 180.57 | 477 | 468 | 94.8 |
| B | 3 | 26 | 150316 | 1291.3 | 616 | 604 | 115.9 |
| B | 3 | 32 | 78014 | 667.68 | 616 | 604 | 115.9 |
| B | 15 | 36 | 48652 | 414.42 | 616 | 604 | 115.9 |
| C | 0 | 10 | 183338 | 1354.26 | 587 | 592 | 134.9 |
| C | 9 | 236 | 173390 | 1280.54 | 587 | 592 | 134.9 |
| C | 0 | 207 | 47572 | 348.15 | 587 | 592 | 134.9 |
| D | 7 | 38 | 1490171 | 11610.8 | 542 | 532 | 128.3 |
| D | 12 | 227 | 550641 | 4287.75 | 542 | 532 | 128.3 |
| D | 7 | 80 | 317106 | 2467.49 | 542 | 532 | 128.3 |
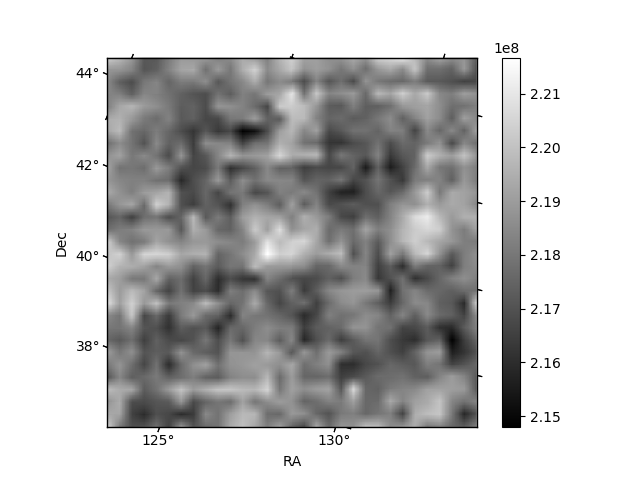
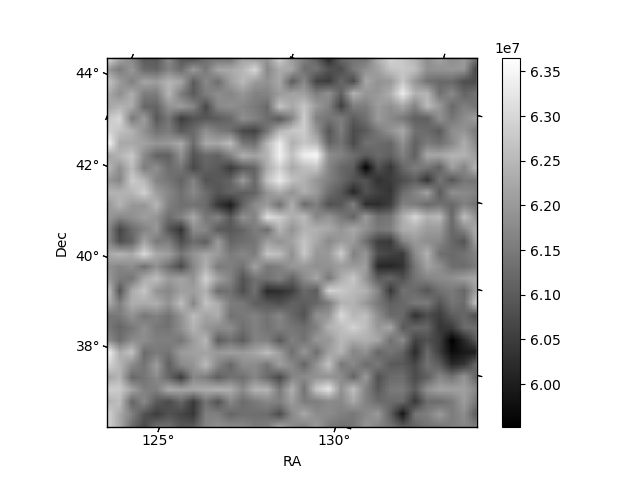
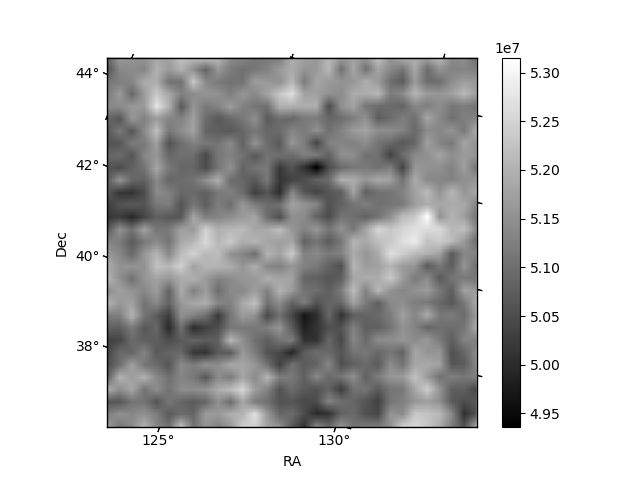
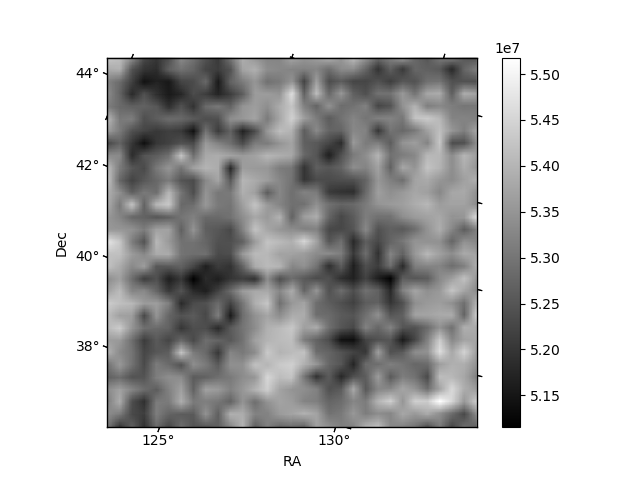
Histogram calculated using DETX and DETY for each event in the final _common_clean file
| Quadrant A | 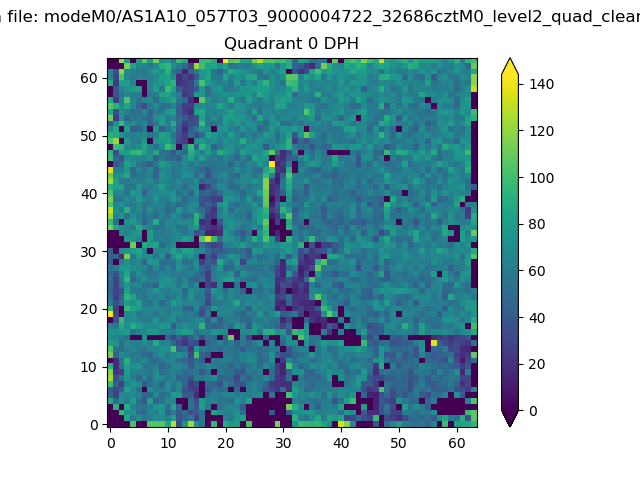 |
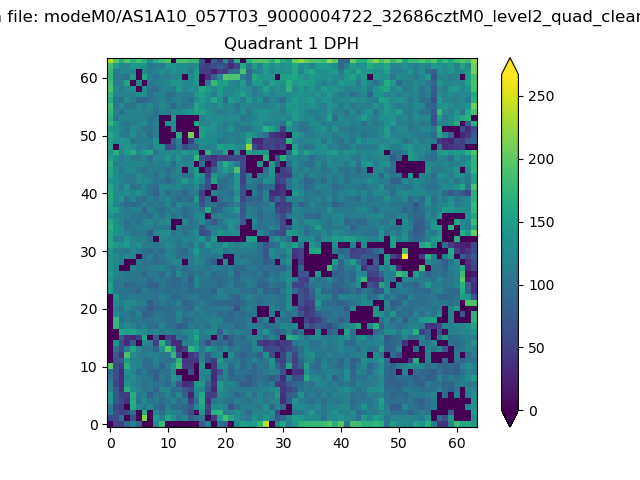 |
Quadrant B |
|---|---|---|---|
| Quadrant D | 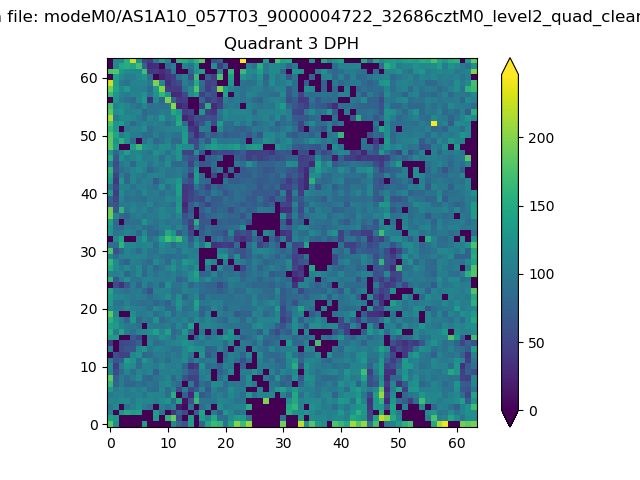 |
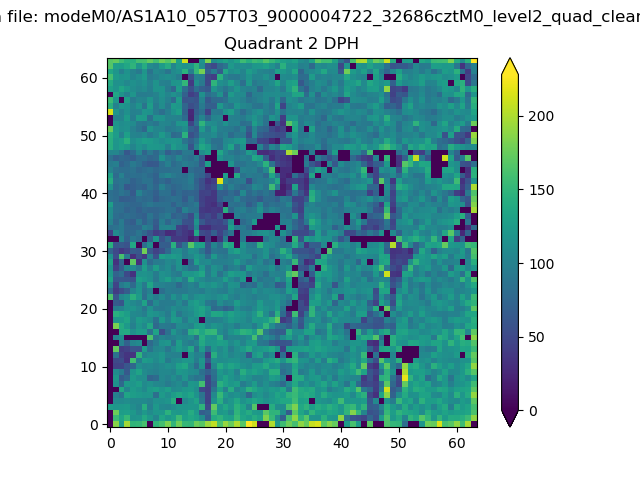 |
Quadrant C |
| Plot type | Count rate plots | Images |
|---|---|---|
| Comparison with Poisson distribution Blue bars denote a histogram of data divided into 1 sec bins. Red curve is a Poisson curve with rate = median count rate of data. |
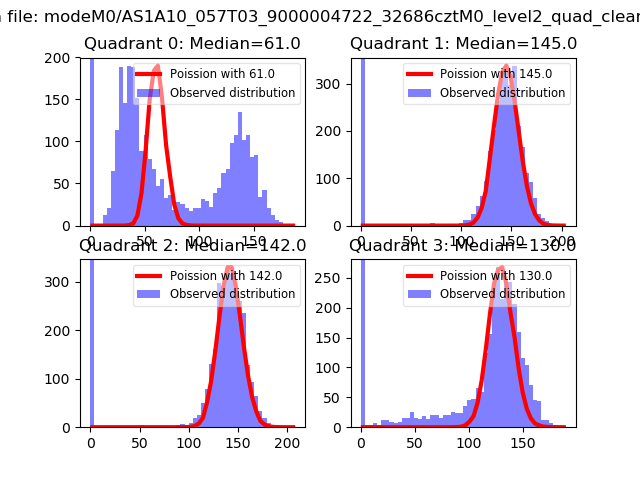 |
 |
| Quadrant-wise count rates Data is divided into 100 sec bins |
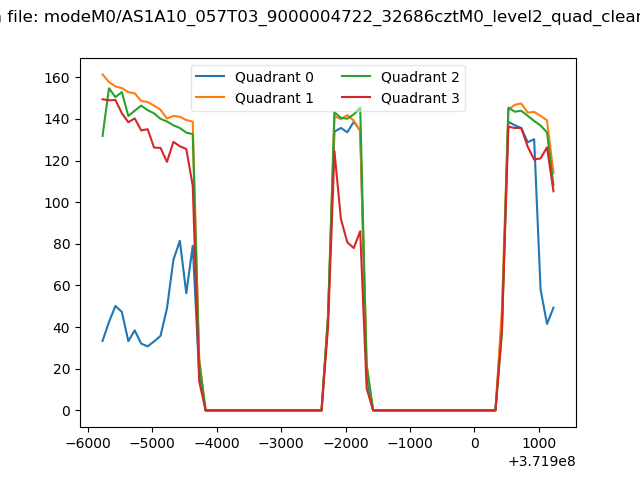 |
|
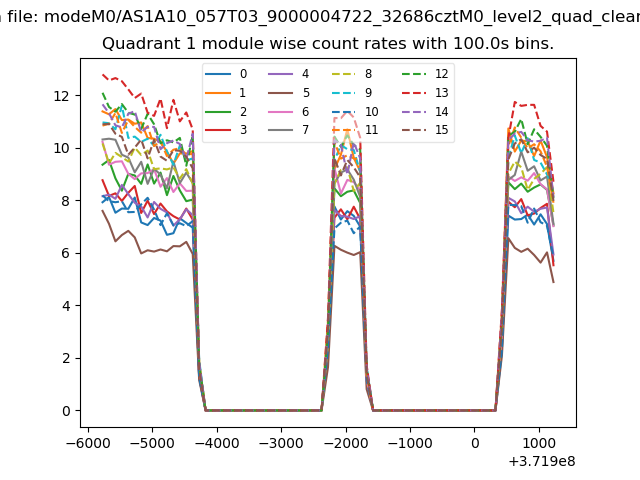
| Module-wise count rates for Quadrant A Data is divided into 100 sec bins |
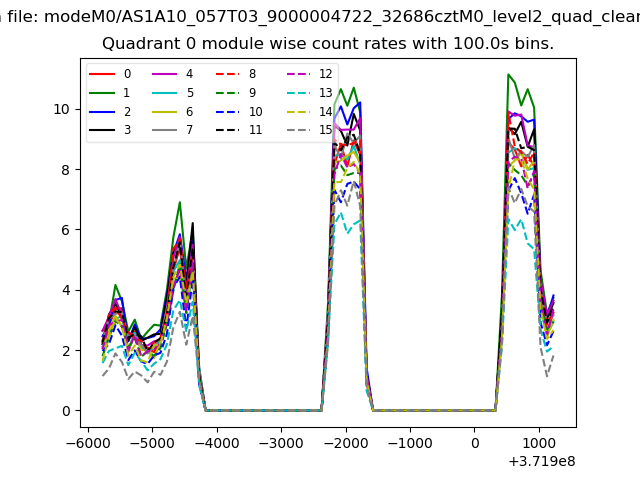 |
 |
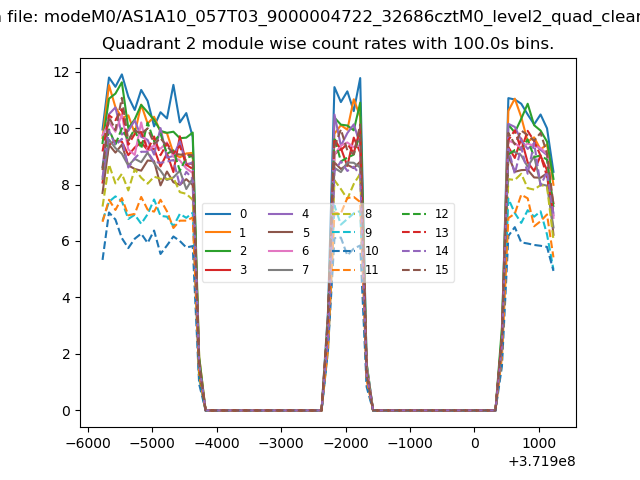
| Module-wise count rates for Quadrant B Data is divided into 100 sec bins |
 |
 |
| Module-wise count rates for Quadrant C Data is divided into 100 sec bins |
 |
 |
| Module-wise count rates for Quadrant D Data is divided into 100 sec bins |
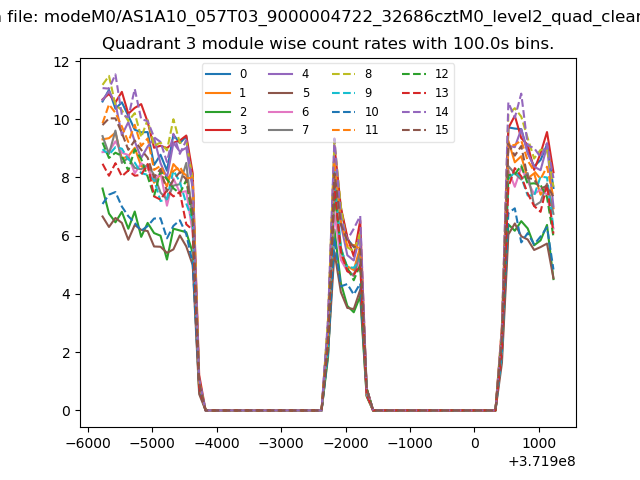 |
 |
| Parameter | Plot |
|---|---|
| CZT HV Monitor | 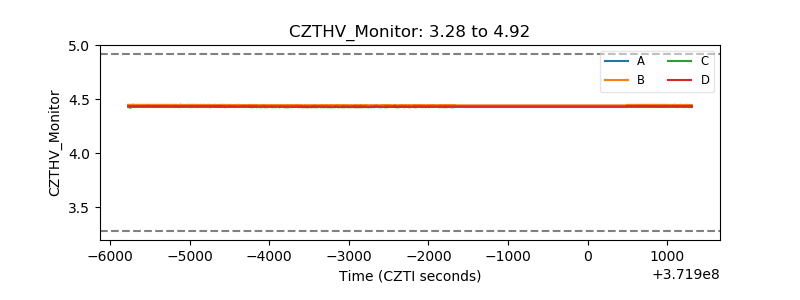 |
| D_VDD |  |
| Temperature 1 | 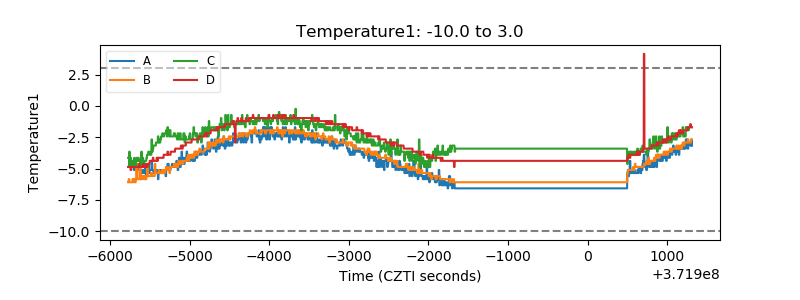 |
| Veto HV Monitor | 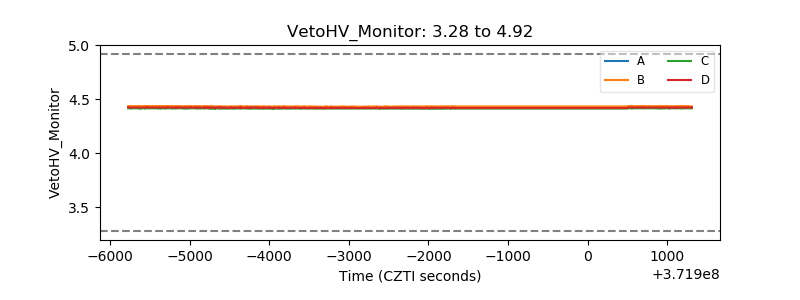 |
| Veto LLD | 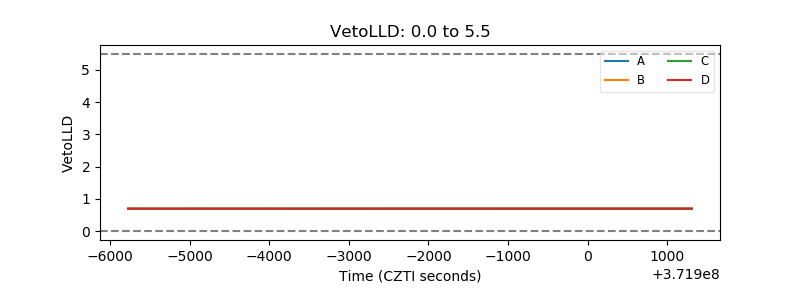 |
| Alpha Counter | 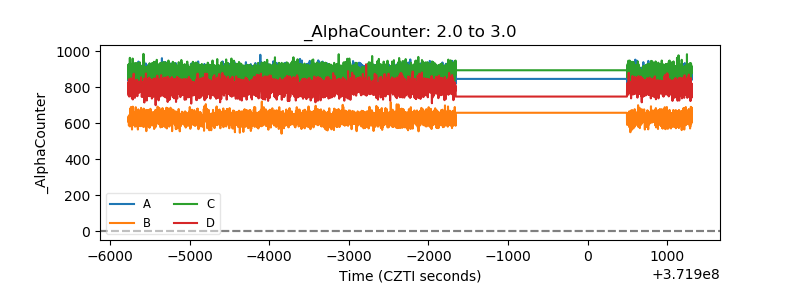 |
| _CPM_Rate | 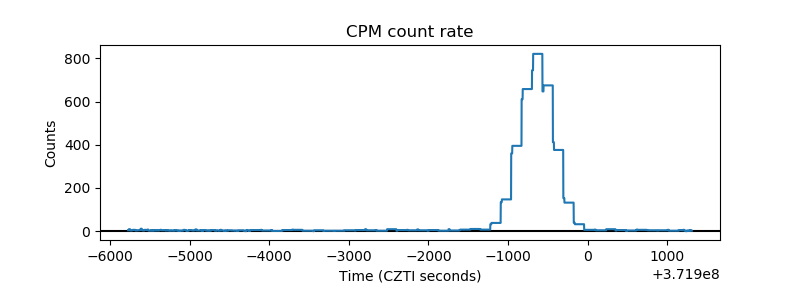 |
| CZT Counter | 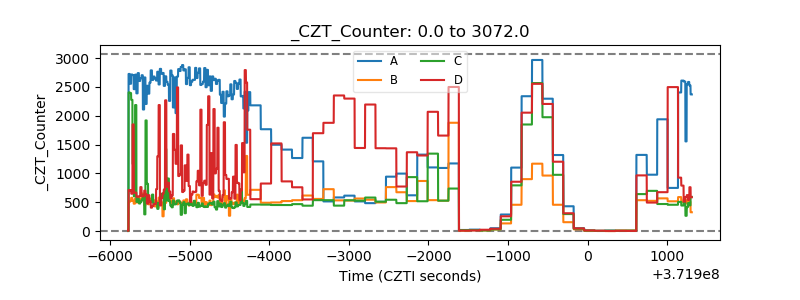 |
| +2.5 Volts monitor |  |
| +5 Volts monitor |  |
| _ROLL_ROT | 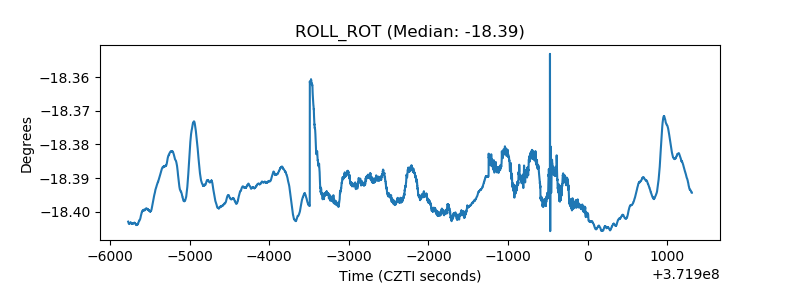 |
| _Roll_DEC | 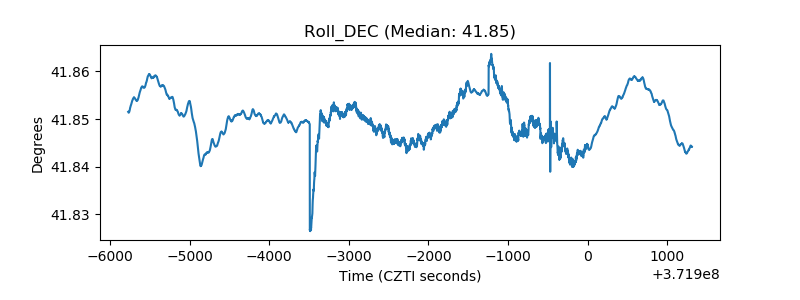 |
| _Roll_RA | 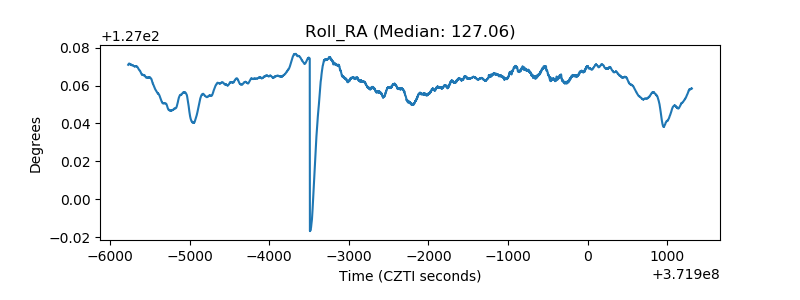 |
| Veto Counter | 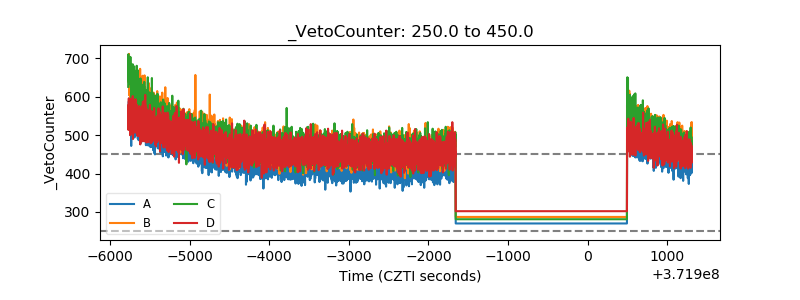 |