| Param | Original file | Final file |
|---|---|---|
| Filename | modeM0/AS1A10_057T03_9000004722_32687cztM0_level2.evt | modeM0/AS1A10_057T03_9000004722_32687cztM0_level2_quad_clean.evt |
| Size (bytes) | 568,880,640 | 58,582,080 |
| Size | 542.5 MB | 55.9 MB |
| Events in quadrant A | 5,754,185 | 313,199 |
| Events in quadrant B | 2,879,856 | 388,249 |
| Events in quadrant C | 2,797,664 | 379,878 |
| Events in quadrant D | 5,465,034 | 347,318 |
| Mode M0 | |||
|---|---|---|---|
| Quadrant | BADHDUFLAG | Total packets | Discarded packets |
| A | 0 | 20357 | 3 |
| B | 0 | 11454 | 2 |
| C | 0 | 11305 | 2 |
| D | 0 | 19829 | 2 |
| Mode M9 | |||
|---|---|---|---|
| Quadrant | BADHDUFLAG | Total packets | Discarded packets |
| A | 0 | 25 | 0 |
| B | 0 | 25 | 0 |
| C | 0 | 25 | 0 |
| D | 0 | 26 | 0 |
| Mode SS | |||
|---|---|---|---|
| Quadrant | BADHDUFLAG | Total packets | Discarded packets |
| A | 0 | 100 | 0 |
| B | 0 | 100 | 0 |
| C | 0 | 100 | 0 |
| D | 0 | 100 | 0 |
| Quadrant | Total seconds | Saturated seconds | Saturation percentage |
|---|---|---|---|
| A | 4911 | 1035 | 21.075137% |
| B | 4911 | 49 | 0.997760% |
| C | 4911 | 101 | 2.056608% |
| D | 4911 | 493 | 10.038689% |
Noise dominated data is calculated using 1-second bins in cleaned event files. If a bin has >2000 counts, and if more than 50% of those come from <1% of pixels, then it is considered to be noise-dominated and hence unusable.
| Quadrant | # 1 sec bins | Bins with >0 counts | Bins with >2000 counts | High rate bins dominated by noise | Noise dominated (total time) | Noise dominated (detector-on time) | Marked lightcurve |
|---|---|---|---|---|---|---|---|
| A | 6975 | 4912 | 912 | 912 | 13.08% | 18.57% | 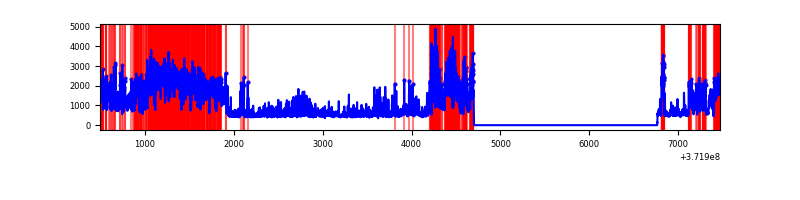 |
| B | 6975 | 4912 | 36 | 36 | 0.52% | 0.73% | 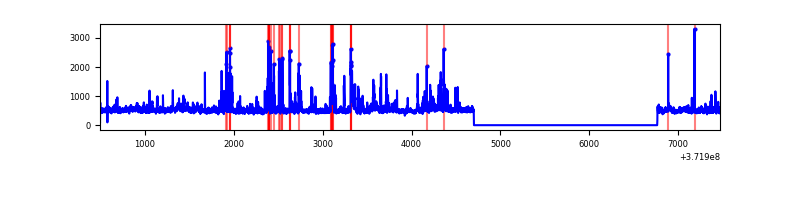 |
| C | 6975 | 4912 | 82 | 82 | 1.18% | 1.67% | 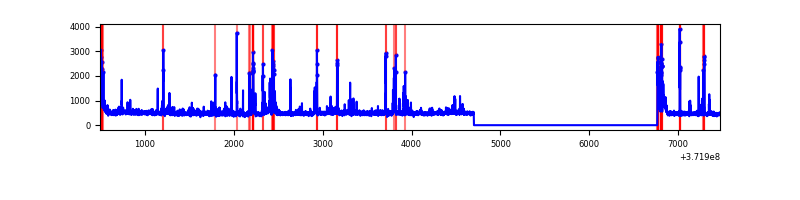 |
| D | 6975 | 4912 | 445 | 445 | 6.38% | 9.06% | 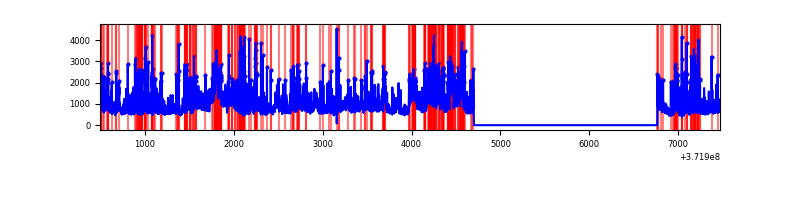 |
Top three noisy pixels from each quadrant. If the there are fewer than three noisy pixels in the level2.evt file, extra rows are filled as -1
| Pixel properties | Quadrant properties | ||||||
|---|---|---|---|---|---|---|---|
| Quadrant | DetID | PixID | Counts | Sigma | Mean | Median | Sigma |
| A | 15 | 249 | 2781305 | 25977.52 | 543 | 534 | 107.0 |
| A | 0 | 253 | 802258 | 7489.58 | 543 | 534 | 107.0 |
| A | 7 | 16 | 27367 | 250.67 | 543 | 534 | 107.0 |
| B | 3 | 26 | 254377 | 2227.47 | 600 | 588 | 113.9 |
| B | 0 | 219 | 47969 | 415.86 | 600 | 588 | 113.9 |
| B | 3 | 32 | 47388 | 410.76 | 600 | 588 | 113.9 |
| C | 9 | 236 | 250719 | 1894.49 | 575 | 580 | 132.0 |
| C | 0 | 10 | 173520 | 1309.8 | 575 | 580 | 132.0 |
| C | 9 | 54 | 40342 | 301.15 | 575 | 580 | 132.0 |
| D | 12 | 227 | 960846 | 7216.21 | 560 | 549 | 133.1 |
| D | 2 | 250 | 400033 | 3001.95 | 560 | 549 | 133.1 |
| D | 2 | 249 | 381381 | 2861.78 | 560 | 549 | 133.1 |
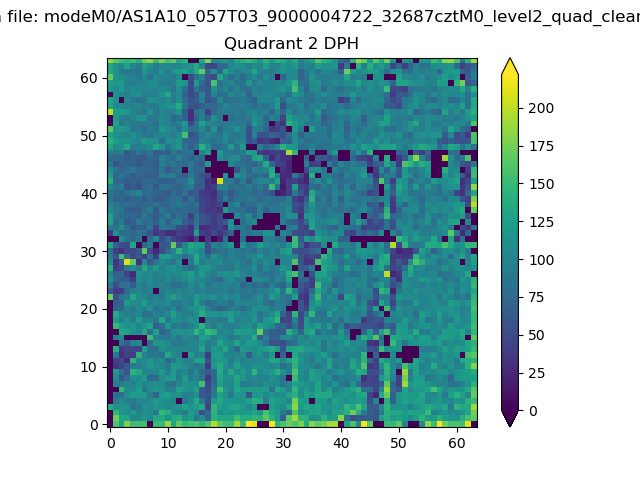
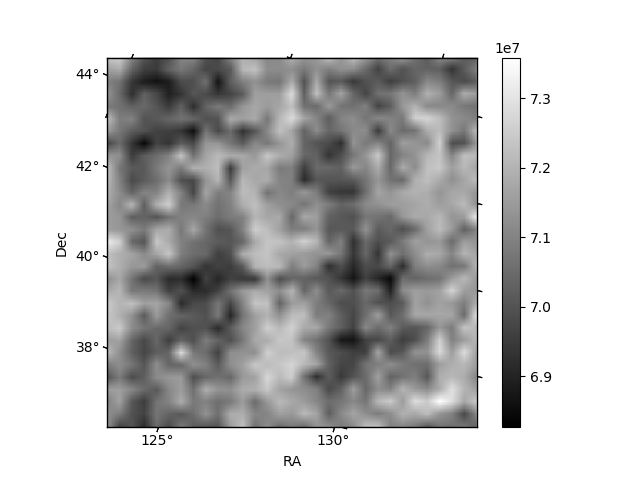
Histogram calculated using DETX and DETY for each event in the final _common_clean file
| Quadrant A | 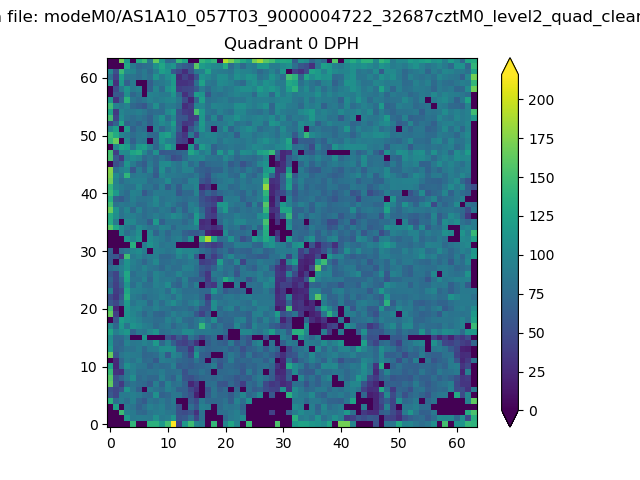 |
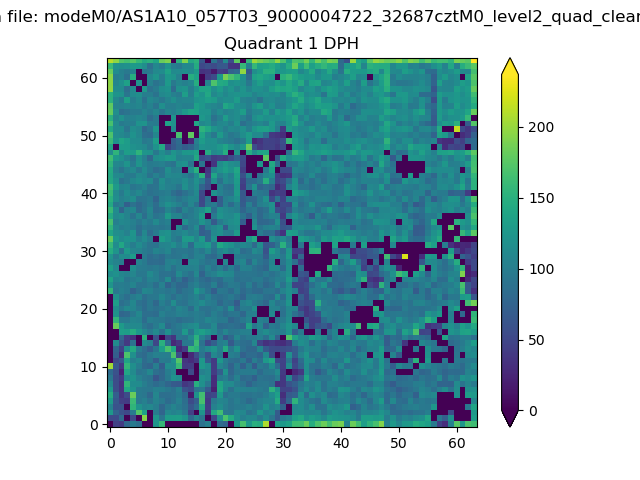 |
Quadrant B |
|---|---|---|---|
| Quadrant D | 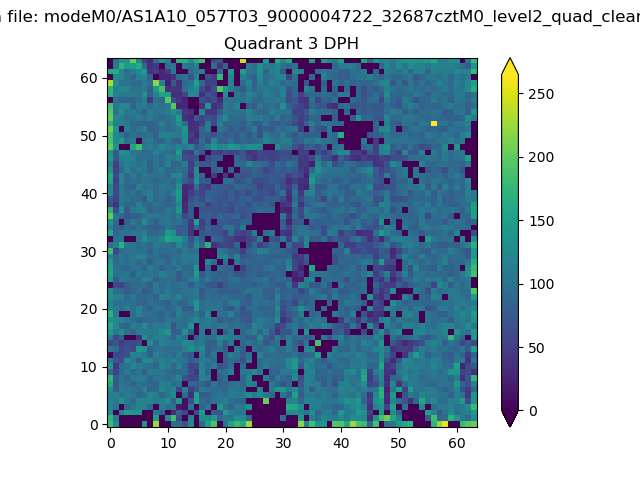 |
 |
Quadrant C |
| Plot type | Count rate plots | Images |
|---|---|---|
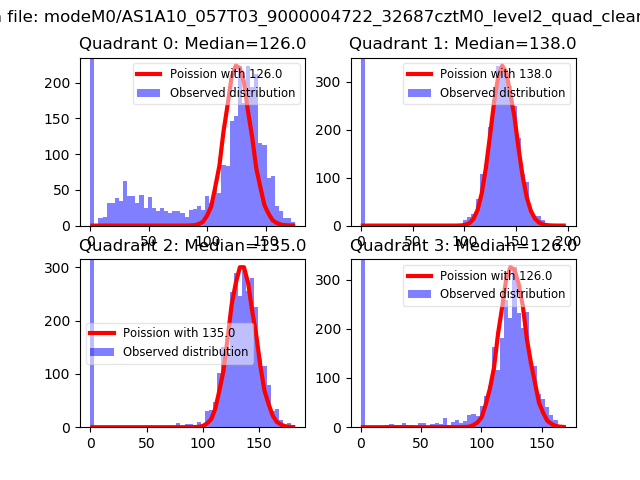
| Comparison with Poisson distribution Blue bars denote a histogram of data divided into 1 sec bins. Red curve is a Poisson curve with rate = median count rate of data. |
 |
 |
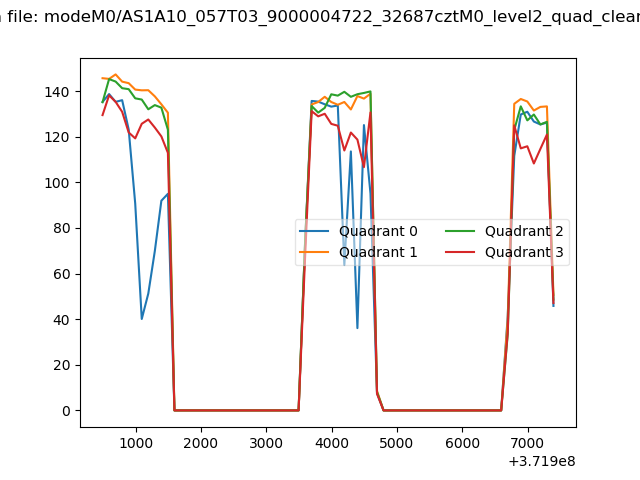
| Quadrant-wise count rates Data is divided into 100 sec bins |
 |
|
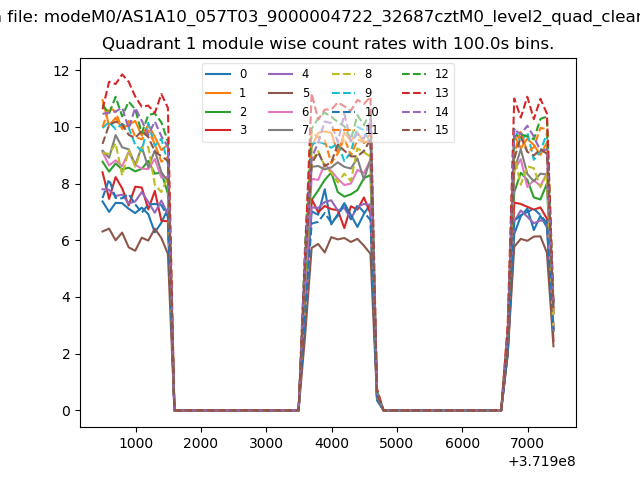
| Module-wise count rates for Quadrant A Data is divided into 100 sec bins |
 |
 |
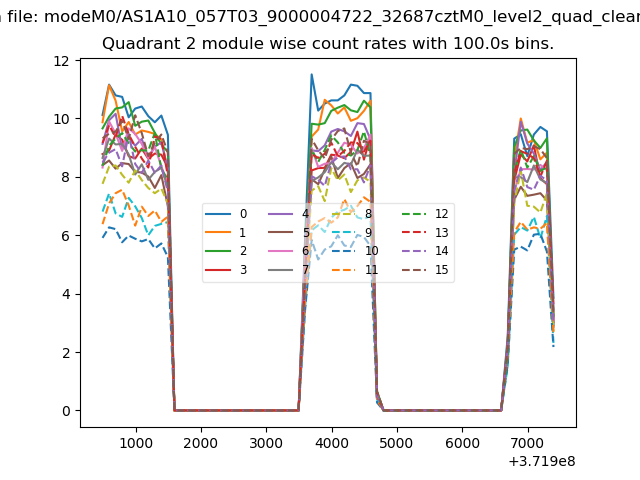
| Module-wise count rates for Quadrant B Data is divided into 100 sec bins |
 |
 |
| Module-wise count rates for Quadrant C Data is divided into 100 sec bins |
 |
 |
| Module-wise count rates for Quadrant D Data is divided into 100 sec bins |
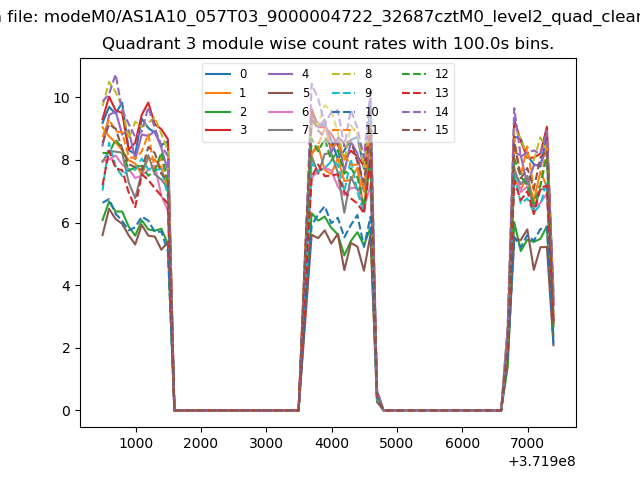 |
 |
| Parameter | Plot |
|---|---|
| CZT HV Monitor |  |
| D_VDD | 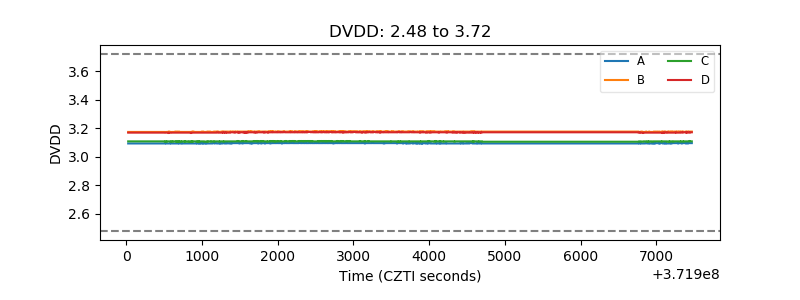 |
| Temperature 1 | 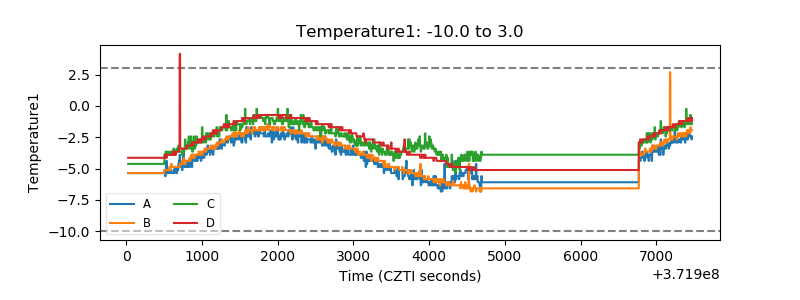 |
| Veto HV Monitor | 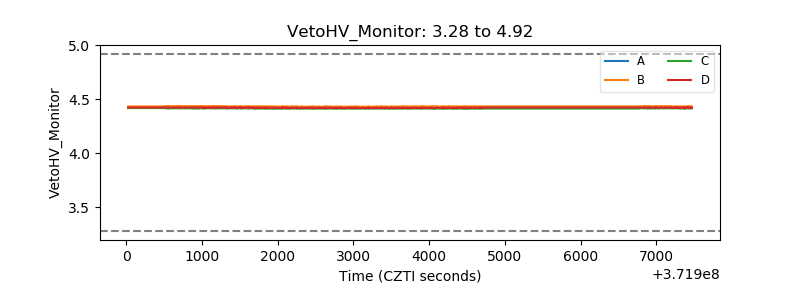 |
| Veto LLD | 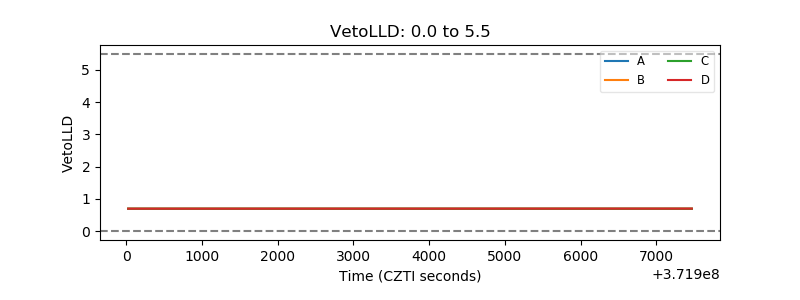 |
| Alpha Counter | 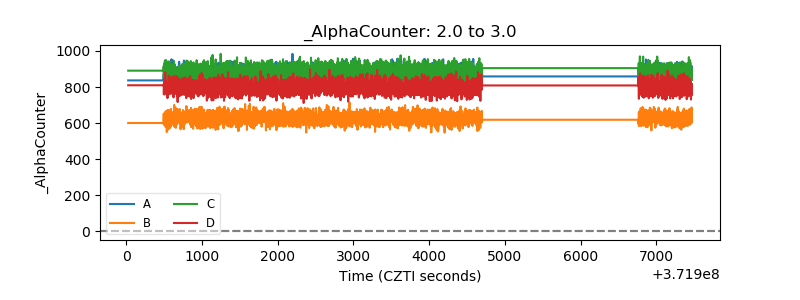 |
| _CPM_Rate | 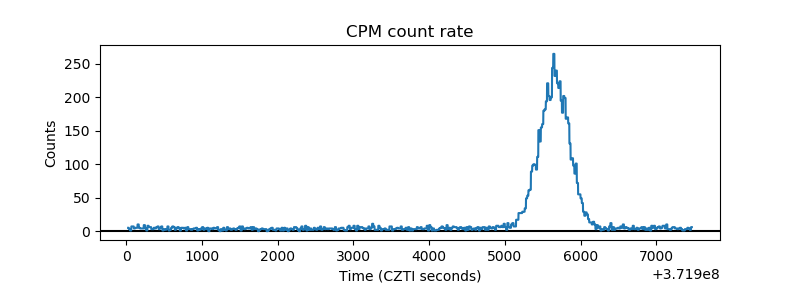 |
| CZT Counter | 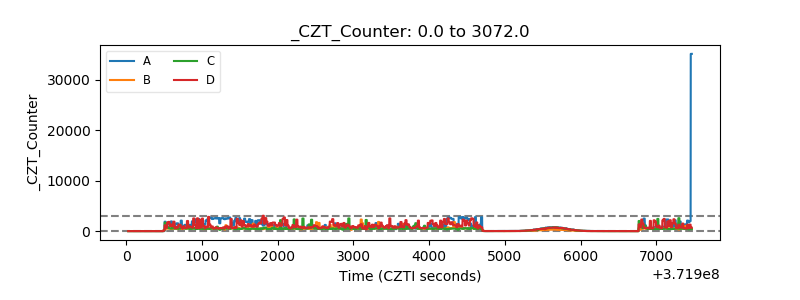 |
| +2.5 Volts monitor | 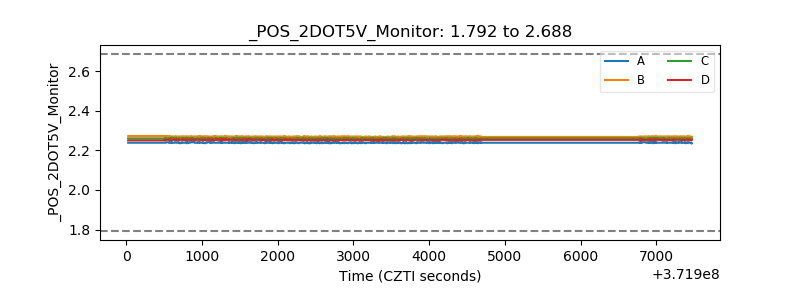 |
| +5 Volts monitor | 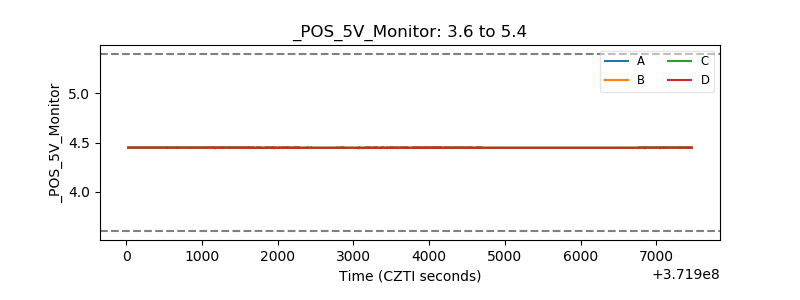 |
| _ROLL_ROT | 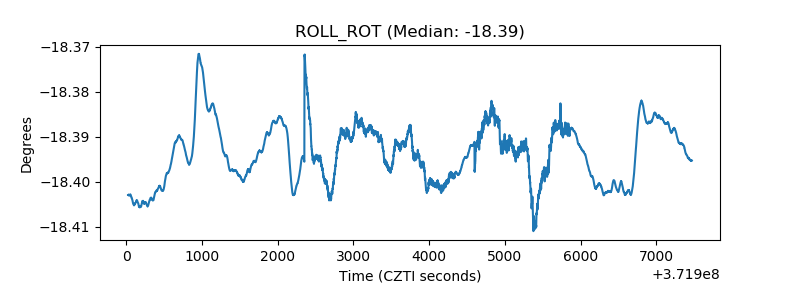 |
| _Roll_DEC | 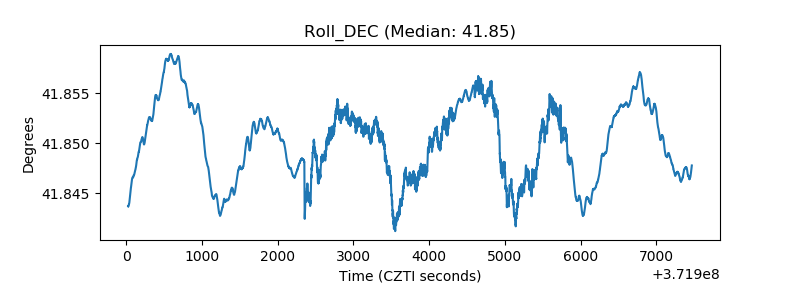 |
| _Roll_RA | 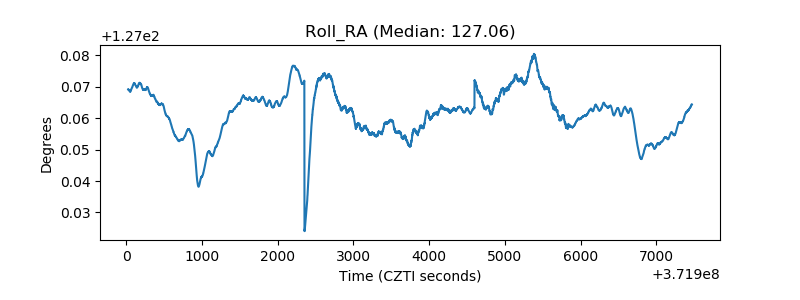 |
| Veto Counter | 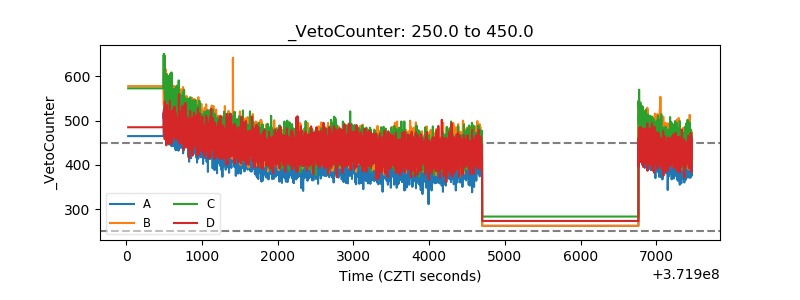 |