| Param | Original file | Final file |
|---|---|---|
| Filename | modeM0/AS1A10_057T03_9000004722_32688cztM0_level2.evt | modeM0/AS1A10_057T03_9000004722_32688cztM0_level2_quad_clean.evt |
| Size (bytes) | 535,086,720 | 56,661,120 |
| Size | 510.3 MB | 54.0 MB |
| Events in quadrant A | 4,422,653 | 340,513 |
| Events in quadrant B | 2,728,712 | 350,083 |
| Events in quadrant C | 3,243,715 | 340,966 |
| Events in quadrant D | 5,454,176 | 315,439 |
| Mode M0 | |||
|---|---|---|---|
| Quadrant | BADHDUFLAG | Total packets | Discarded packets |
| A | 0 | 16690 | 3 |
| B | 0 | 11252 | 2 |
| C | 0 | 13095 | 2 |
| D | 0 | 19948 | 2 |
| Mode M9 | |||
|---|---|---|---|
| Quadrant | BADHDUFLAG | Total packets | Discarded packets |
| A | 0 | 25 | 0 |
| B | 0 | 25 | 0 |
| C | 0 | 25 | 0 |
| D | 0 | 26 | 0 |
| Mode SS | |||
|---|---|---|---|
| Quadrant | BADHDUFLAG | Total packets | Discarded packets |
| A | 0 | 106 | 0 |
| B | 0 | 106 | 0 |
| C | 0 | 106 | 0 |
| D | 0 | 106 | 0 |
| Quadrant | Total seconds | Saturated seconds | Saturation percentage |
|---|---|---|---|
| A | 5261 | 582 | 11.062536% |
| B | 5261 | 19 | 0.361148% |
| C | 5261 | 79 | 1.501616% |
| D | 5261 | 577 | 10.967497% |
Noise dominated data is calculated using 1-second bins in cleaned event files. If a bin has >2000 counts, and if more than 50% of those come from <1% of pixels, then it is considered to be noise-dominated and hence unusable.
| Quadrant | # 1 sec bins | Bins with >0 counts | Bins with >2000 counts | High rate bins dominated by noise | Noise dominated (total time) | Noise dominated (detector-on time) | Marked lightcurve |
|---|---|---|---|---|---|---|---|
| A | 7053 | 5262 | 171 | 171 | 2.42% | 3.25% | 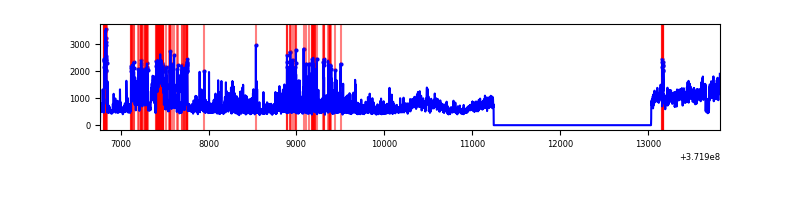 |
| B | 7053 | 5262 | 8 | 8 | 0.11% | 0.15% | 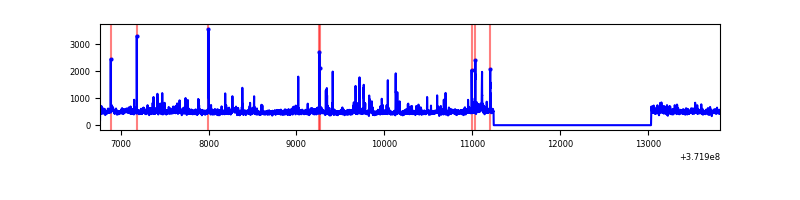 |
| C | 7053 | 5262 | 69 | 69 | 0.98% | 1.31% | 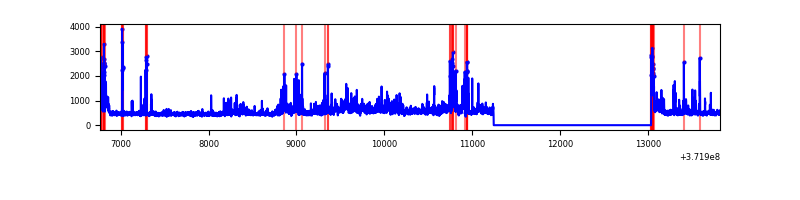 |
| D | 7053 | 5262 | 466 | 466 | 6.61% | 8.86% | 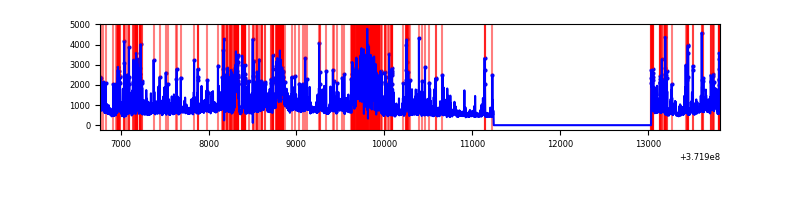 |
Top three noisy pixels from each quadrant. If the there are fewer than three noisy pixels in the level2.evt file, extra rows are filled as -1
| Pixel properties | Quadrant properties | ||||||
|---|---|---|---|---|---|---|---|
| Quadrant | DetID | PixID | Counts | Sigma | Mean | Median | Sigma |
| A | 15 | 249 | 1270924 | 10441.71 | 611 | 599 | 121.7 |
| A | 0 | 253 | 710639 | 5836.33 | 611 | 599 | 121.7 |
| A | 15 | 174 | 25993 | 208.73 | 611 | 599 | 121.7 |
| B | 0 | 219 | 65373 | 541.56 | 629 | 615 | 119.6 |
| B | 3 | 26 | 43938 | 362.3 | 629 | 615 | 119.6 |
| B | 0 | 189 | 37242 | 306.31 | 629 | 615 | 119.6 |
| C | 3 | 233 | 312473 | 2222.95 | 602 | 604 | 140.3 |
| C | 0 | 10 | 311536 | 2216.27 | 602 | 604 | 140.3 |
| C | 9 | 236 | 160719 | 1141.27 | 602 | 604 | 140.3 |
| D | 7 | 80 | 670801 | 4861.52 | 581 | 568 | 137.9 |
| D | 8 | 195 | 607901 | 4405.28 | 581 | 568 | 137.9 |
| D | 2 | 250 | 385091 | 2789.13 | 581 | 568 | 137.9 |
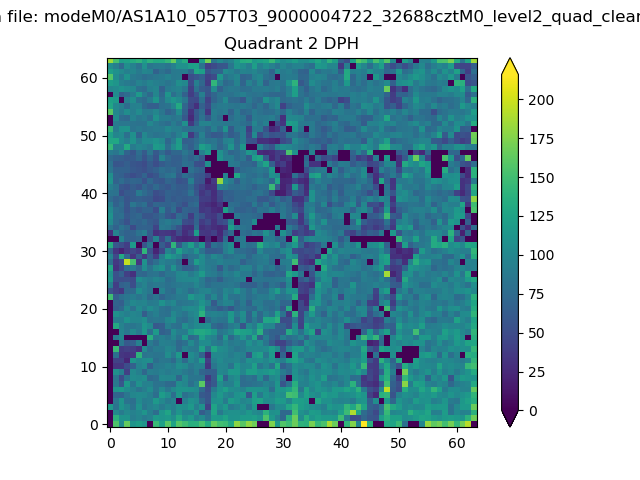
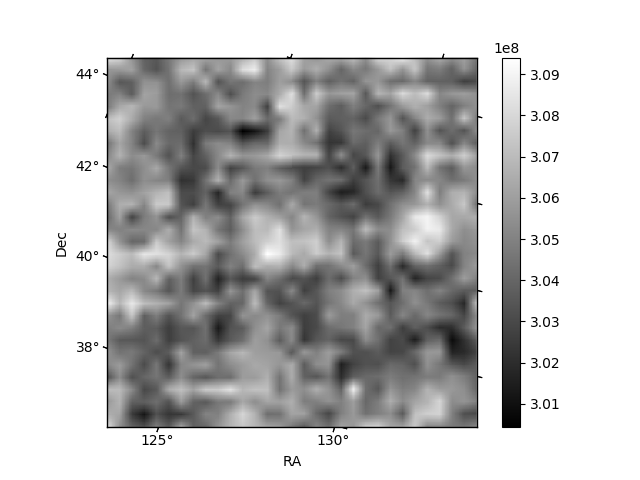
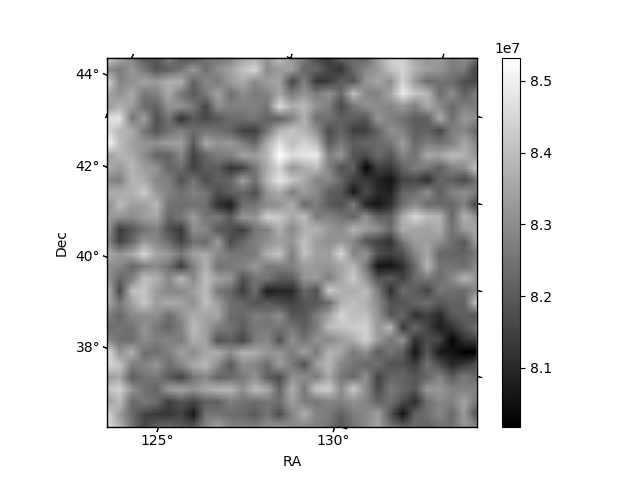
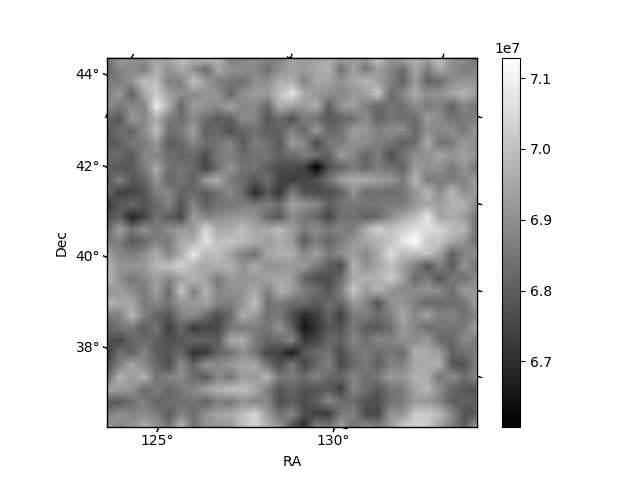
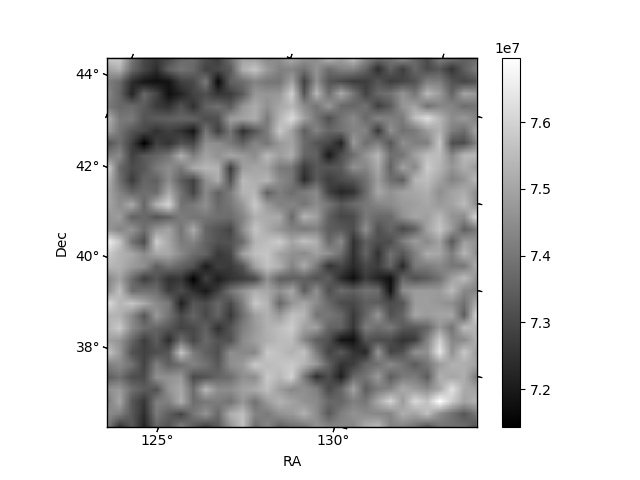
Histogram calculated using DETX and DETY for each event in the final _common_clean file
| Quadrant A | 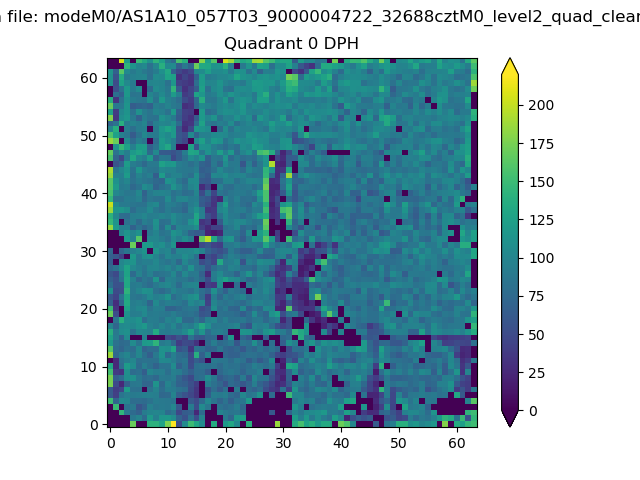 |
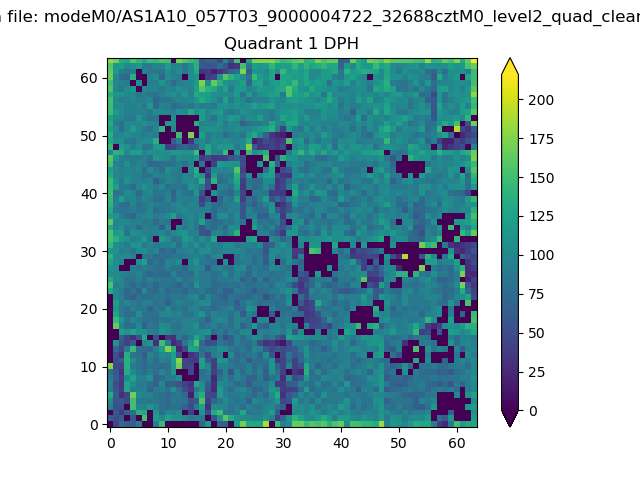 |
Quadrant B |
|---|---|---|---|
| Quadrant D | 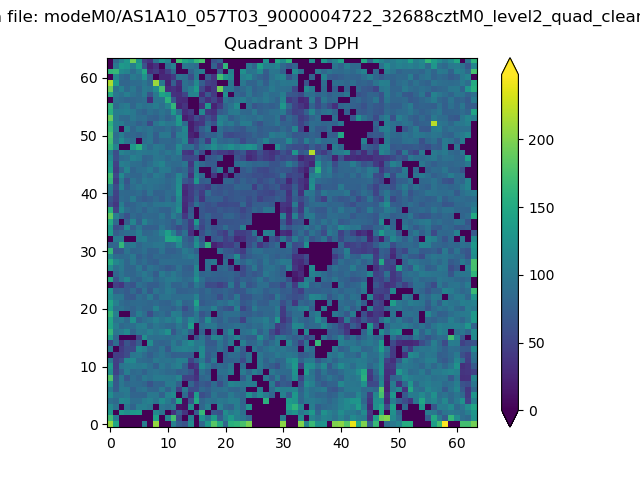 |
 |
Quadrant C |
| Plot type | Count rate plots | Images |
|---|---|---|
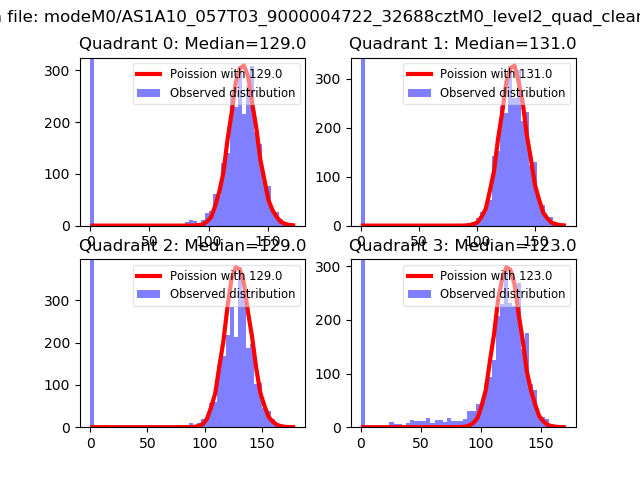
| Comparison with Poisson distribution Blue bars denote a histogram of data divided into 1 sec bins. Red curve is a Poisson curve with rate = median count rate of data. |
 |
 |
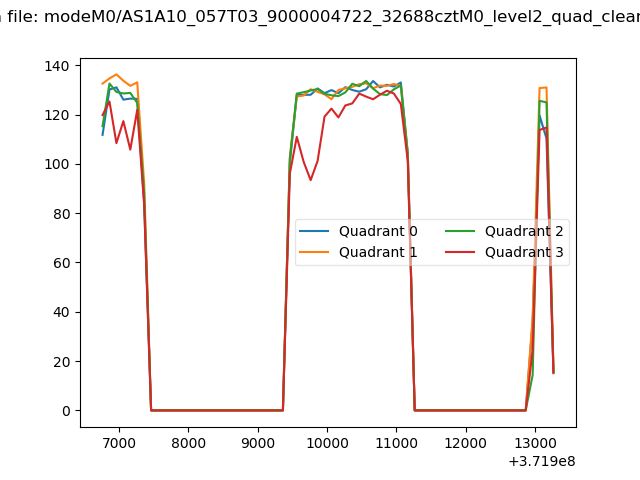
| Quadrant-wise count rates Data is divided into 100 sec bins |
 |
|
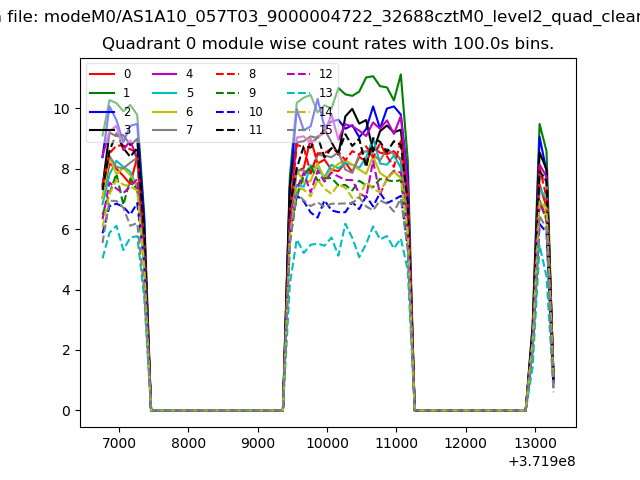
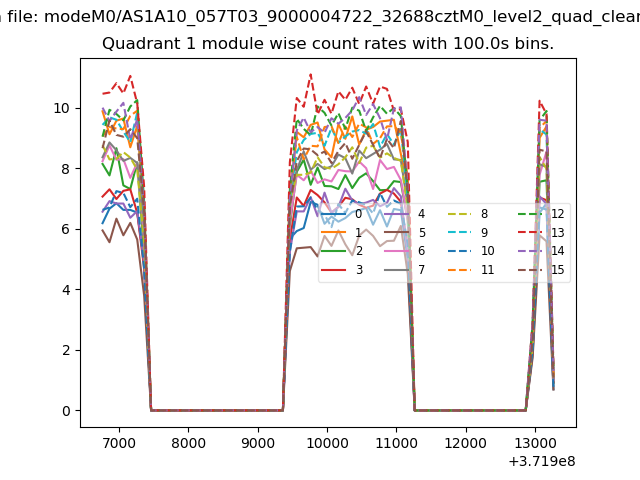
| Module-wise count rates for Quadrant A Data is divided into 100 sec bins |
 |
 |
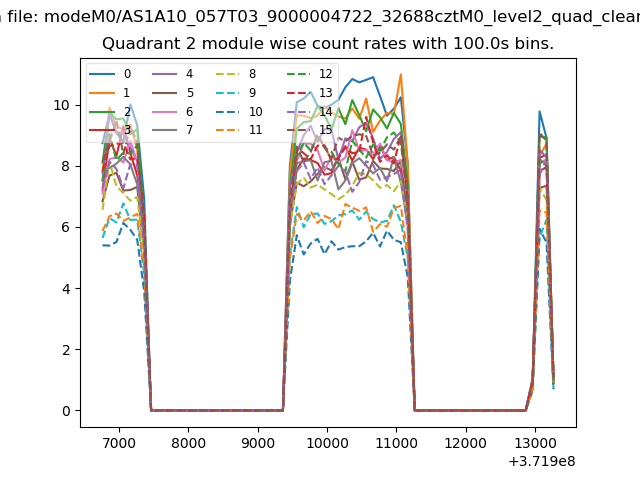
| Module-wise count rates for Quadrant B Data is divided into 100 sec bins |
 |
 |
| Module-wise count rates for Quadrant C Data is divided into 100 sec bins |
 |
 |
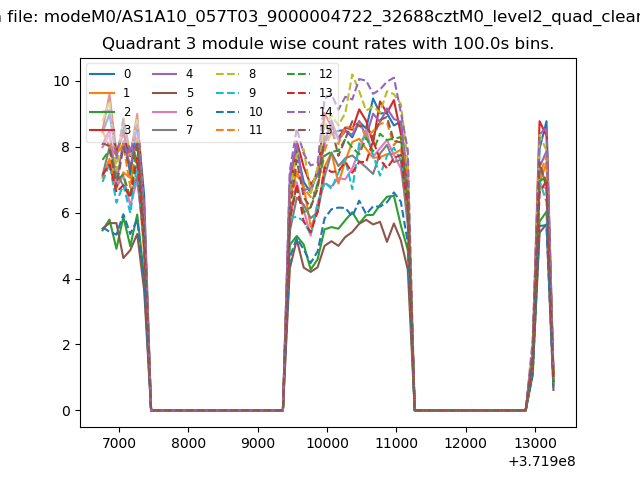
| Module-wise count rates for Quadrant D Data is divided into 100 sec bins |
 |
 |
| Parameter | Plot |
|---|---|
| CZT HV Monitor | 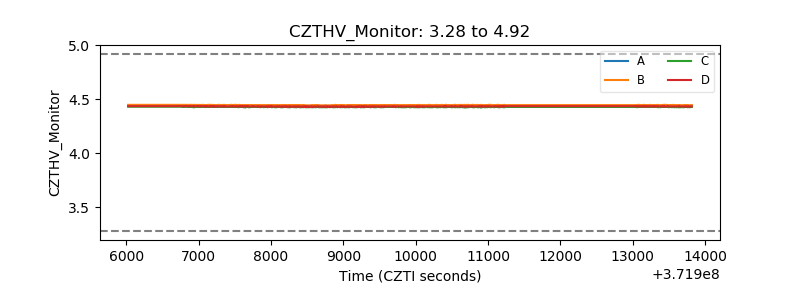 |
| D_VDD | 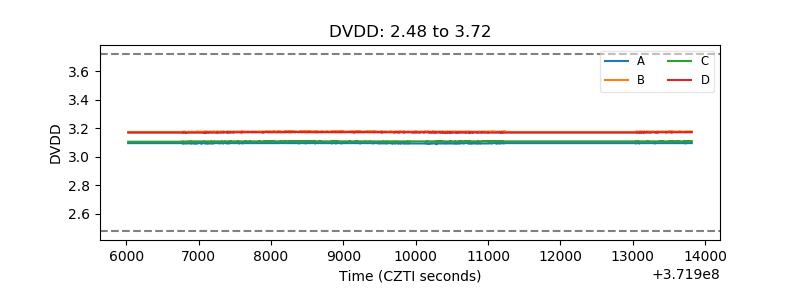 |
| Temperature 1 | 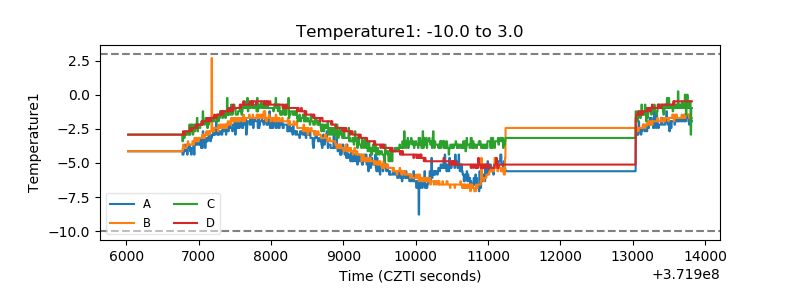 |
| Veto HV Monitor | 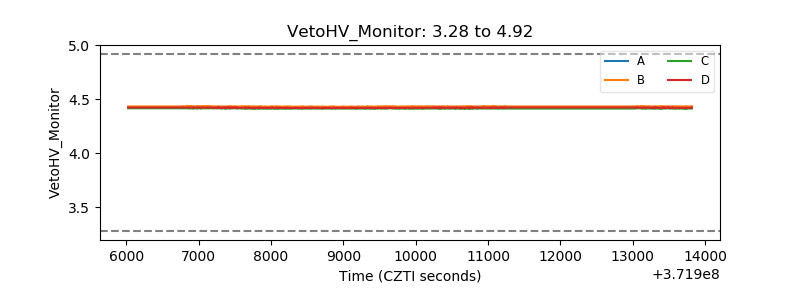 |
| Veto LLD | 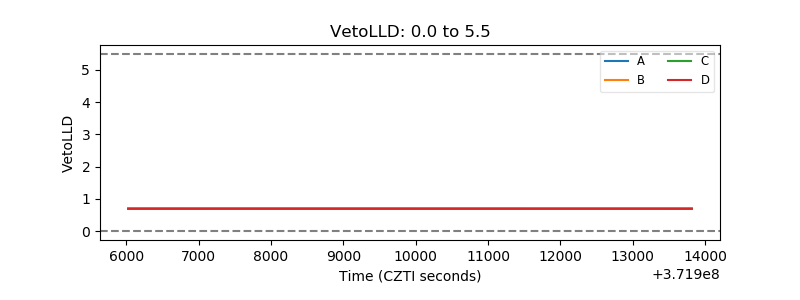 |
| Alpha Counter | 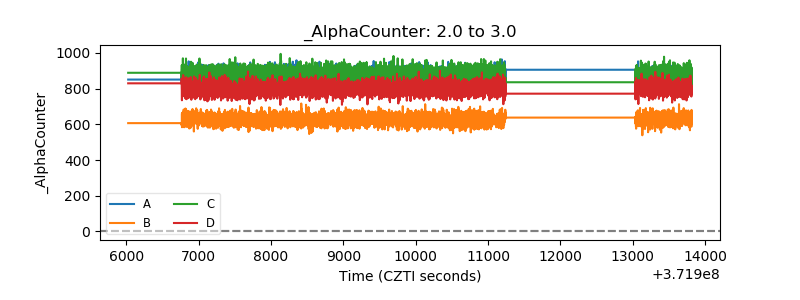 |
| _CPM_Rate | 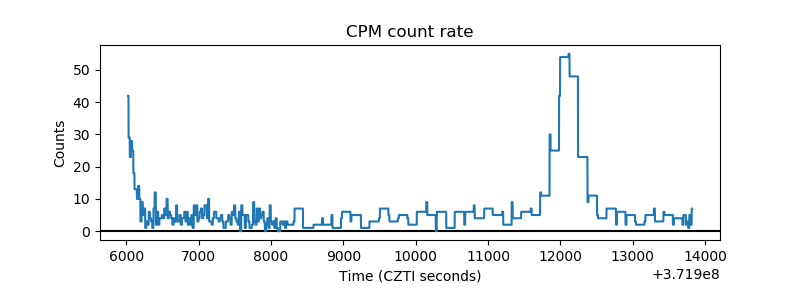 |
| CZT Counter | 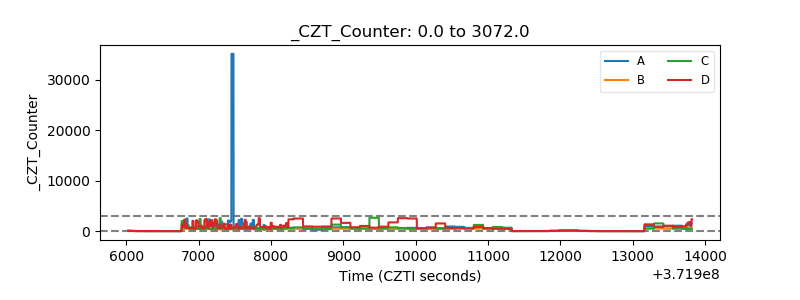 |
| +2.5 Volts monitor |  |
| +5 Volts monitor |  |
| _ROLL_ROT | 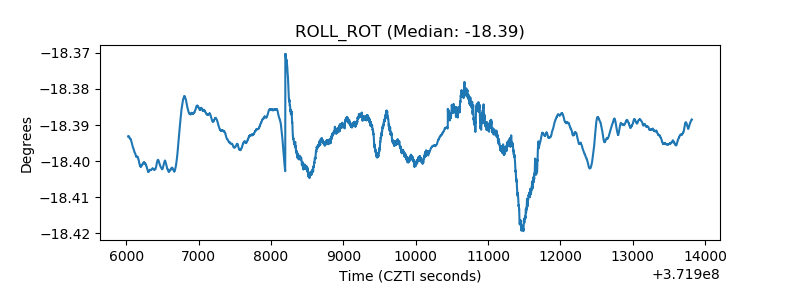 |
| _Roll_DEC | 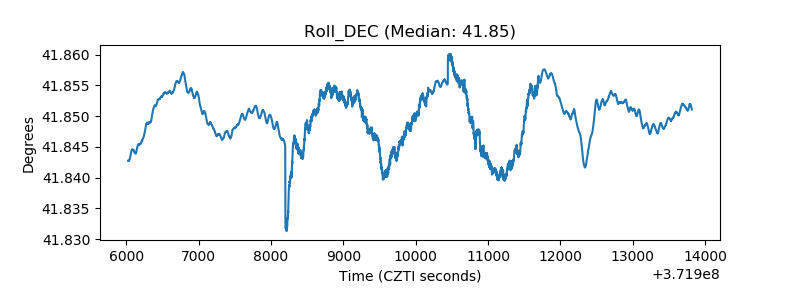 |
| _Roll_RA | 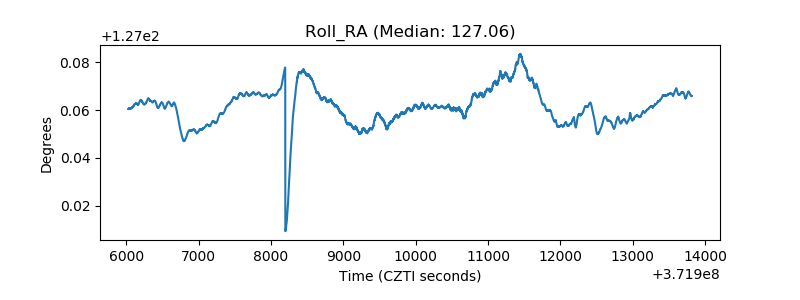 |
| Veto Counter | 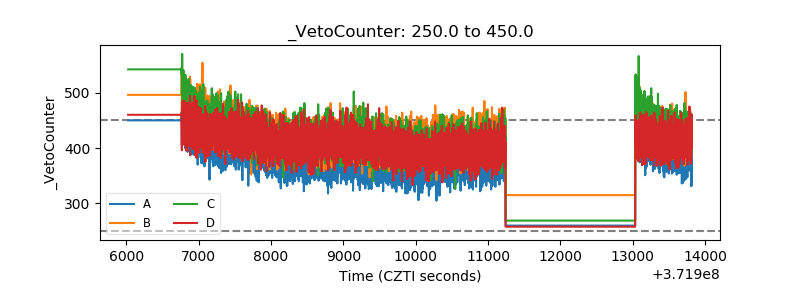 |