| Param | Original file | Final file |
|---|---|---|
| Filename | modeM0/AS1A10_057T03_9000004722_32689cztM0_level2.evt | modeM0/AS1A10_057T03_9000004722_32689cztM0_level2_quad_clean.evt |
| Size (bytes) | 322,041,600 | 27,878,400 |
| Size | 307.1 MB | 26.6 MB |
| Events in quadrant A | 2,659,969 | 153,378 |
| Events in quadrant B | 1,696,657 | 156,754 |
| Events in quadrant C | 1,901,278 | 154,665 |
| Events in quadrant D | 3,270,198 | 144,427 |
| Mode M0 | |||
|---|---|---|---|
| Quadrant | BADHDUFLAG | Total packets | Discarded packets |
| A | 0 | 10113 | 1 |
| B | 0 | 7081 | 1 |
| C | 0 | 7744 | 1 |
| D | 0 | 12069 | 1 |
| Mode M9 | |||
|---|---|---|---|
| Quadrant | BADHDUFLAG | Total packets | Discarded packets |
| A | 0 | 8 | 0 |
| B | 0 | 8 | 0 |
| C | 0 | 8 | 0 |
| D | 0 | 9 | 0 |
| Mode SS | |||
|---|---|---|---|
| Quadrant | BADHDUFLAG | Total packets | Discarded packets |
| A | 0 | 66 | 0 |
| B | 0 | 66 | 0 |
| C | 0 | 66 | 0 |
| D | 0 | 66 | 0 |
| Quadrant | Total seconds | Saturated seconds | Saturation percentage |
|---|---|---|---|
| A | 3298 | 425 | 12.886598% |
| B | 3298 | 17 | 0.515464% |
| C | 3298 | 38 | 1.152213% |
| D | 3298 | 292 | 8.853851% |
Noise dominated data is calculated using 1-second bins in cleaned event files. If a bin has >2000 counts, and if more than 50% of those come from <1% of pixels, then it is considered to be noise-dominated and hence unusable.
| Quadrant | # 1 sec bins | Bins with >0 counts | Bins with >2000 counts | High rate bins dominated by noise | Noise dominated (total time) | Noise dominated (detector-on time) | Marked lightcurve |
|---|---|---|---|---|---|---|---|
| A | 3298 | 3298 | 13 | 13 | 0.39% | 0.39% | 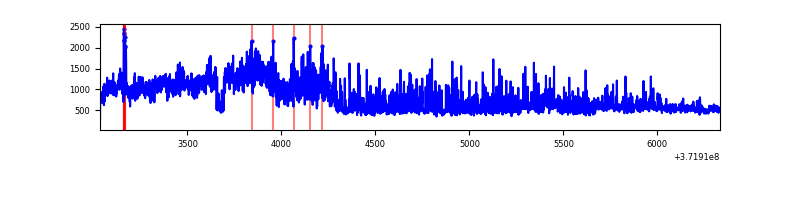 |
| B | 3298 | 3298 | 12 | 12 | 0.36% | 0.36% | 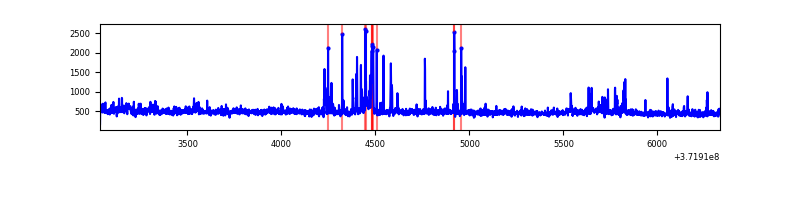 |
| C | 3298 | 3298 | 30 | 30 | 0.91% | 0.91% | 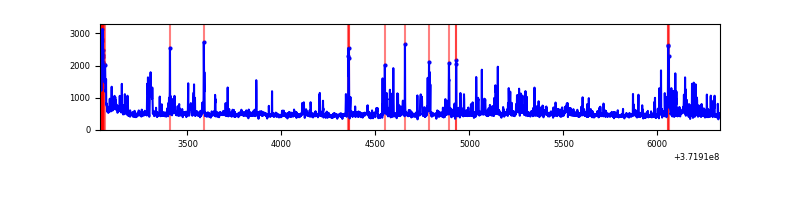 |
| D | 3298 | 3298 | 222 | 222 | 6.73% | 6.73% | 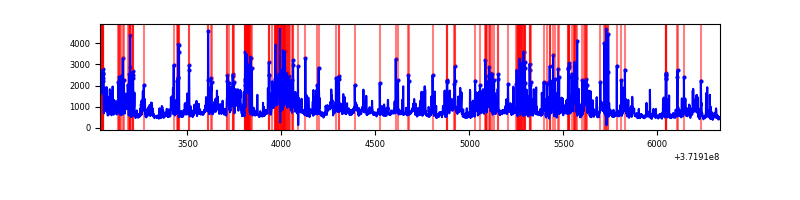 |
Top three noisy pixels from each quadrant. If the there are fewer than three noisy pixels in the level2.evt file, extra rows are filled as -1
| Pixel properties | Quadrant properties | ||||||
|---|---|---|---|---|---|---|---|
| Quadrant | DetID | PixID | Counts | Sigma | Mean | Median | Sigma |
| A | 0 | 253 | 764262 | 10027.09 | 374 | 367 | 76.2 |
| A | 15 | 249 | 397395 | 5211.49 | 374 | 367 | 76.2 |
| A | 15 | 174 | 25055 | 324.06 | 374 | 367 | 76.2 |
| B | 3 | 26 | 106339 | 1430.39 | 385 | 377 | 74.1 |
| B | 0 | 219 | 21364 | 283.3 | 385 | 377 | 74.1 |
| B | 12 | 1 | 18191 | 240.47 | 385 | 377 | 74.1 |
| C | 0 | 10 | 220874 | 2538.62 | 372 | 374 | 86.9 |
| C | 9 | 236 | 97702 | 1120.54 | 372 | 374 | 86.9 |
| C | 3 | 233 | 72116 | 825.97 | 372 | 374 | 86.9 |
| D | 8 | 195 | 397795 | 4563.27 | 360 | 352 | 87.1 |
| D | 2 | 250 | 256559 | 2941.66 | 360 | 352 | 87.1 |
| D | 12 | 233 | 254677 | 2920.05 | 360 | 352 | 87.1 |
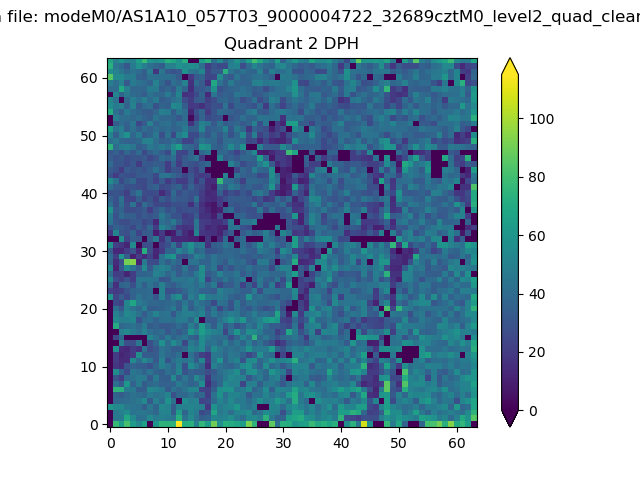
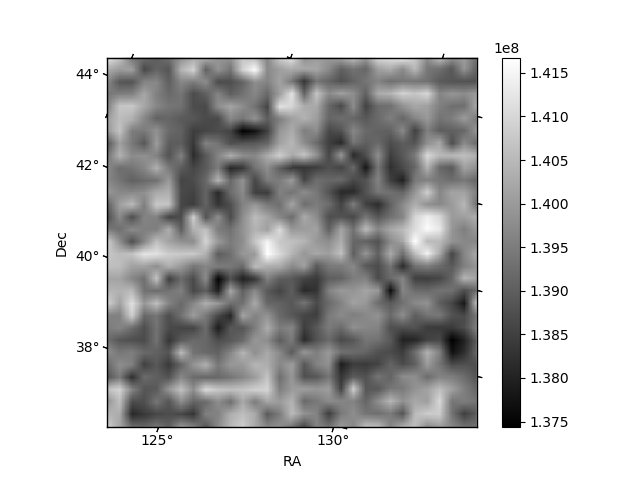
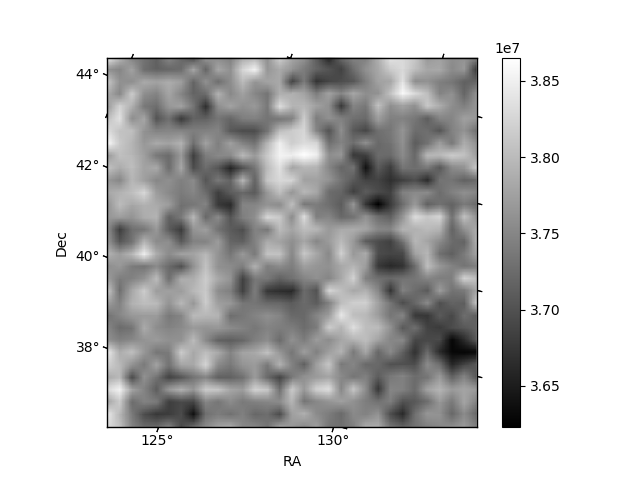
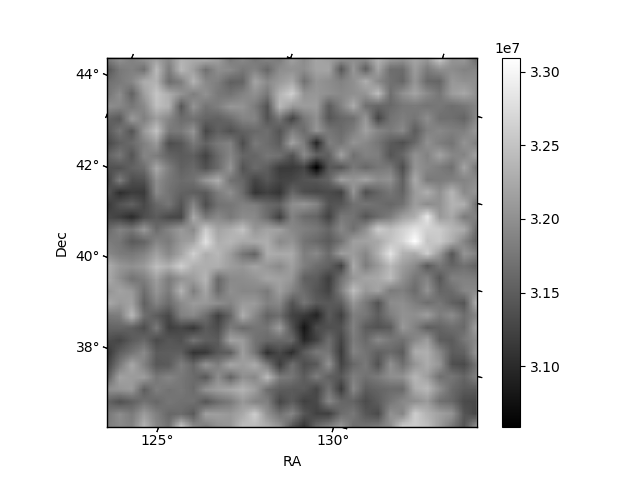
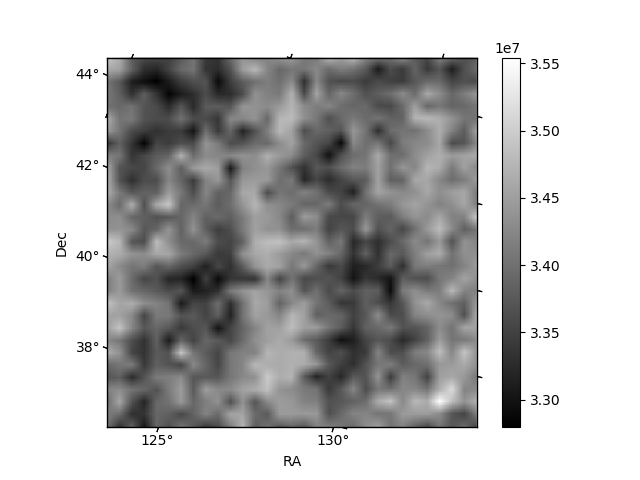
Histogram calculated using DETX and DETY for each event in the final _common_clean file
| Quadrant A | 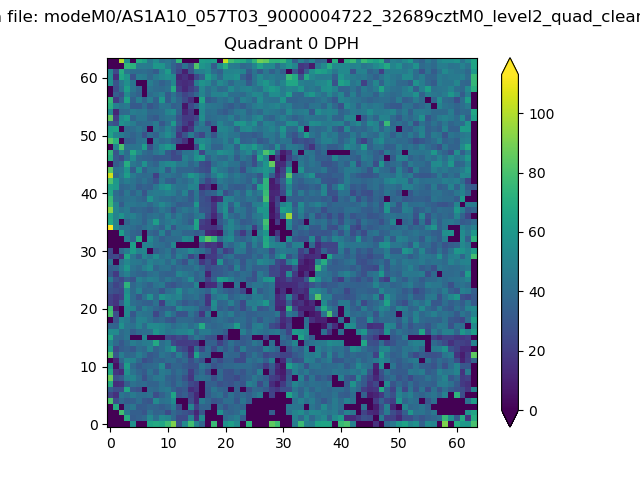 |
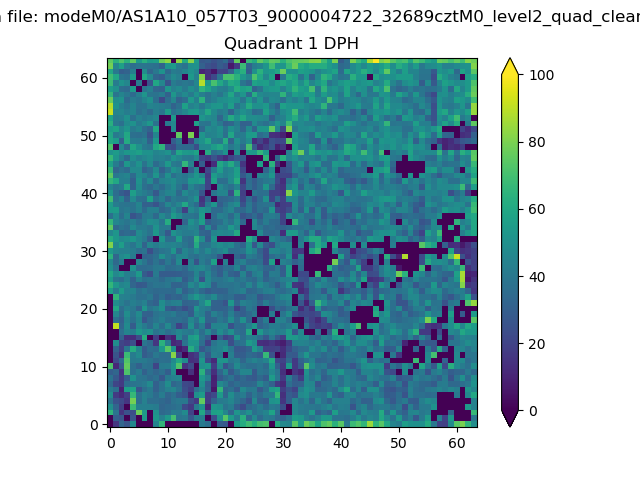 |
Quadrant B |
|---|---|---|---|
| Quadrant D | 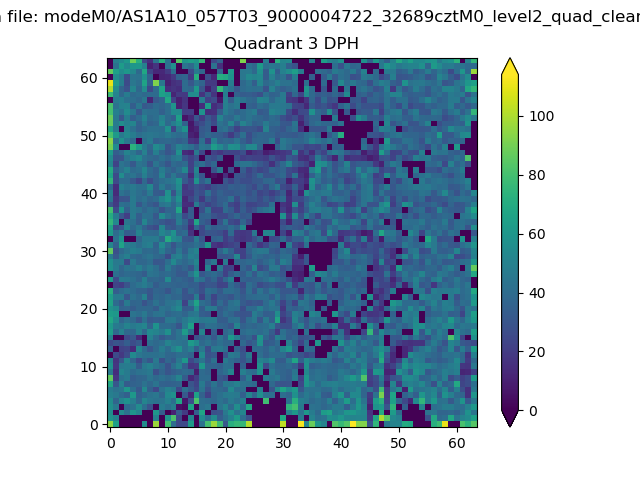 |
 |
Quadrant C |
| Plot type | Count rate plots | Images |
|---|---|---|
| Comparison with Poisson distribution Blue bars denote a histogram of data divided into 1 sec bins. Red curve is a Poisson curve with rate = median count rate of data. |
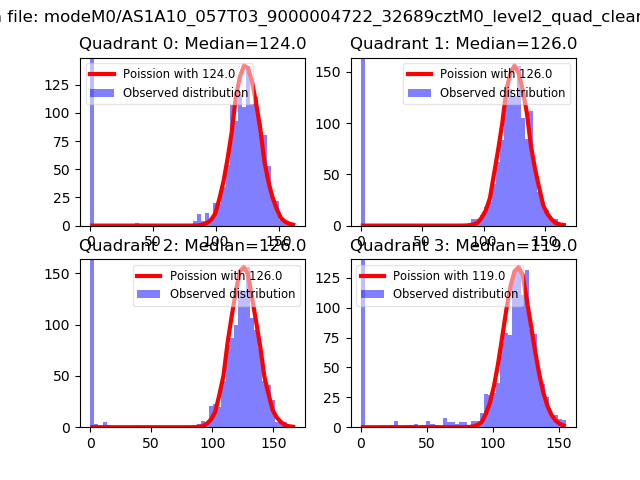 |
 |
| Quadrant-wise count rates Data is divided into 100 sec bins |
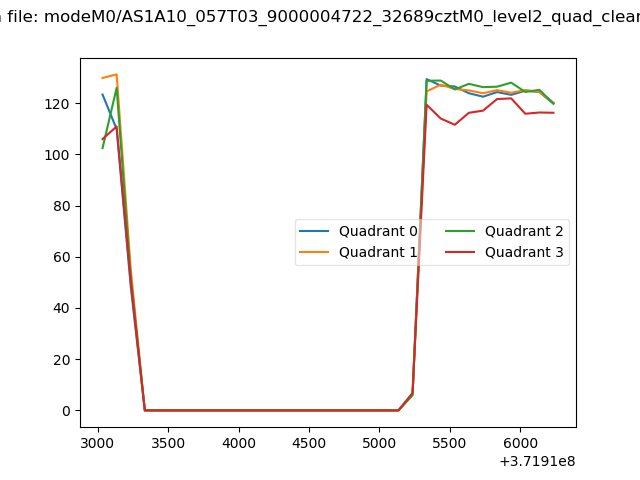 |
|
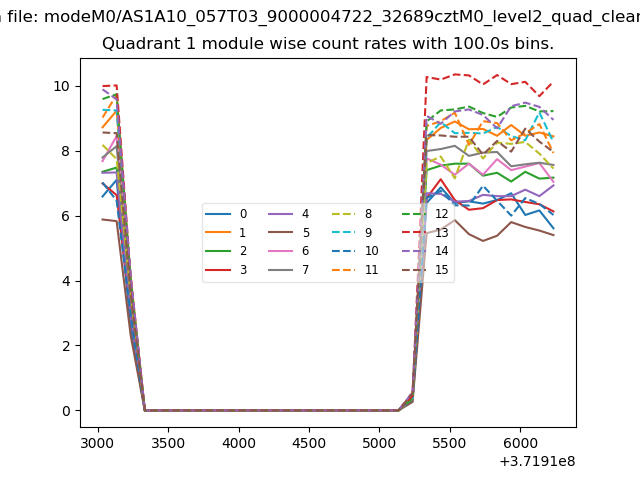
| Module-wise count rates for Quadrant A Data is divided into 100 sec bins |
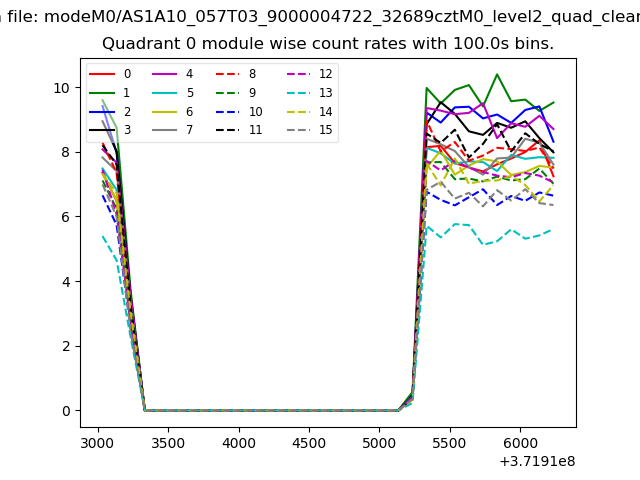 |
 |
| Module-wise count rates for Quadrant B Data is divided into 100 sec bins |
 |
 |
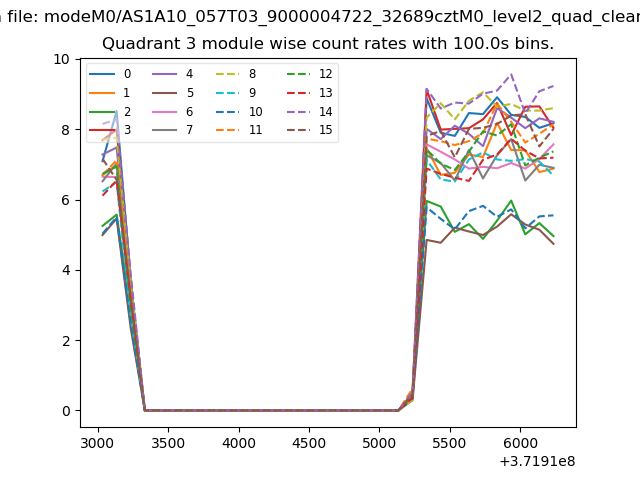
| Module-wise count rates for Quadrant C Data is divided into 100 sec bins |
 |
 |
| Module-wise count rates for Quadrant D Data is divided into 100 sec bins |
 |
 |
| Parameter | Plot |
|---|---|
| CZT HV Monitor | 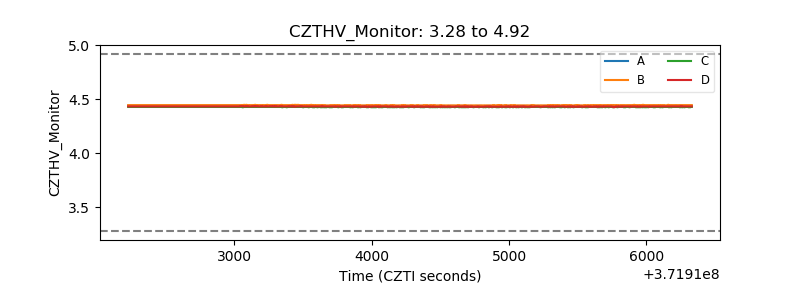 |
| D_VDD | 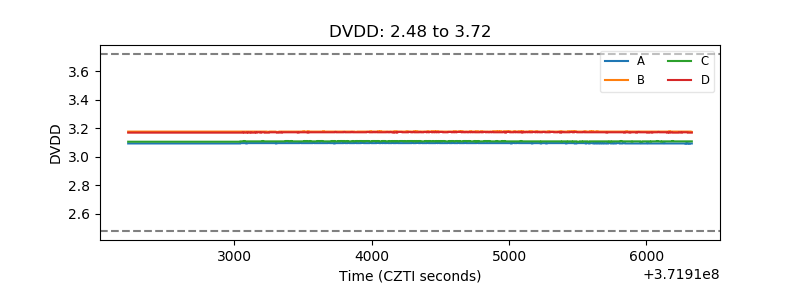 |
| Temperature 1 |  |
| Veto HV Monitor | 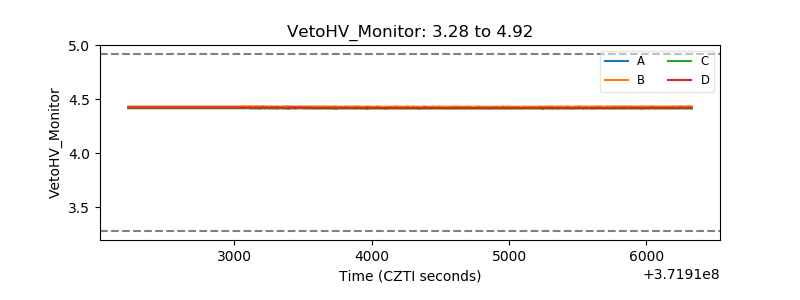 |
| Veto LLD | 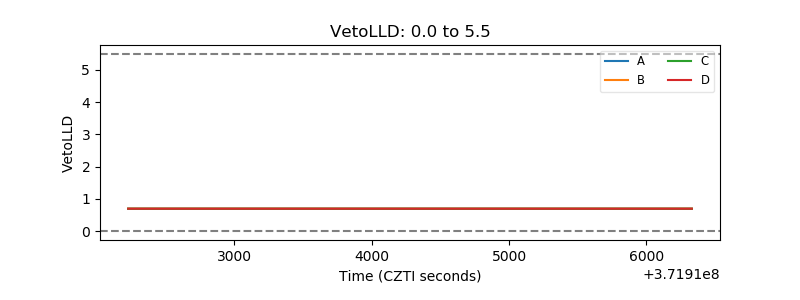 |
| Alpha Counter | 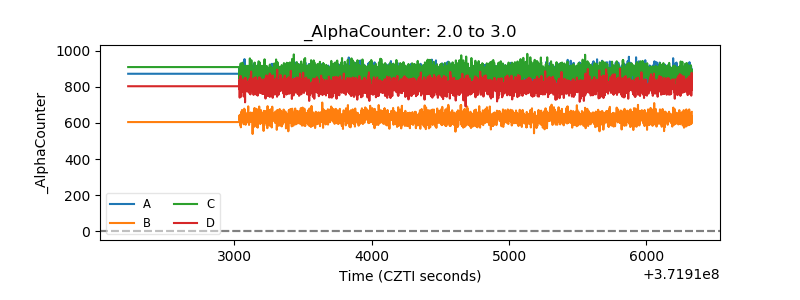 |
| _CPM_Rate | 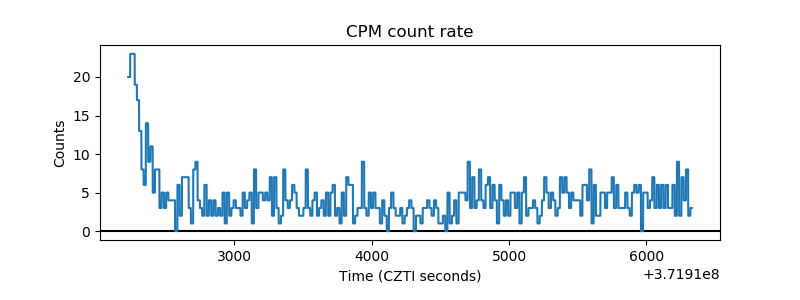 |
| CZT Counter | 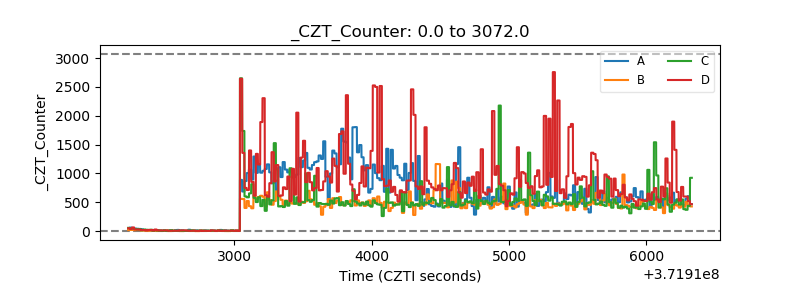 |
| +2.5 Volts monitor |  |
| +5 Volts monitor | 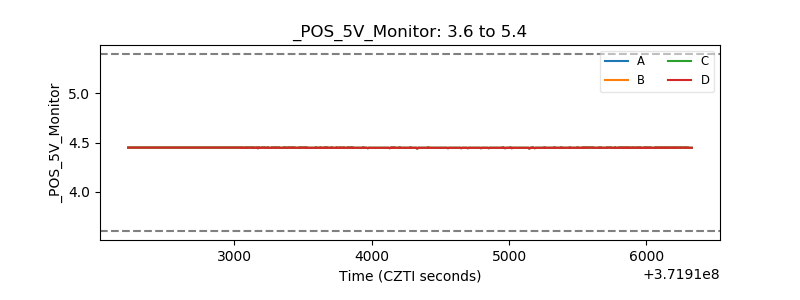 |
| _ROLL_ROT |  |
| _Roll_DEC | 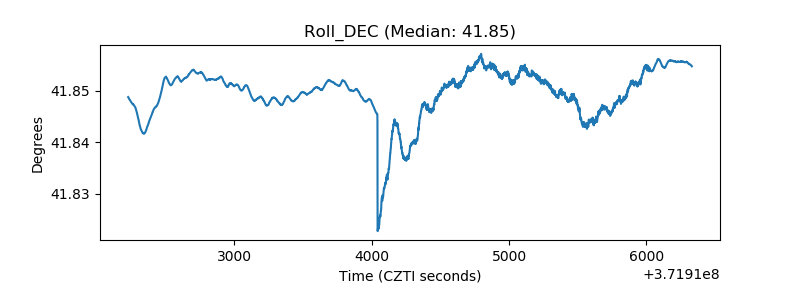 |
| _Roll_RA | 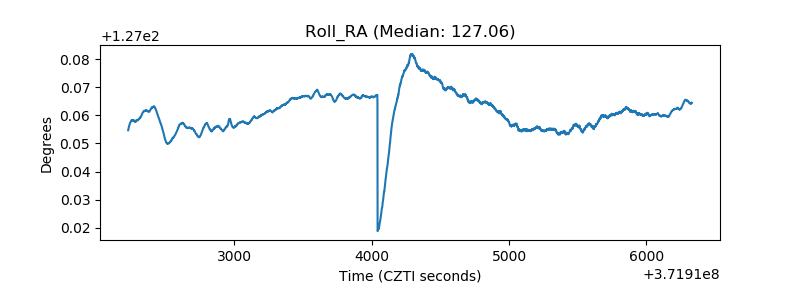 |
| Veto Counter |  |