| Param | Original file | Final file |
|---|---|---|
| Filename | modeM0/AS1T04_063T01_9000004724_32689cztM0_level2.evt | modeM0/AS1T04_063T01_9000004724_32689cztM0_level2_quad_clean.evt |
| Size (bytes) | 152,593,920 | 20,217,600 |
| Size | 145.5 MB | 19.3 MB |
| Events in quadrant A | 931,861 | 130,196 |
| Events in quadrant B | 868,631 | 133,442 |
| Events in quadrant C | 877,021 | 128,416 |
| Events in quadrant D | 1,841,025 | 109,947 |
| Mode SS | |||
|---|---|---|---|
| Quadrant | BADHDUFLAG | Total packets | Discarded packets |
| A | 0 | 32 | 0 |
| B | 0 | 32 | 0 |
| C | 0 | 32 | 0 |
| D | 0 | 32 | 0 |
| Mode M9 | |||
|---|---|---|---|
| Quadrant | BADHDUFLAG | Total packets | Discarded packets |
| A | 0 | 14 | 0 |
| B | 0 | 14 | 0 |
| C | 0 | 14 | 0 |
| D | 0 | 14 | 0 |
| Mode M0 | |||
|---|---|---|---|
| Quadrant | BADHDUFLAG | Total packets | Discarded packets |
| A | 0 | 3790 | 2 |
| B | 0 | 3516 | 1 |
| C | 0 | 3494 | 1 |
| D | 0 | 6515 | 1 |
| Quadrant | Total seconds | Saturated seconds | Saturation percentage |
|---|---|---|---|
| A | 1475 | 13 | 0.881356% |
| B | 1475 | 14 | 0.949153% |
| C | 1475 | 38 | 2.576271% |
| D | 1475 | 306 | 20.745763% |
Noise dominated data is calculated using 1-second bins in cleaned event files. If a bin has >2000 counts, and if more than 50% of those come from <1% of pixels, then it is considered to be noise-dominated and hence unusable.
| Quadrant | # 1 sec bins | Bins with >0 counts | Bins with >2000 counts | High rate bins dominated by noise | Noise dominated (total time) | Noise dominated (detector-on time) | Marked lightcurve |
|---|---|---|---|---|---|---|---|
| A | 2908 | 1476 | 3 | 3 | 0.10% | 0.20% | 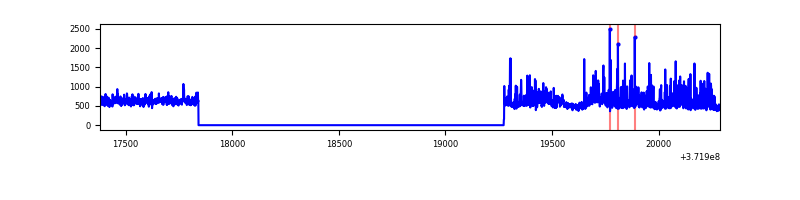 |
| B | 2908 | 1476 | 0 | 0 | 0.00% | 0.00% | 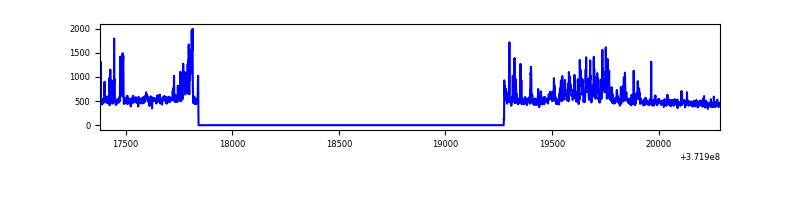 |
| C | 2908 | 1476 | 29 | 29 | 1.00% | 1.96% | 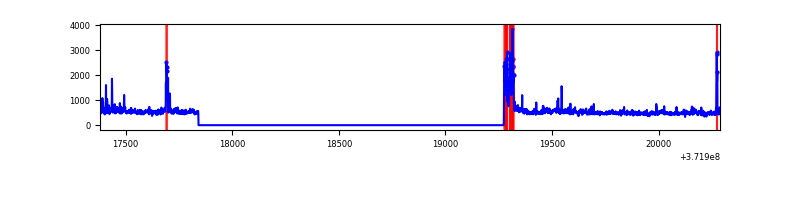 |
| D | 2908 | 1476 | 260 | 260 | 8.94% | 17.62% | 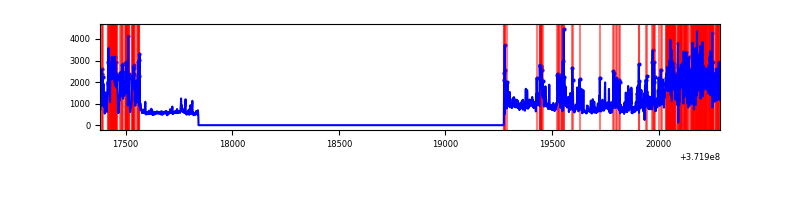 |
Top three noisy pixels from each quadrant. If the there are fewer than three noisy pixels in the level2.evt file, extra rows are filled as -1
| Pixel properties | Quadrant properties | ||||||
|---|---|---|---|---|---|---|---|
| Quadrant | DetID | PixID | Counts | Sigma | Mean | Median | Sigma |
| A | 15 | 249 | 186530 | 4881.67 | 181 | 177 | 38.2 |
| A | 0 | 253 | 27414 | 713.5 | 181 | 177 | 38.2 |
| A | 13 | 6 | 4584 | 115.44 | 181 | 177 | 38.2 |
| B | 0 | 219 | 77884 | 2116.5 | 182 | 178 | 36.7 |
| B | 0 | 199 | 36780 | 996.94 | 182 | 178 | 36.7 |
| B | 0 | 197 | 18684 | 504.05 | 182 | 178 | 36.7 |
| C | 0 | 10 | 67697 | 1612.62 | 174 | 175 | 41.9 |
| C | 9 | 236 | 59719 | 1422.08 | 174 | 175 | 41.9 |
| C | 3 | 233 | 43846 | 1042.99 | 174 | 175 | 41.9 |
| D | 2 | 250 | 296531 | 7456.81 | 162 | 159 | 39.7 |
| D | 12 | 3 | 222657 | 5598.12 | 162 | 159 | 39.7 |
| D | 12 | 2 | 149393 | 3754.78 | 162 | 159 | 39.7 |
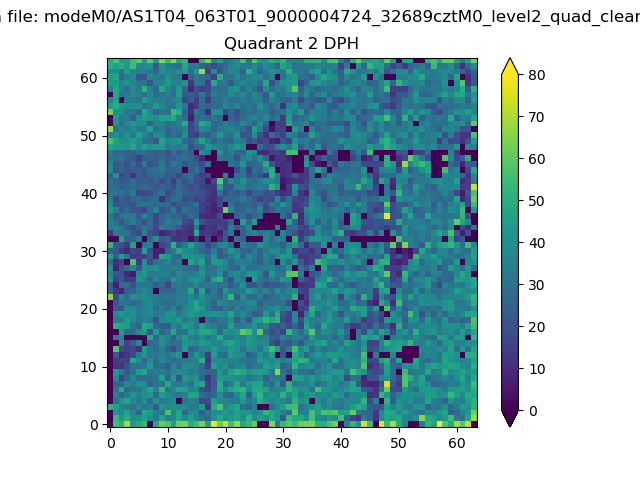
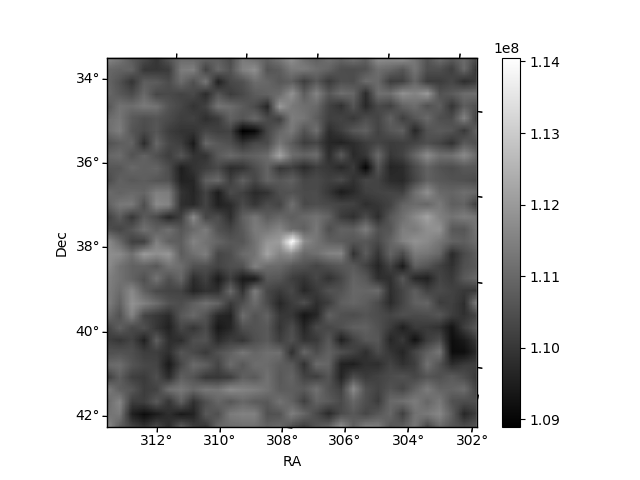
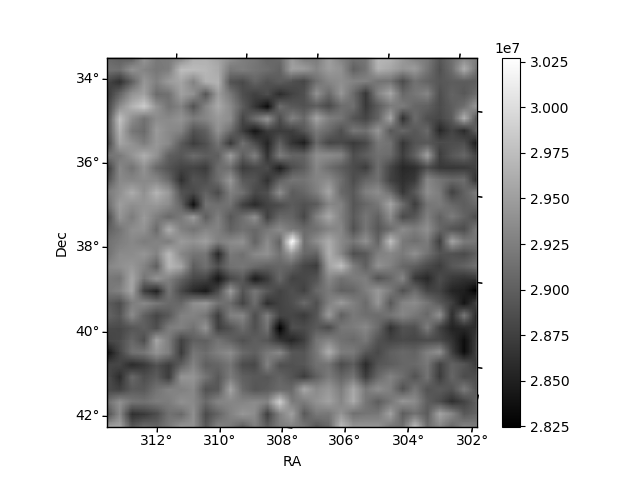
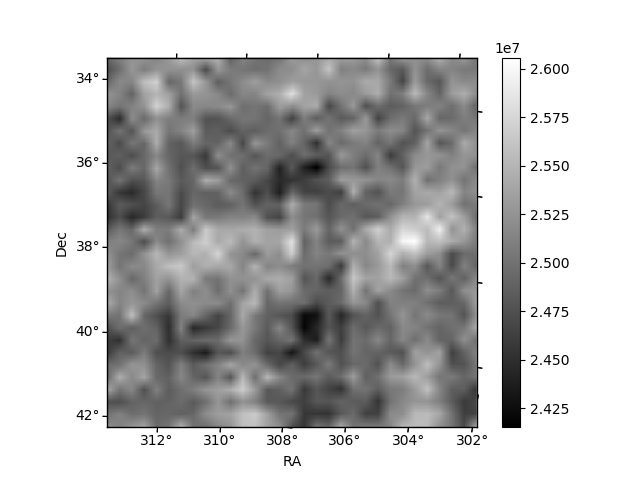
Histogram calculated using DETX and DETY for each event in the final _common_clean file
| Quadrant A | 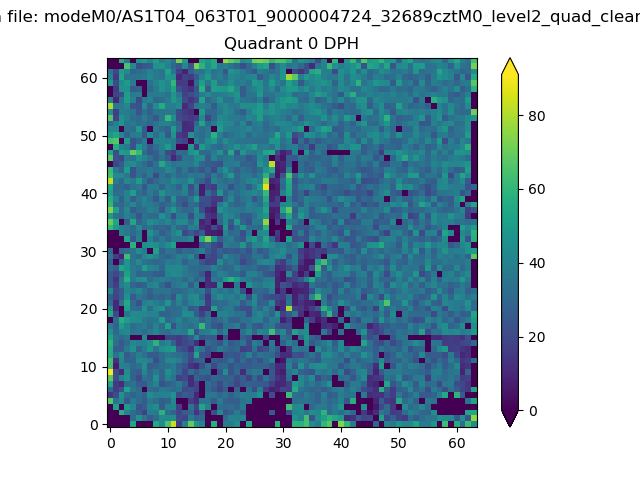 |
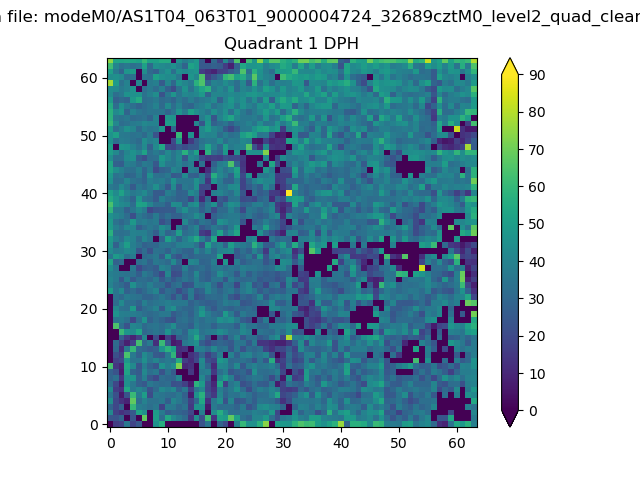 |
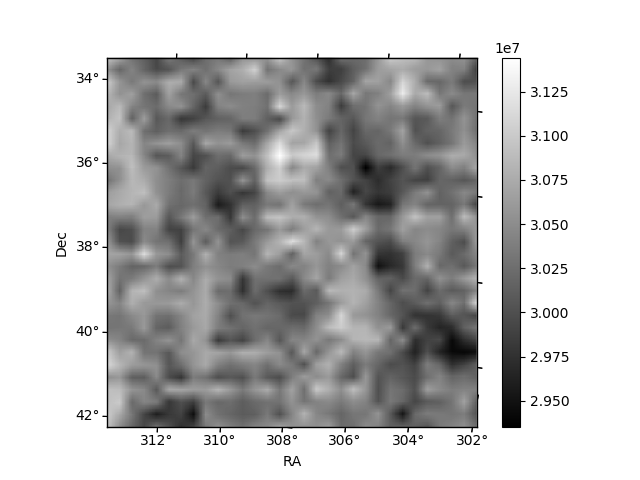
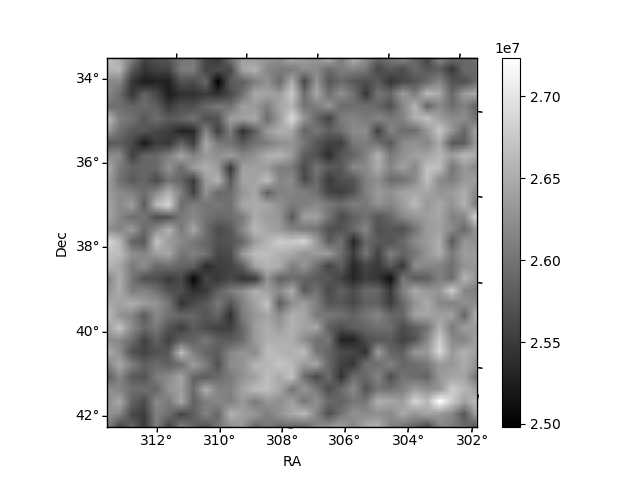
Quadrant B |
|---|---|---|---|
| Quadrant D | 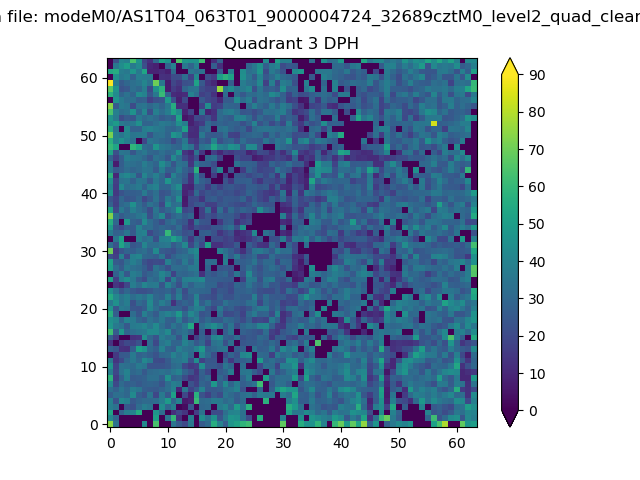 |
 |
Quadrant C |
| Plot type | Count rate plots | Images |
|---|---|---|
| Comparison with Poisson distribution Blue bars denote a histogram of data divided into 1 sec bins. Red curve is a Poisson curve with rate = median count rate of data. |
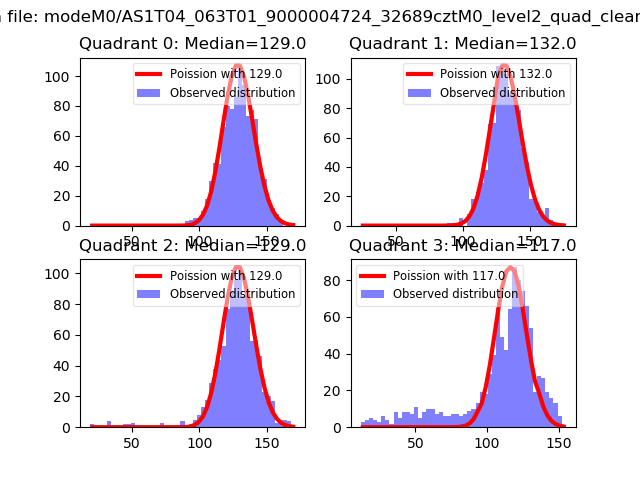 |
 |
| Quadrant-wise count rates Data is divided into 100 sec bins |
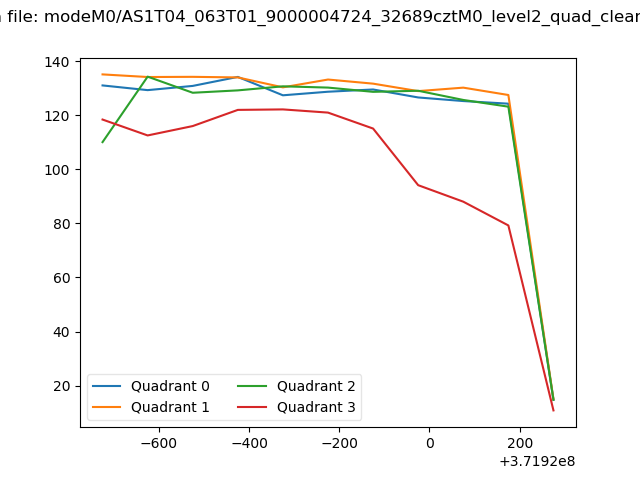 |
|
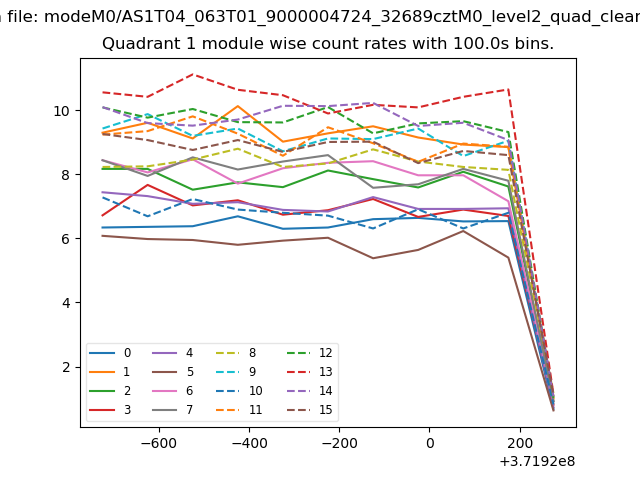
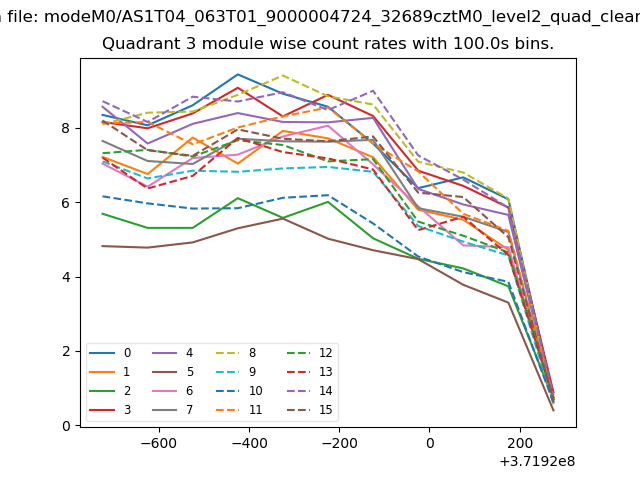
| Module-wise count rates for Quadrant A Data is divided into 100 sec bins |
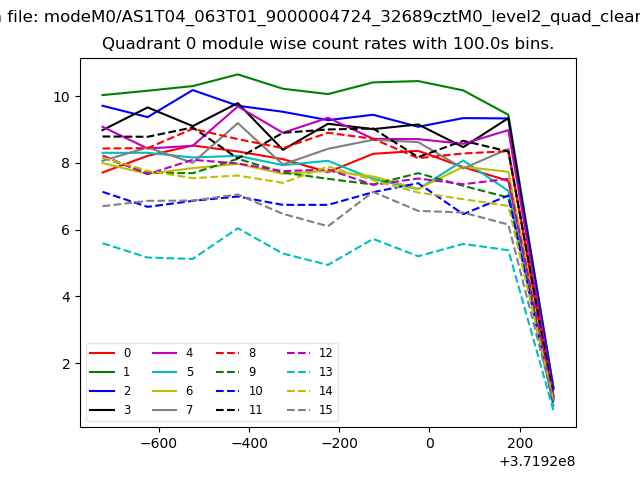 |
 |
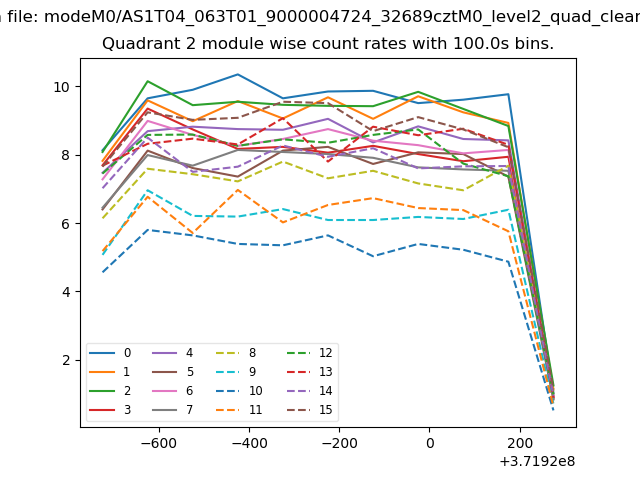
| Module-wise count rates for Quadrant B Data is divided into 100 sec bins |
 |
 |
| Module-wise count rates for Quadrant C Data is divided into 100 sec bins |
 |
 |
| Module-wise count rates for Quadrant D Data is divided into 100 sec bins |
 |
 |
| Parameter | Plot |
|---|---|
| CZT HV Monitor | 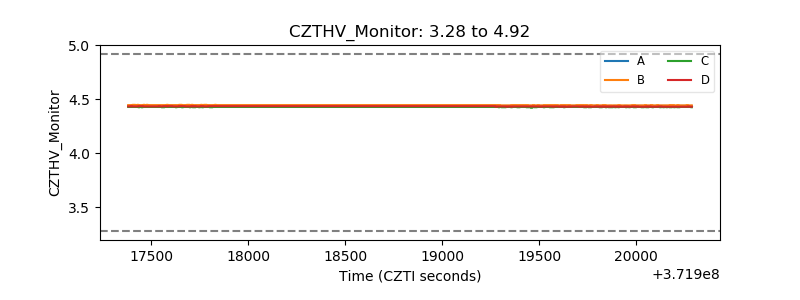 |
| D_VDD | 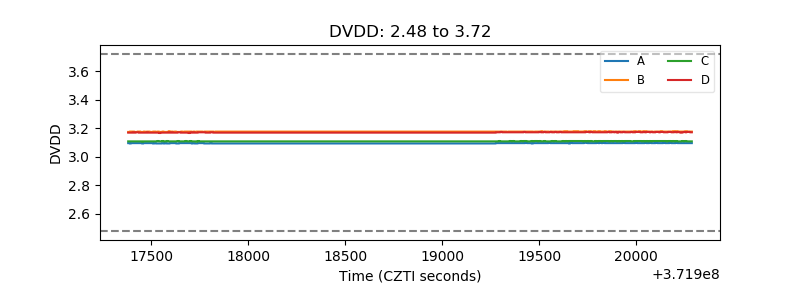 |
| Temperature 1 | 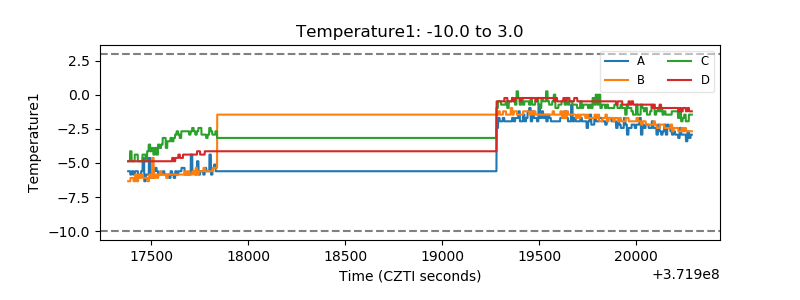 |
| Veto HV Monitor |  |
| Veto LLD | 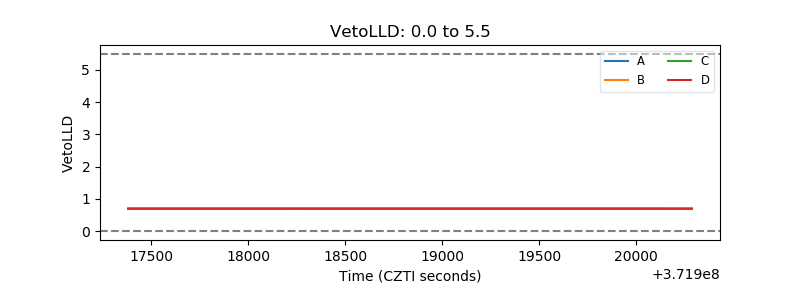 |
| Alpha Counter | 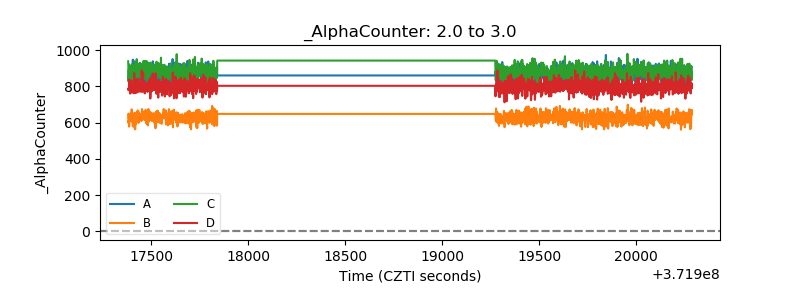 |
| _CPM_Rate | 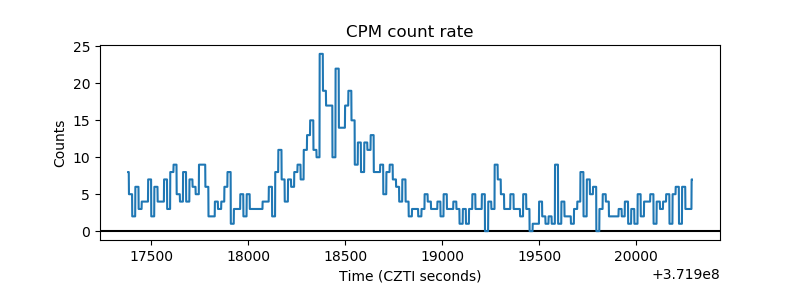 |
| CZT Counter | 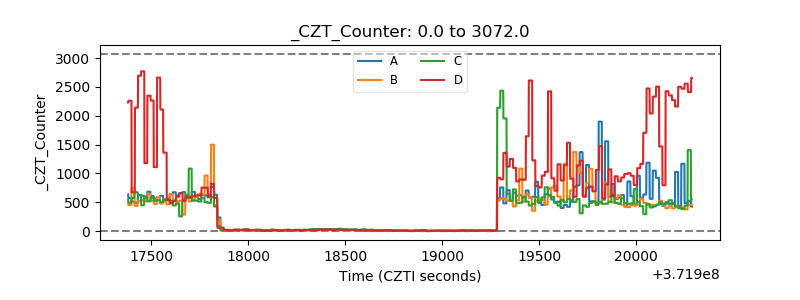 |
| +2.5 Volts monitor |  |
| +5 Volts monitor |  |
| _ROLL_ROT | 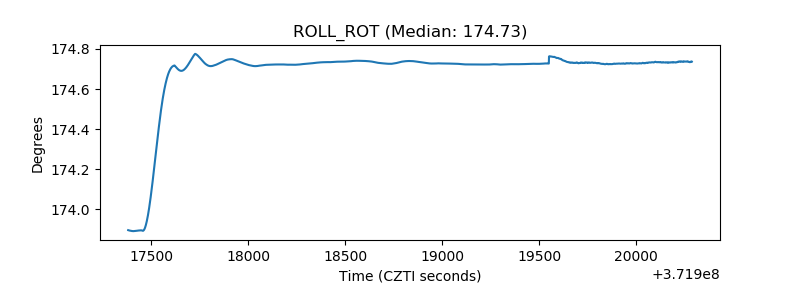 |
| _Roll_DEC | 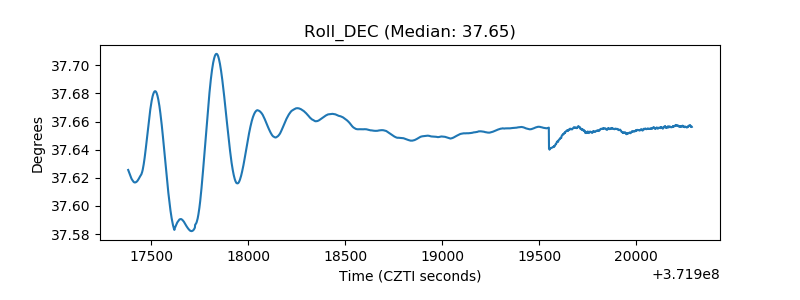 |
| _Roll_RA | 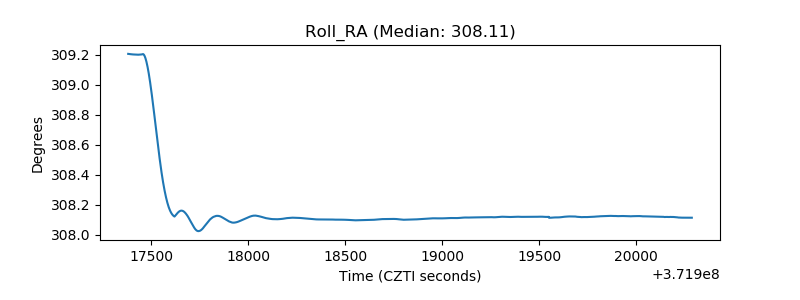 |
| Veto Counter |  |