| Param | Original file | Final file |
|---|---|---|
| Filename | modeM0/AS1T04_063T01_9000004724_32690cztM0_level2.evt | modeM0/AS1T04_063T01_9000004724_32690cztM0_level2_quad_clean.evt |
| Size (bytes) | 590,103,360 | 74,004,480 |
| Size | 562.8 MB | 70.6 MB |
| Events in quadrant A | 3,214,149 | 481,676 |
| Events in quadrant B | 3,207,234 | 486,537 |
| Events in quadrant C | 3,345,297 | 470,098 |
| Events in quadrant D | 7,706,334 | 390,755 |
| Mode SS | |||
|---|---|---|---|
| Quadrant | BADHDUFLAG | Total packets | Discarded packets |
| A | 0 | 120 | 0 |
| B | 0 | 120 | 0 |
| C | 0 | 120 | 0 |
| D | 0 | 120 | 0 |
| Mode M9 | |||
|---|---|---|---|
| Quadrant | BADHDUFLAG | Total packets | Discarded packets |
| A | 0 | 16 | 0 |
| B | 0 | 16 | 0 |
| C | 0 | 16 | 0 |
| D | 0 | 17 | 0 |
| Mode M0 | |||
|---|---|---|---|
| Quadrant | BADHDUFLAG | Total packets | Discarded packets |
| A | 0 | 13270 | 3 |
| B | 0 | 13305 | 2 |
| C | 0 | 13721 | 2 |
| D | 0 | 27035 | 2 |
| Quadrant | Total seconds | Saturated seconds | Saturation percentage |
|---|---|---|---|
| A | 5884 | 26 | 0.441876% |
| B | 5884 | 48 | 0.815772% |
| C | 5884 | 143 | 2.430320% |
| D | 5884 | 1342 | 22.807614% |
Noise dominated data is calculated using 1-second bins in cleaned event files. If a bin has >2000 counts, and if more than 50% of those come from <1% of pixels, then it is considered to be noise-dominated and hence unusable.
| Quadrant | # 1 sec bins | Bins with >0 counts | Bins with >2000 counts | High rate bins dominated by noise | Noise dominated (total time) | Noise dominated (detector-on time) | Marked lightcurve |
|---|---|---|---|---|---|---|---|
| A | 7196 | 5885 | 5 | 5 | 0.07% | 0.08% | 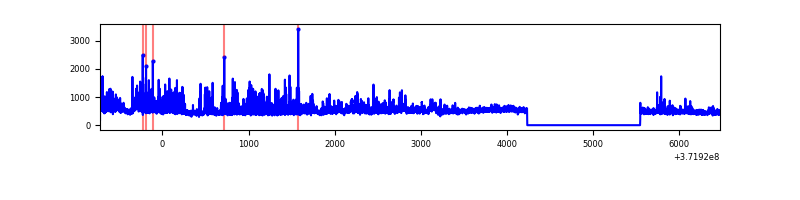 |
| B | 7196 | 5885 | 20 | 20 | 0.28% | 0.34% | 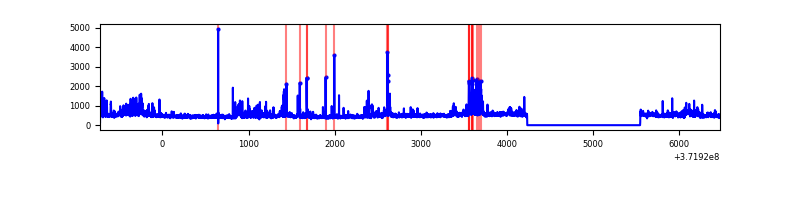 |
| C | 7196 | 5885 | 107 | 107 | 1.49% | 1.82% | 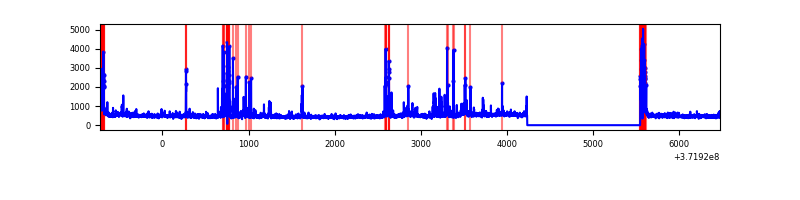 |
| D | 7196 | 5885 | 1210 | 1210 | 16.81% | 20.56% | 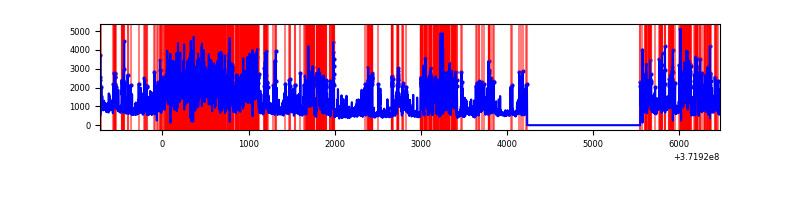 |
Top three noisy pixels from each quadrant. If the there are fewer than three noisy pixels in the level2.evt file, extra rows are filled as -1
| Pixel properties | Quadrant properties | ||||||
|---|---|---|---|---|---|---|---|
| Quadrant | DetID | PixID | Counts | Sigma | Mean | Median | Sigma |
| A | 15 | 249 | 488017 | 3558.86 | 683 | 670 | 136.9 |
| A | 0 | 253 | 30416 | 217.22 | 683 | 670 | 136.9 |
| A | 13 | 6 | 14484 | 100.88 | 683 | 670 | 136.9 |
| B | 0 | 219 | 183413 | 1383.58 | 692 | 678 | 132.1 |
| B | 3 | 26 | 114027 | 858.22 | 692 | 678 | 132.1 |
| B | 0 | 199 | 66572 | 498.92 | 692 | 678 | 132.1 |
| C | 9 | 236 | 328789 | 2131.22 | 661 | 666 | 154.0 |
| C | 0 | 10 | 238770 | 1546.53 | 661 | 666 | 154.0 |
| C | 3 | 233 | 101861 | 657.28 | 661 | 666 | 154.0 |
| D | 12 | 3 | 956036 | 6678.03 | 608 | 596 | 143.1 |
| D | 12 | 2 | 646704 | 4515.96 | 608 | 596 | 143.1 |
| D | 8 | 195 | 524374 | 3660.94 | 608 | 596 | 143.1 |
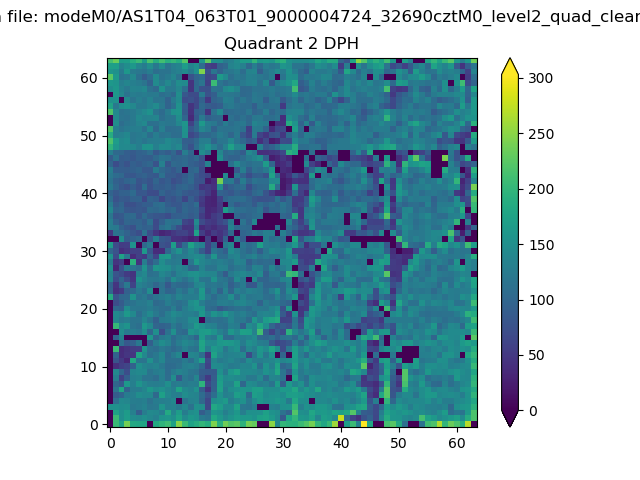
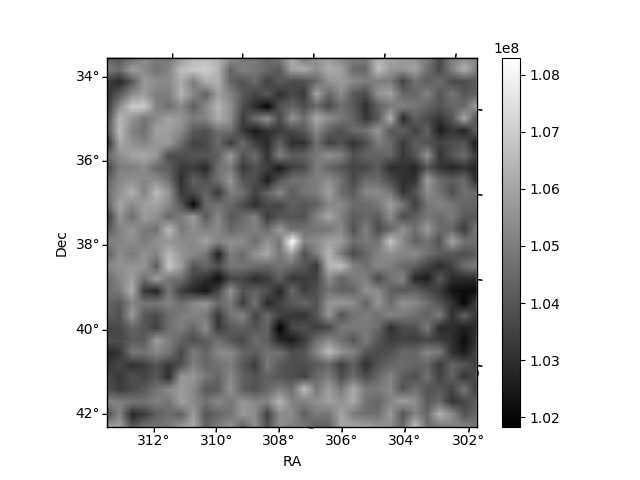
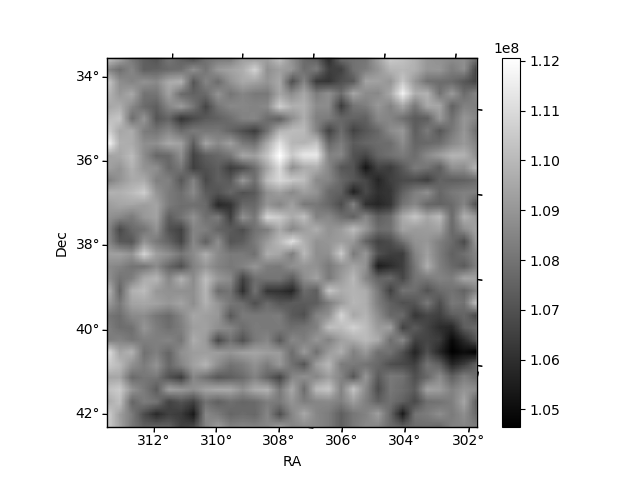
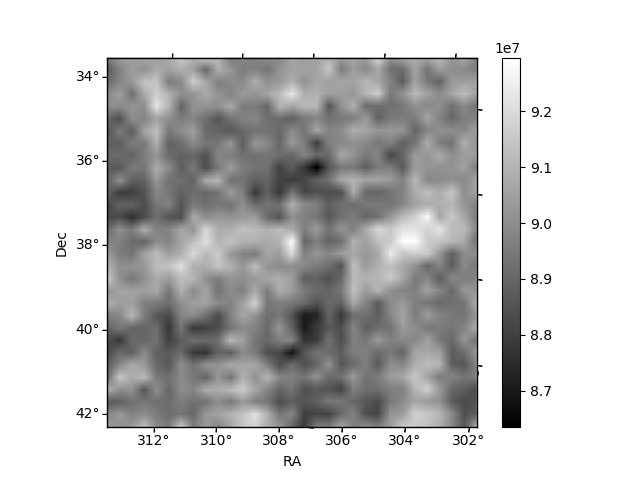
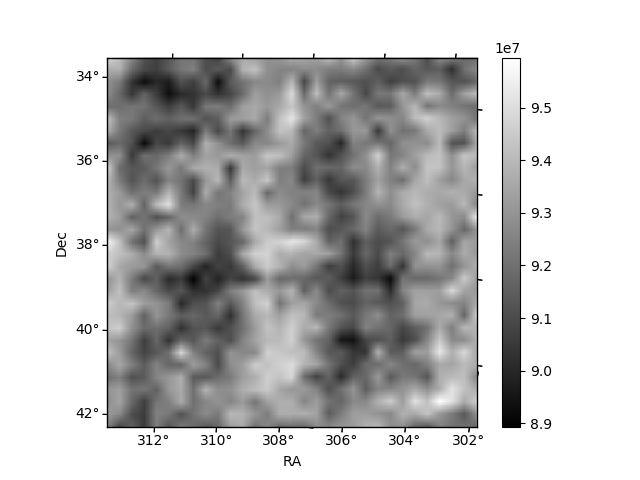
Histogram calculated using DETX and DETY for each event in the final _common_clean file
| Quadrant A | 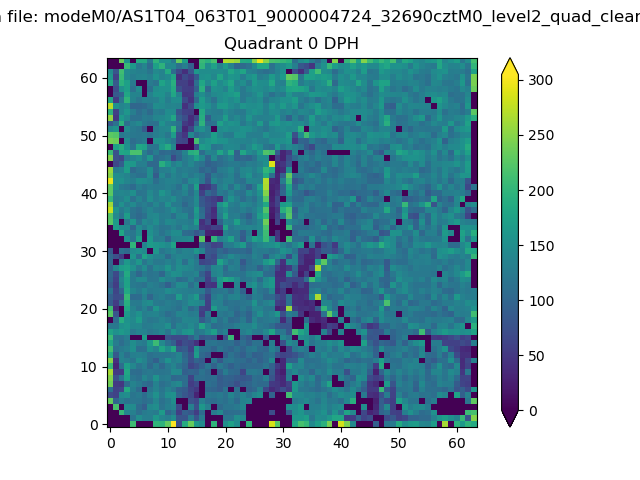 |
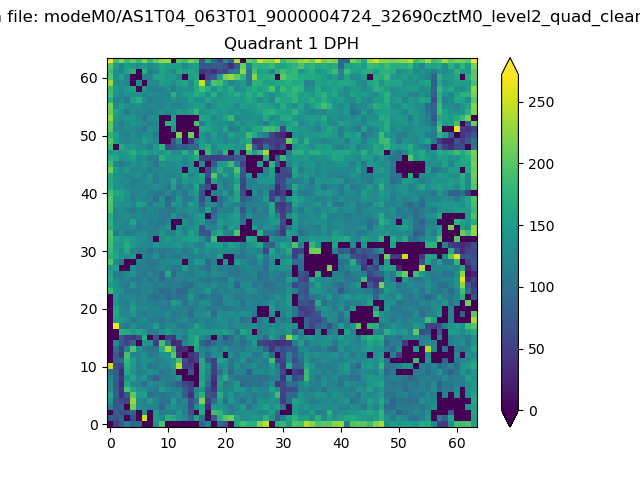 |
Quadrant B |
|---|---|---|---|
| Quadrant D | 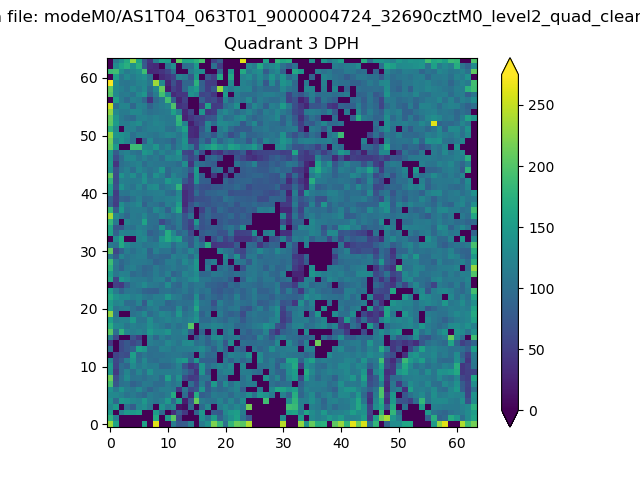 |
 |
Quadrant C |
| Plot type | Count rate plots | Images |
|---|---|---|
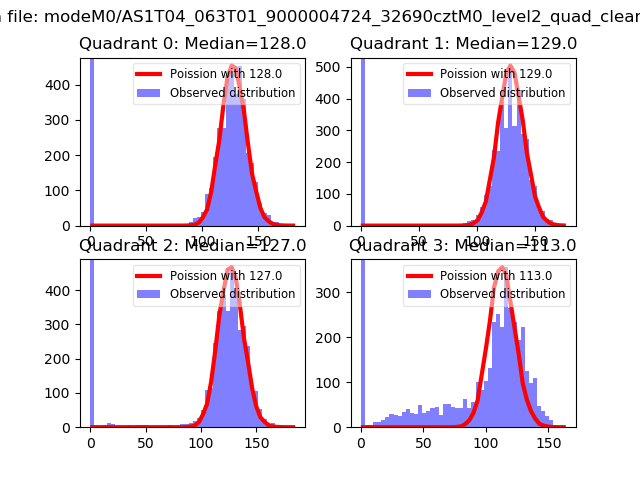
| Comparison with Poisson distribution Blue bars denote a histogram of data divided into 1 sec bins. Red curve is a Poisson curve with rate = median count rate of data. |
 |
 |
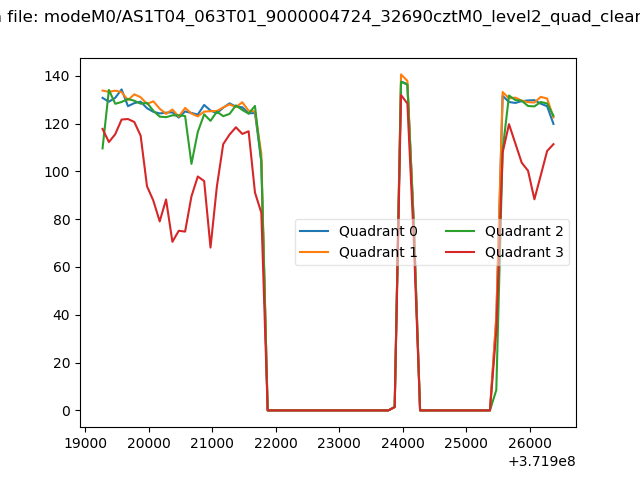
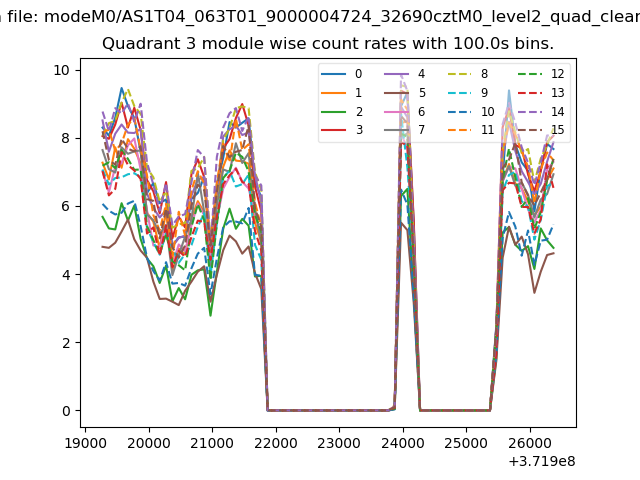
| Quadrant-wise count rates Data is divided into 100 sec bins |
 |
|
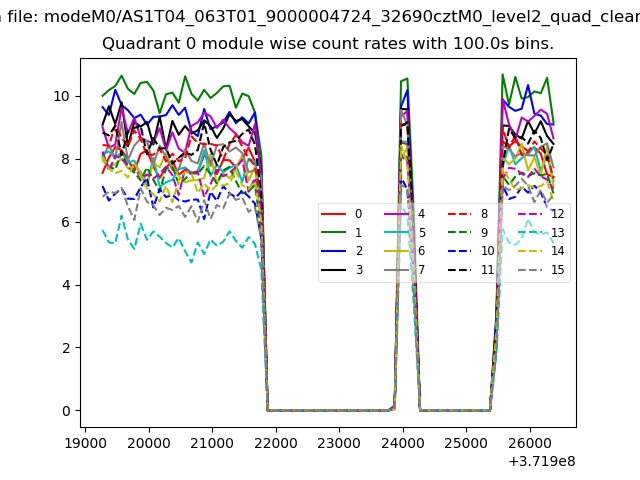
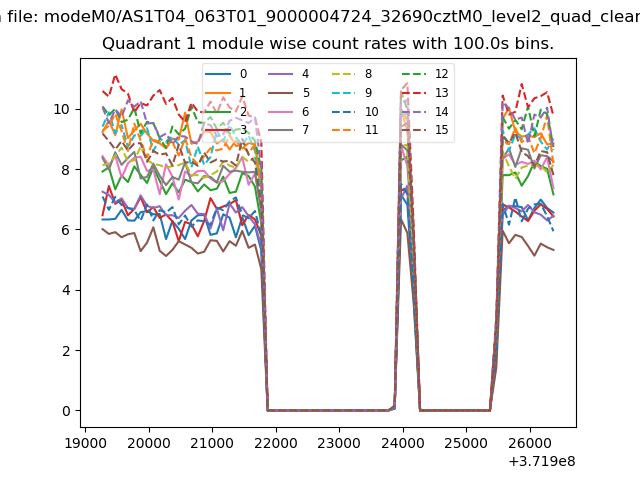
| Module-wise count rates for Quadrant A Data is divided into 100 sec bins |
 |
 |
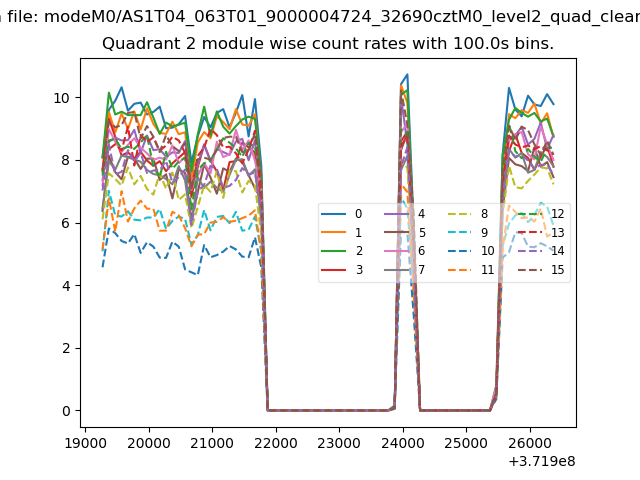
| Module-wise count rates for Quadrant B Data is divided into 100 sec bins |
 |
 |
| Module-wise count rates for Quadrant C Data is divided into 100 sec bins |
 |
 |
| Module-wise count rates for Quadrant D Data is divided into 100 sec bins |
 |
 |
| Parameter | Plot |
|---|---|
| CZT HV Monitor | 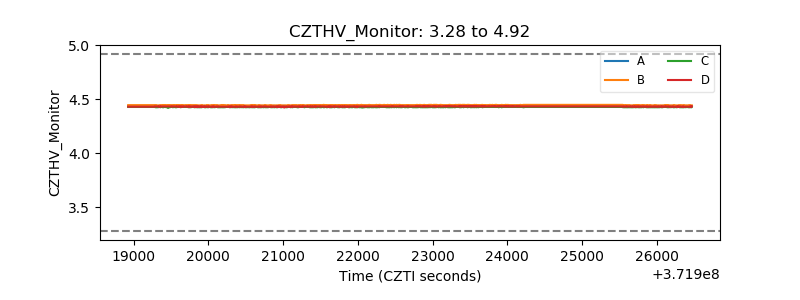 |
| D_VDD | 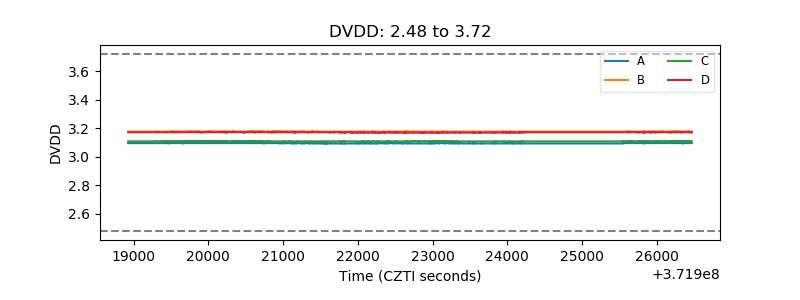 |
| Temperature 1 | 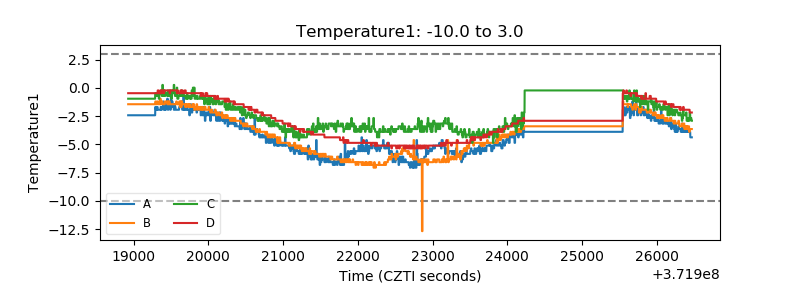 |
| Veto HV Monitor | 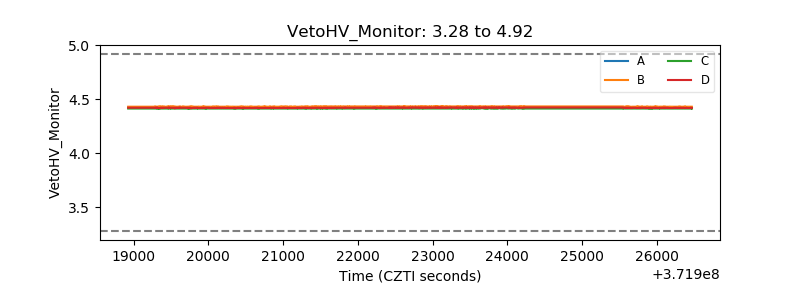 |
| Veto LLD | 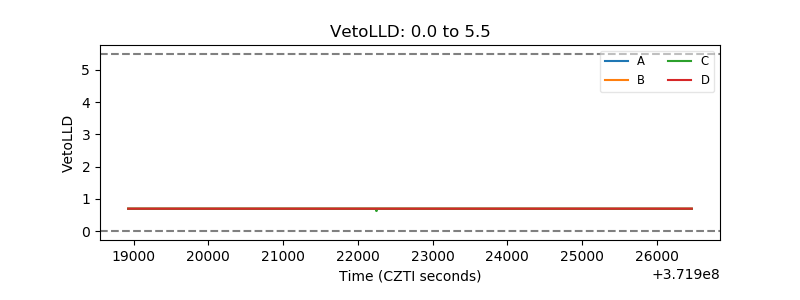 |
| Alpha Counter | 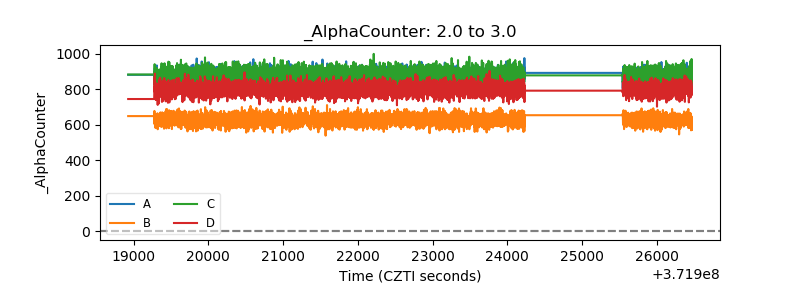 |
| _CPM_Rate | 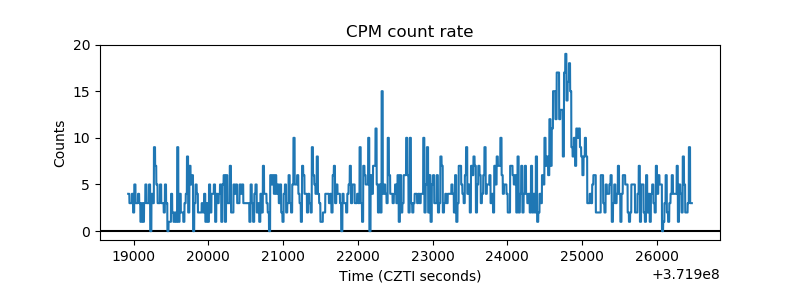 |
| CZT Counter | 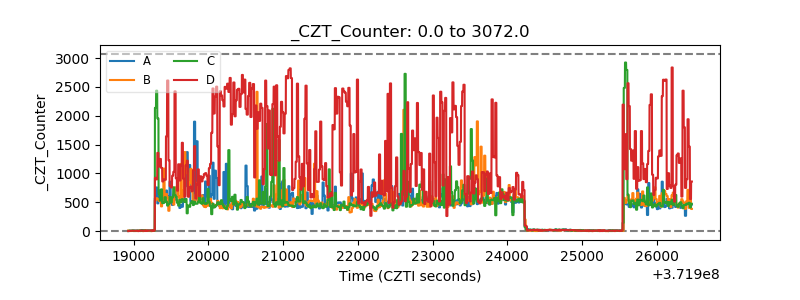 |
| +2.5 Volts monitor |  |
| +5 Volts monitor | 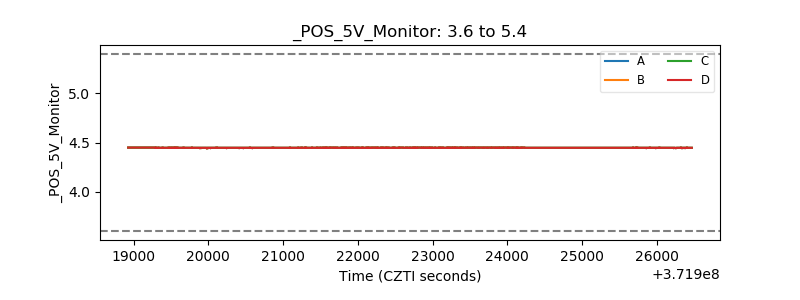 |
| _ROLL_ROT | 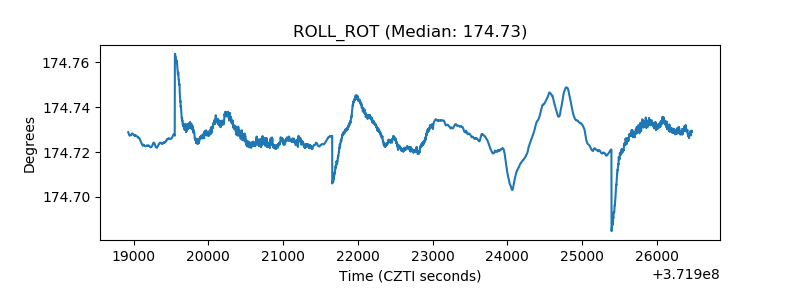 |
| _Roll_DEC | 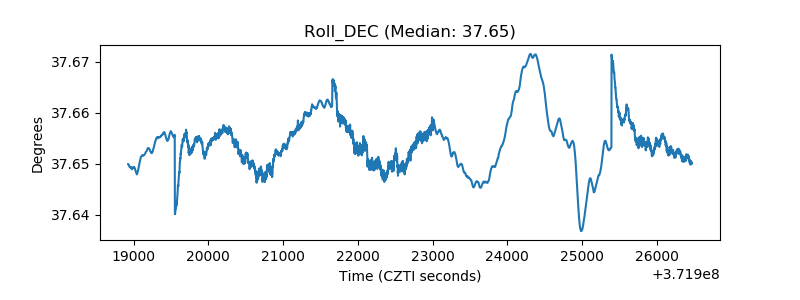 |
| _Roll_RA | 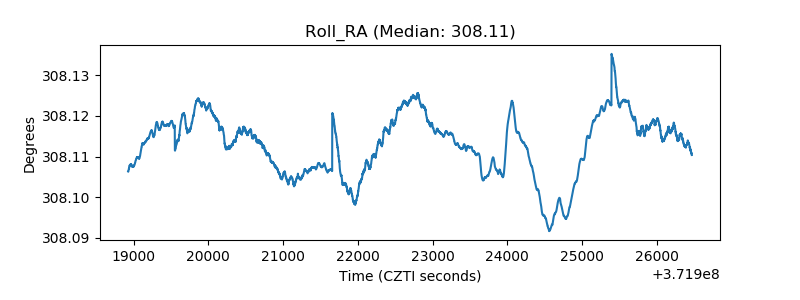 |
| Veto Counter | 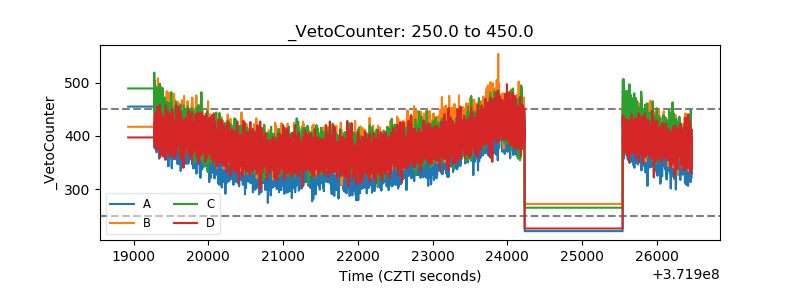 |