| Param | Original file | Final file |
|---|---|---|
| Filename | modeM0/AS1T04_063T01_9000004724_32693cztM0_level2.evt | modeM0/AS1T04_063T01_9000004724_32693cztM0_level2_quad_clean.evt |
| Size (bytes) | 1,764,550,080 | 182,404,800 |
| Size | 1.6 GB | 174.0 MB |
| Events in quadrant A | 17,259,413 | 1,055,848 |
| Events in quadrant B | 8,388,888 | 1,204,669 |
| Events in quadrant C | 9,912,066 | 1,152,657 |
| Events in quadrant D | 16,831,129 | 1,033,392 |
| Mode SS | |||
|---|---|---|---|
| Quadrant | BADHDUFLAG | Total packets | Discarded packets |
| A | 0 | 318 | 0 |
| B | 0 | 318 | 0 |
| C | 0 | 318 | 0 |
| D | 0 | 318 | 0 |
| Mode M9 | |||
|---|---|---|---|
| Quadrant | BADHDUFLAG | Total packets | Discarded packets |
| A | 0 | 52 | 0 |
| B | 0 | 52 | 0 |
| C | 0 | 52 | 0 |
| D | 0 | 53 | 0 |
| Mode M0 | |||
|---|---|---|---|
| Quadrant | BADHDUFLAG | Total packets | Discarded packets |
| A | 0 | 61790 | 5 |
| B | 0 | 35220 | 4 |
| C | 0 | 39686 | 4 |
| D | 0 | 60819 | 4 |
| Quadrant | Total seconds | Saturated seconds | Saturation percentage |
|---|---|---|---|
| A | 15593 | 3798 | 24.357083% |
| B | 15593 | 69 | 0.442506% |
| C | 15593 | 574 | 3.681139% |
| D | 15593 | 2233 | 14.320528% |
Noise dominated data is calculated using 1-second bins in cleaned event files. If a bin has >2000 counts, and if more than 50% of those come from <1% of pixels, then it is considered to be noise-dominated and hence unusable.
| Quadrant | # 1 sec bins | Bins with >0 counts | Bins with >2000 counts | High rate bins dominated by noise | Noise dominated (total time) | Noise dominated (detector-on time) | Marked lightcurve |
|---|---|---|---|---|---|---|---|
| A | 19773 | 15596 | 3077 | 3077 | 15.56% | 19.73% | 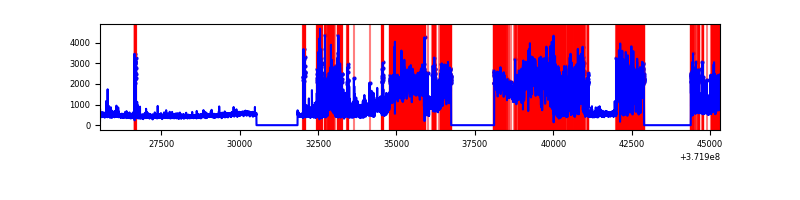 |
| B | 19773 | 15596 | 20 | 20 | 0.10% | 0.13% |  |
| C | 19773 | 15596 | 462 | 462 | 2.34% | 2.96% |  |
| D | 19773 | 15596 | 1986 | 1986 | 10.04% | 12.73% | 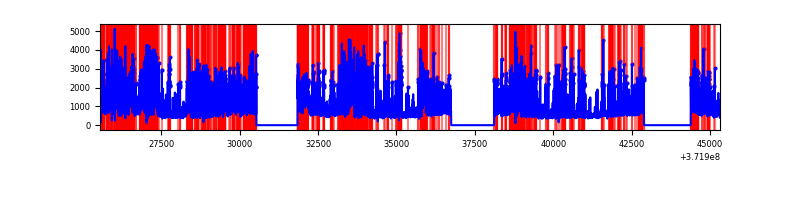 |
Top three noisy pixels from each quadrant. If the there are fewer than three noisy pixels in the level2.evt file, extra rows are filled as -1
| Pixel properties | Quadrant properties | ||||||
|---|---|---|---|---|---|---|---|
| Quadrant | DetID | PixID | Counts | Sigma | Mean | Median | Sigma |
| A | 15 | 249 | 10726122 | 32675.65 | 1646 | 1617 | 328.2 |
| A | 13 | 6 | 35113 | 102.06 | 1646 | 1617 | 328.2 |
| A | 7 | 16 | 31089 | 89.8 | 1646 | 1617 | 328.2 |
| B | 0 | 219 | 330996 | 945.19 | 1842 | 1805 | 348.3 |
| B | 0 | 230 | 246716 | 703.2 | 1842 | 1805 | 348.3 |
| B | 0 | 199 | 185542 | 527.56 | 1842 | 1805 | 348.3 |
| C | 9 | 236 | 1011223 | 2500.13 | 1750 | 1767 | 403.8 |
| C | 0 | 10 | 1002729 | 2479.1 | 1750 | 1767 | 403.8 |
| C | 6 | 247 | 598062 | 1476.85 | 1750 | 1767 | 403.8 |
| D | 12 | 33 | 2653969 | 6746.56 | 1664 | 1629 | 393.1 |
| D | 7 | 80 | 1388256 | 3527.06 | 1664 | 1629 | 393.1 |
| D | 2 | 249 | 1141980 | 2900.63 | 1664 | 1629 | 393.1 |
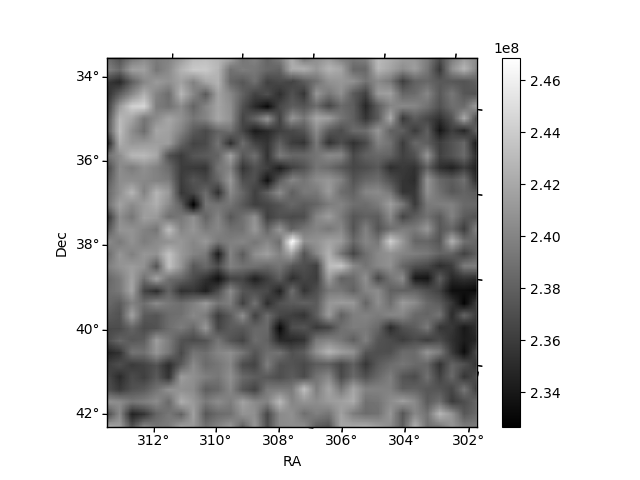
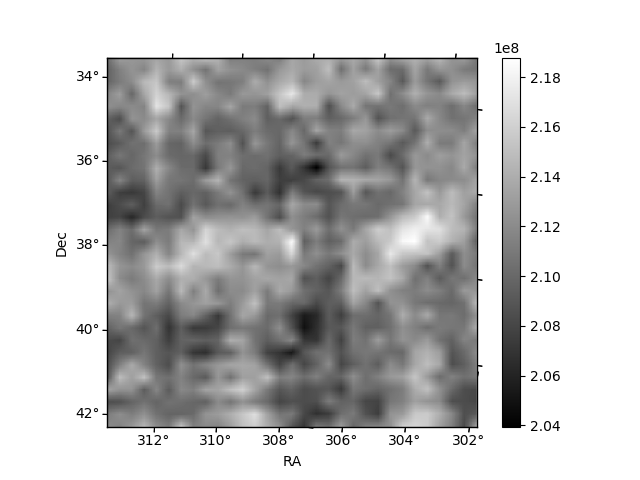
Histogram calculated using DETX and DETY for each event in the final _common_clean file
| Quadrant A | 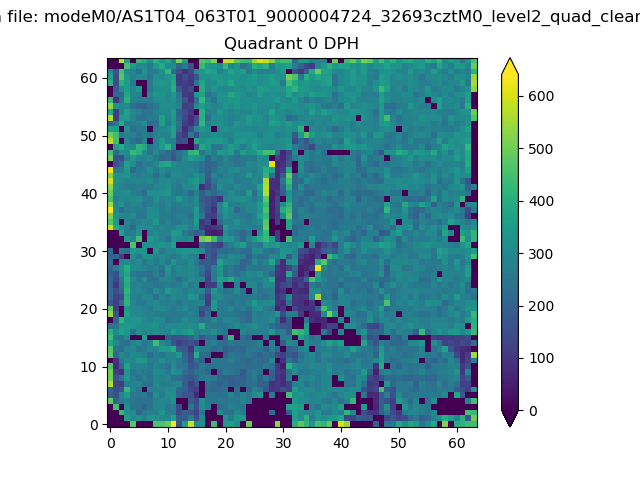 |
 |
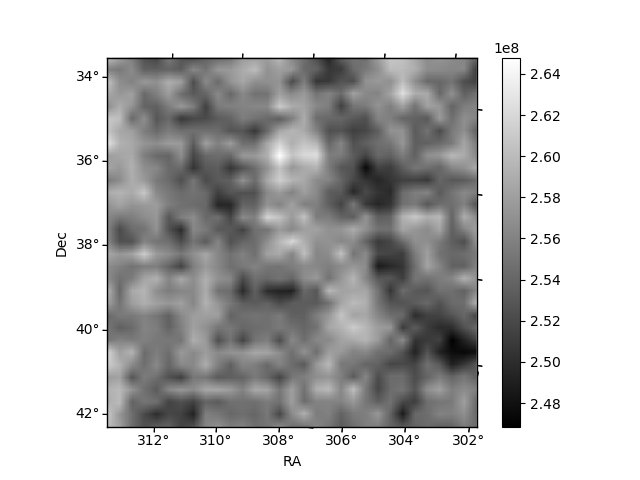
Quadrant B |
|---|---|---|---|
| Quadrant D | 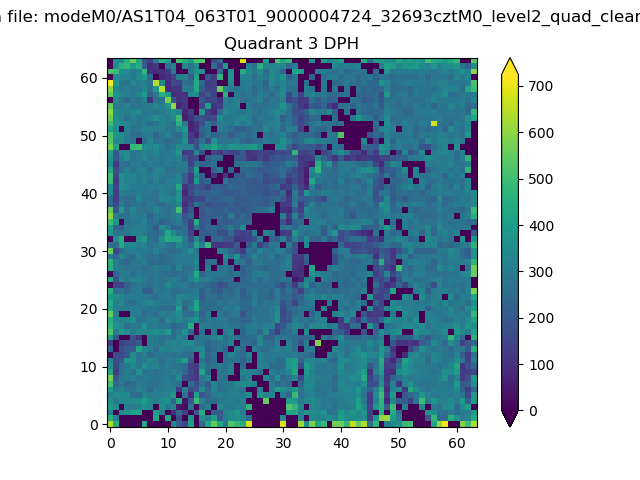 |
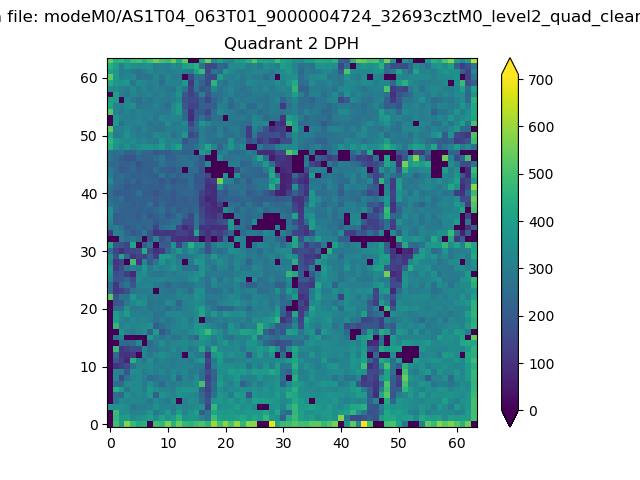 |
Quadrant C |
| Plot type | Count rate plots | Images |
|---|---|---|
| Comparison with Poisson distribution Blue bars denote a histogram of data divided into 1 sec bins. Red curve is a Poisson curve with rate = median count rate of data. |
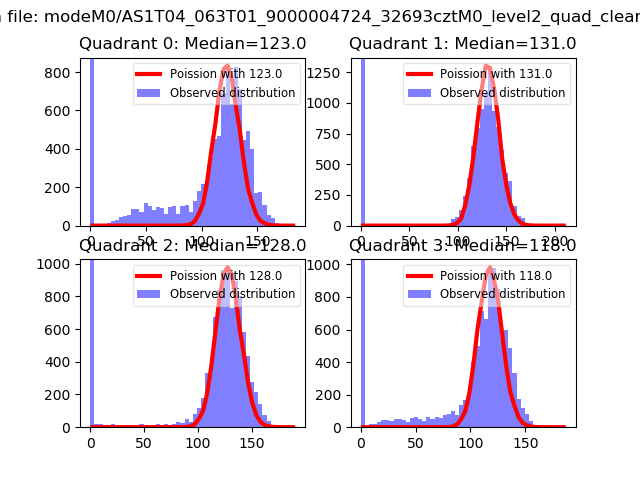 |
 |
| Quadrant-wise count rates Data is divided into 100 sec bins |
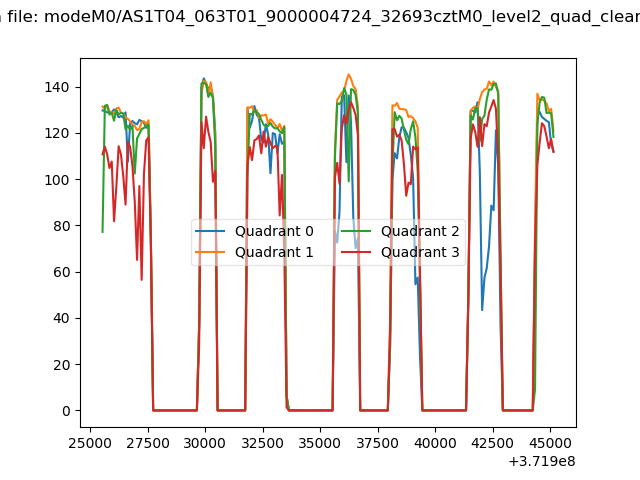 |
|
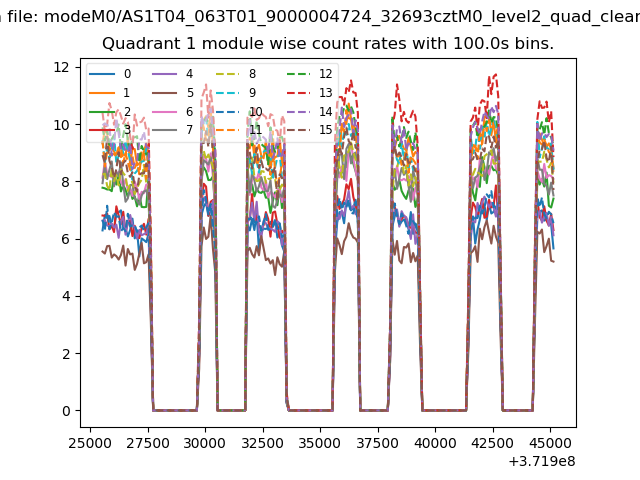
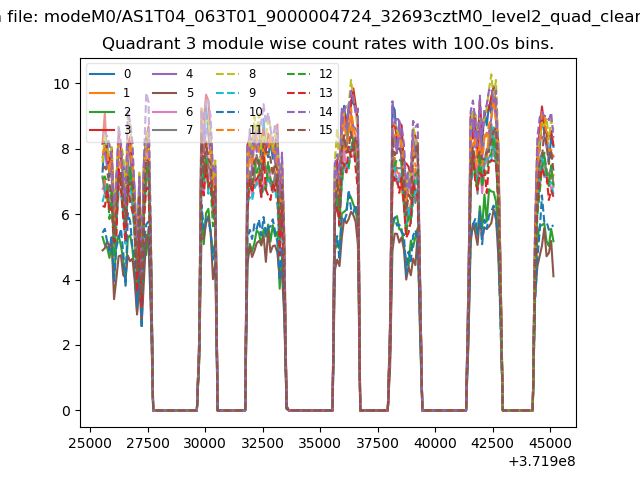
| Module-wise count rates for Quadrant A Data is divided into 100 sec bins |
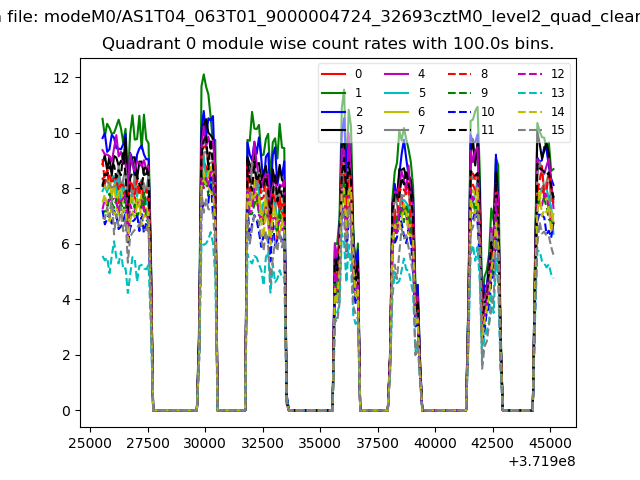 |
 |
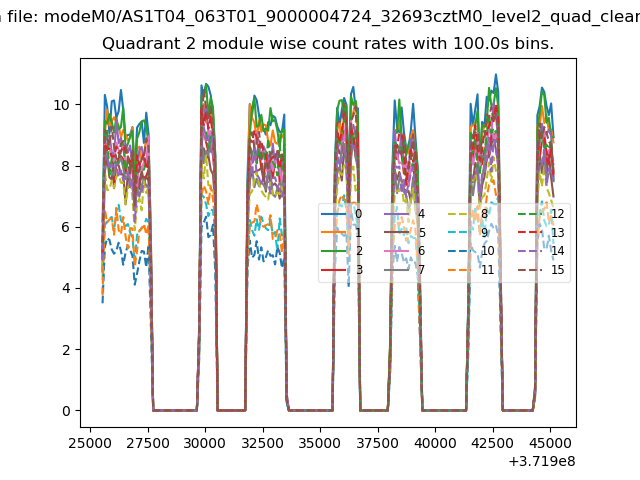
| Module-wise count rates for Quadrant B Data is divided into 100 sec bins |
 |
 |
| Module-wise count rates for Quadrant C Data is divided into 100 sec bins |
 |
 |
| Module-wise count rates for Quadrant D Data is divided into 100 sec bins |
 |
 |
| Parameter | Plot |
|---|---|
| CZT HV Monitor | 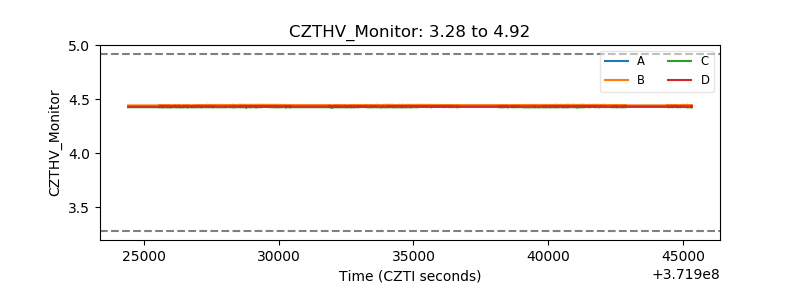 |
| D_VDD | 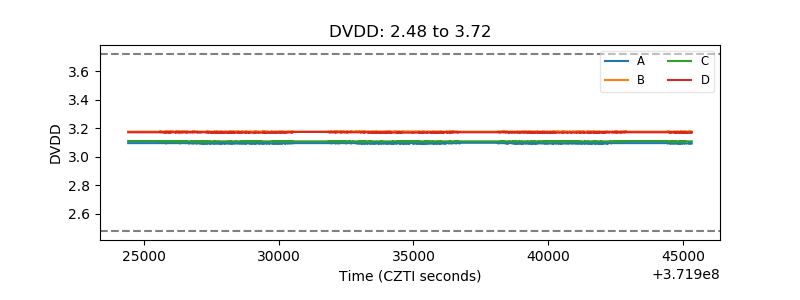 |
| Temperature 1 | 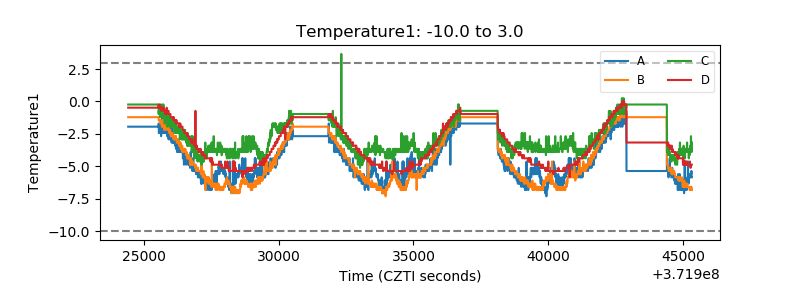 |
| Veto HV Monitor | 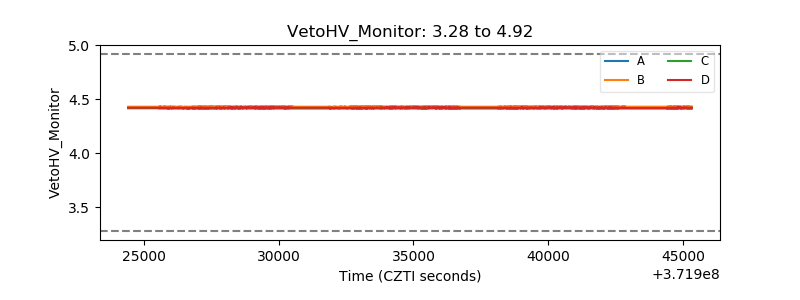 |
| Veto LLD | 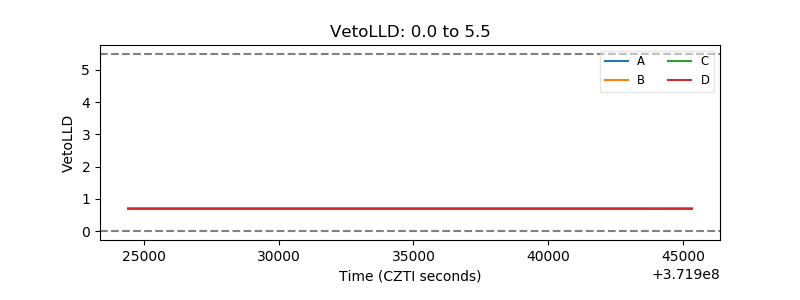 |
| Alpha Counter | 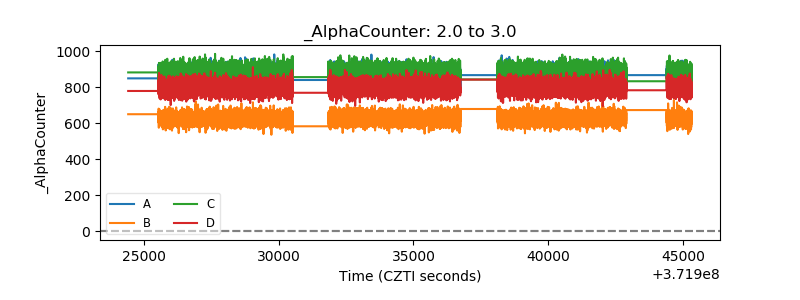 |
| _CPM_Rate | 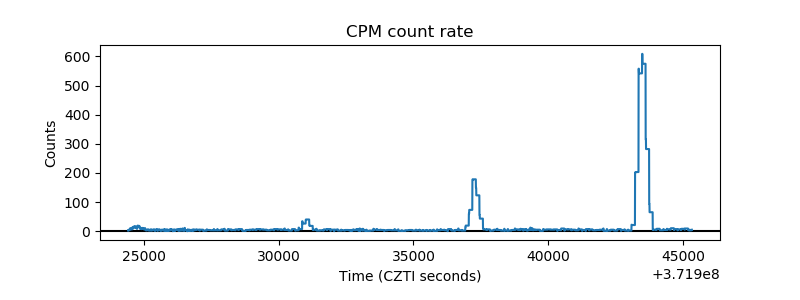 |
| CZT Counter |  |
| +2.5 Volts monitor |  |
| +5 Volts monitor |  |
| _ROLL_ROT | 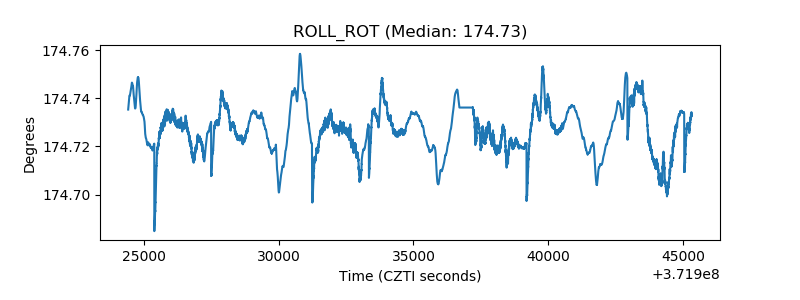 |
| _Roll_DEC | 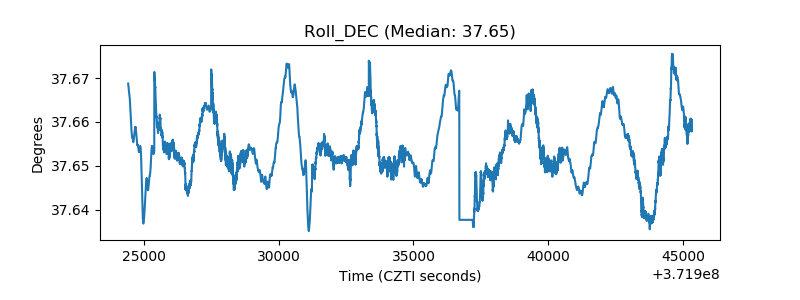 |
| _Roll_RA |  |
| Veto Counter | 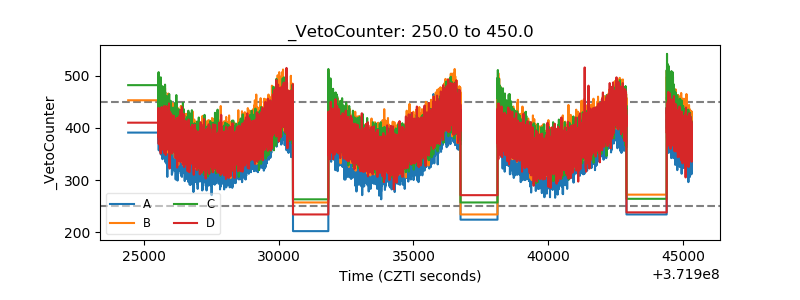 |