| Param | Original file | Final file |
|---|---|---|
| Filename | modeM0/AS1T04_063T01_9000004724_32694cztM0_level2.evt | modeM0/AS1T04_063T01_9000004724_32694cztM0_level2_quad_clean.evt |
| Size (bytes) | 644,158,080 | 61,989,120 |
| Size | 614.3 MB | 59.1 MB |
| Events in quadrant A | 7,759,565 | 346,392 |
| Events in quadrant B | 2,891,813 | 405,071 |
| Events in quadrant C | 3,365,397 | 383,112 |
| Events in quadrant D | 5,119,448 | 355,901 |
| Mode SS | |||
|---|---|---|---|
| Quadrant | BADHDUFLAG | Total packets | Discarded packets |
| A | 0 | 112 | 0 |
| B | 0 | 112 | 0 |
| C | 0 | 112 | 0 |
| D | 0 | 112 | 0 |
| Mode M9 | |||
|---|---|---|---|
| Quadrant | BADHDUFLAG | Total packets | Discarded packets |
| A | 0 | 23 | 0 |
| B | 0 | 23 | 0 |
| C | 0 | 23 | 0 |
| D | 0 | 24 | 0 |
| Mode M0 | |||
|---|---|---|---|
| Quadrant | BADHDUFLAG | Total packets | Discarded packets |
| A | 0 | 26981 | 3 |
| B | 0 | 12222 | 2 |
| C | 0 | 13671 | 2 |
| D | 0 | 19001 | 2 |
| Quadrant | Total seconds | Saturated seconds | Saturation percentage |
|---|---|---|---|
| A | 5512 | 1413 | 25.634978% |
| B | 5512 | 19 | 0.344702% |
| C | 5512 | 194 | 3.519594% |
| D | 5512 | 462 | 8.381713% |
Noise dominated data is calculated using 1-second bins in cleaned event files. If a bin has >2000 counts, and if more than 50% of those come from <1% of pixels, then it is considered to be noise-dominated and hence unusable.
| Quadrant | # 1 sec bins | Bins with >0 counts | Bins with >2000 counts | High rate bins dominated by noise | Noise dominated (total time) | Noise dominated (detector-on time) | Marked lightcurve |
|---|---|---|---|---|---|---|---|
| A | 7124 | 5513 | 1151 | 1151 | 16.16% | 20.88% | 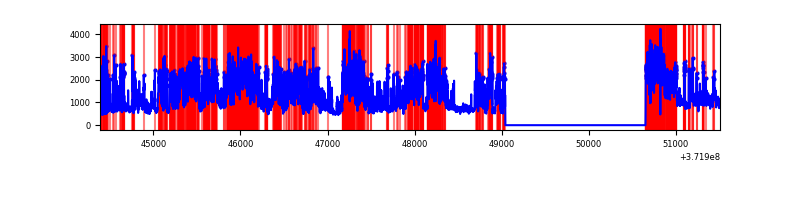 |
| B | 7124 | 5513 | 4 | 4 | 0.06% | 0.07% | 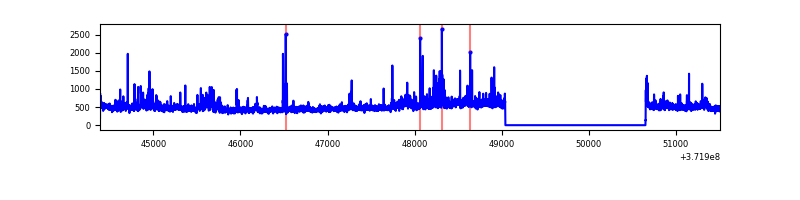 |
| C | 7124 | 5513 | 160 | 160 | 2.25% | 2.90% | 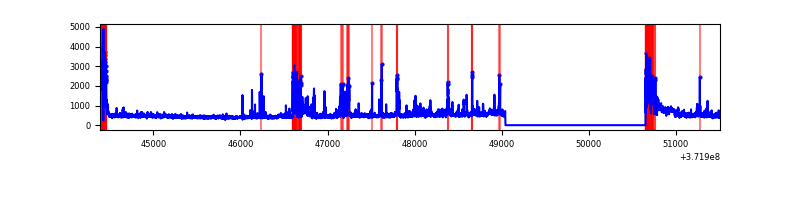 |
| D | 7124 | 5513 | 391 | 391 | 5.49% | 7.09% | 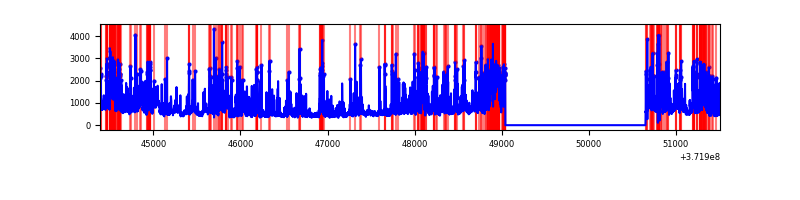 |
Top three noisy pixels from each quadrant. If the there are fewer than three noisy pixels in the level2.evt file, extra rows are filled as -1
| Pixel properties | Quadrant properties | ||||||
|---|---|---|---|---|---|---|---|
| Quadrant | DetID | PixID | Counts | Sigma | Mean | Median | Sigma |
| A | 15 | 249 | 5413890 | 45105.39 | 592 | 582 | 120.0 |
| A | 12 | 247 | 16266 | 130.68 | 592 | 582 | 120.0 |
| A | 13 | 254 | 9729 | 76.22 | 592 | 582 | 120.0 |
| B | 0 | 199 | 82491 | 656.07 | 656 | 641 | 124.8 |
| B | 0 | 230 | 59569 | 472.34 | 656 | 641 | 124.8 |
| B | 0 | 219 | 57711 | 457.45 | 656 | 641 | 124.8 |
| C | 0 | 10 | 706985 | 4825.91 | 621 | 627 | 146.4 |
| C | 9 | 236 | 114894 | 780.68 | 621 | 627 | 146.4 |
| C | 15 | 159 | 36519 | 245.22 | 621 | 627 | 146.4 |
| D | 2 | 249 | 527242 | 3620.32 | 607 | 594 | 145.5 |
| D | 12 | 33 | 502976 | 3453.51 | 607 | 594 | 145.5 |
| D | 8 | 195 | 342623 | 2351.2 | 607 | 594 | 145.5 |
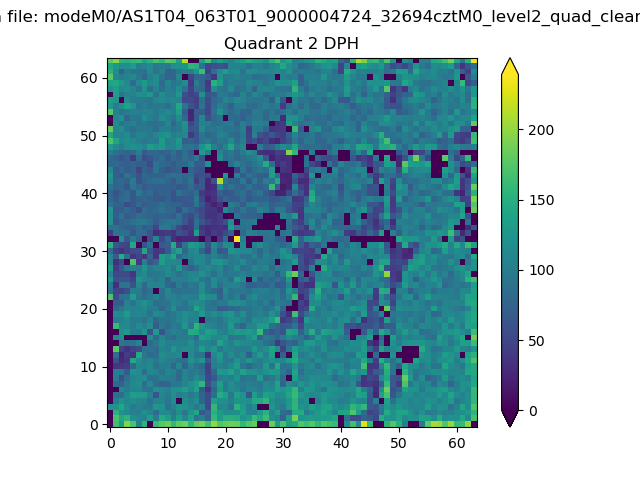
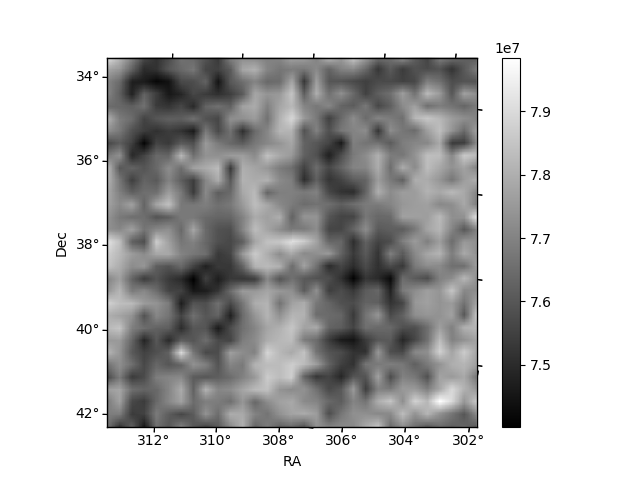
Histogram calculated using DETX and DETY for each event in the final _common_clean file
| Quadrant A | 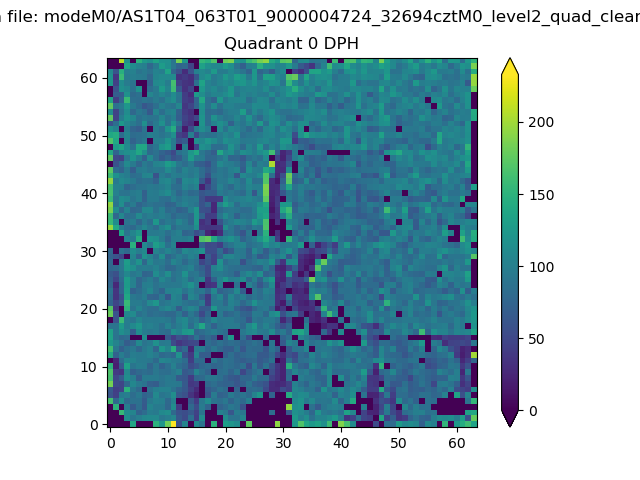 |
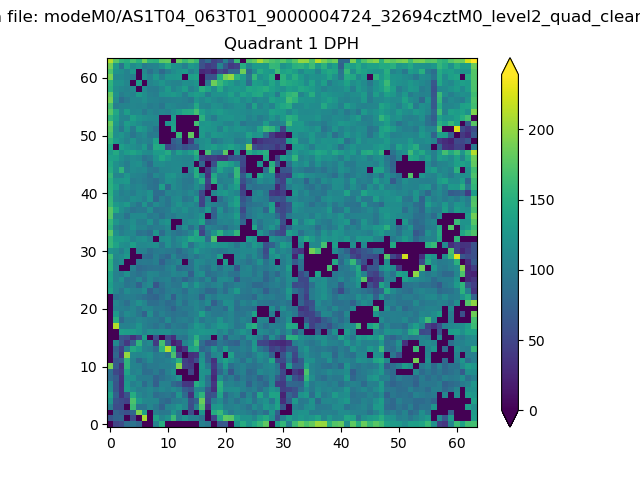 |
Quadrant B |
|---|---|---|---|
| Quadrant D | 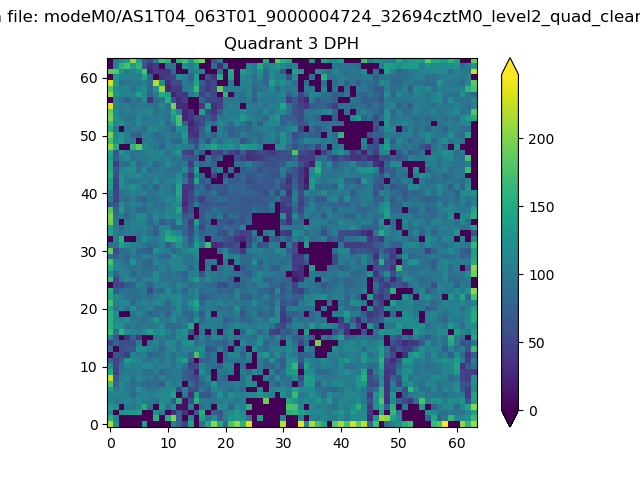 |
 |
Quadrant C |
| Plot type | Count rate plots | Images |
|---|---|---|
| Comparison with Poisson distribution Blue bars denote a histogram of data divided into 1 sec bins. Red curve is a Poisson curve with rate = median count rate of data. |
 |
 |
| Quadrant-wise count rates Data is divided into 100 sec bins |
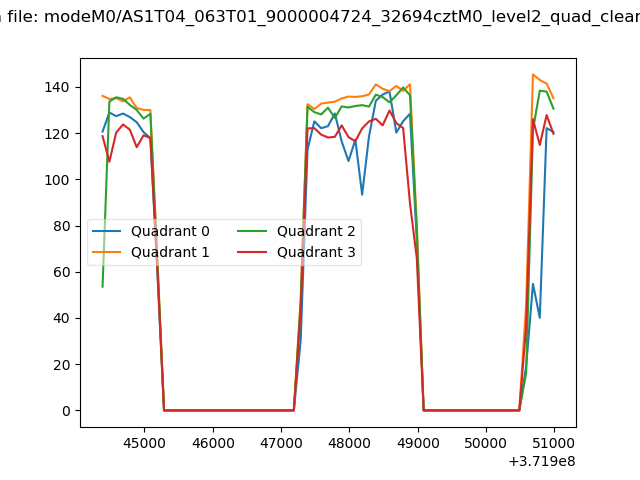 |
|
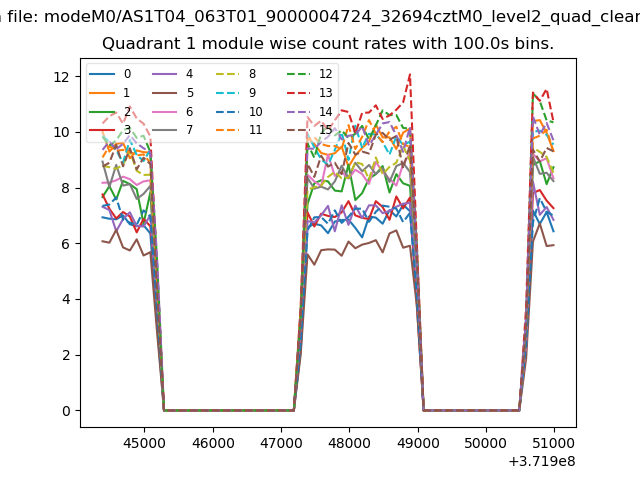
| Module-wise count rates for Quadrant A Data is divided into 100 sec bins |
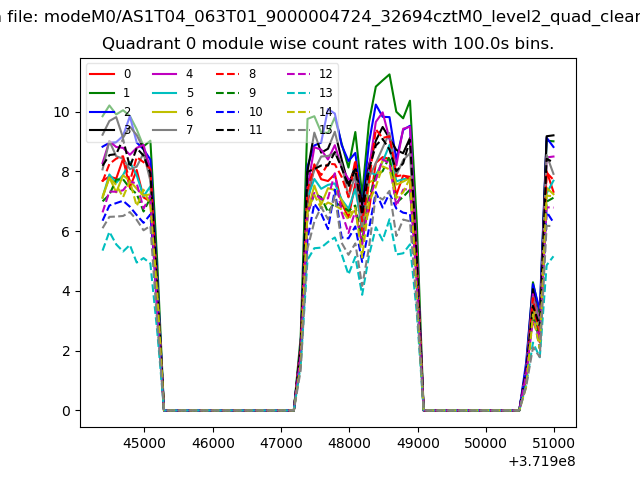 |
 |
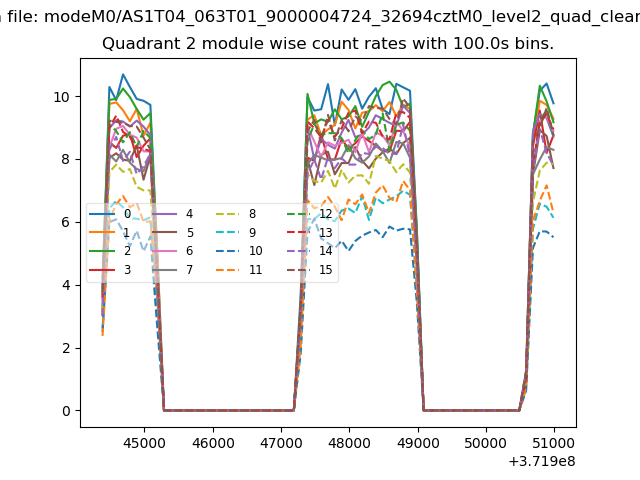
| Module-wise count rates for Quadrant B Data is divided into 100 sec bins |
 |
 |
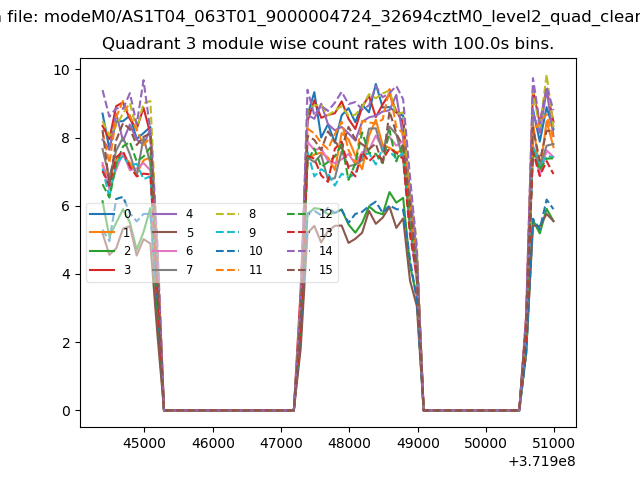
| Module-wise count rates for Quadrant C Data is divided into 100 sec bins |
 |
 |
| Module-wise count rates for Quadrant D Data is divided into 100 sec bins |
 |
 |
| Parameter | Plot |
|---|---|
| CZT HV Monitor | 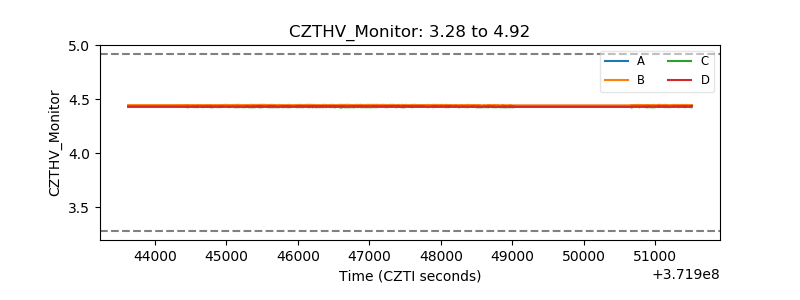 |
| D_VDD | 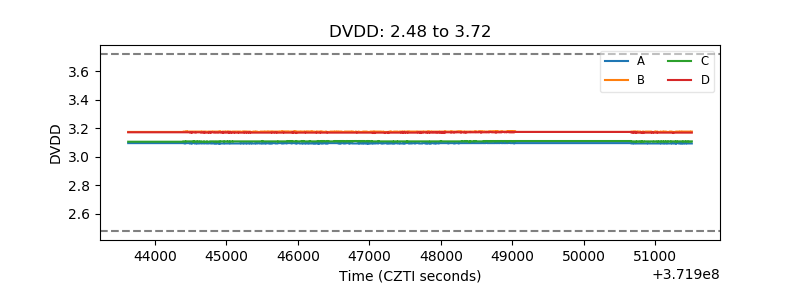 |
| Temperature 1 | 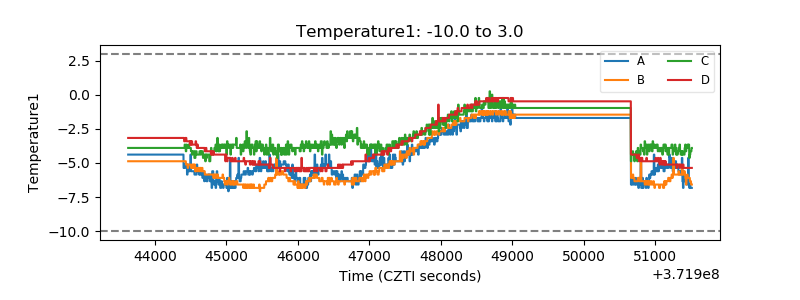 |
| Veto HV Monitor |  |
| Veto LLD | 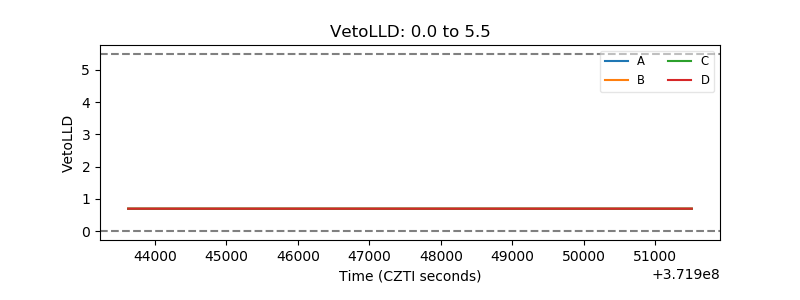 |
| Alpha Counter | 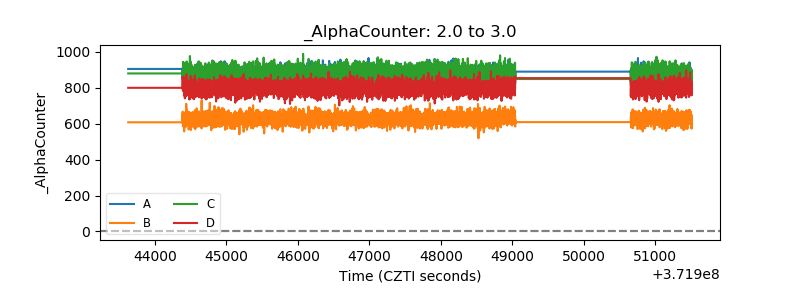 |
| _CPM_Rate | 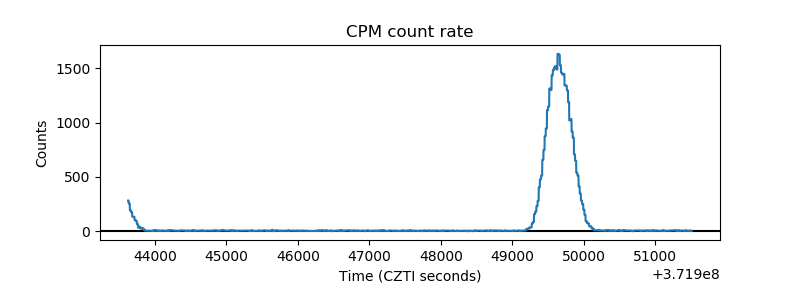 |
| CZT Counter | 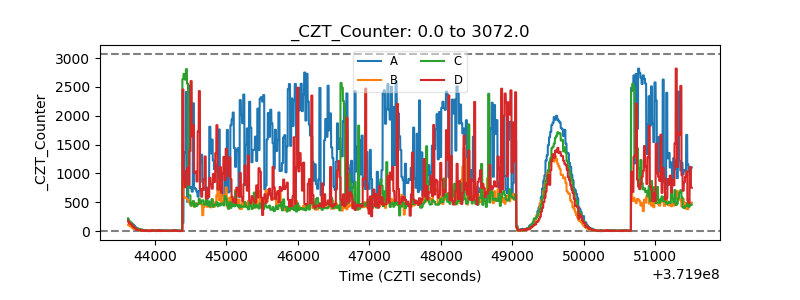 |
| +2.5 Volts monitor |  |
| +5 Volts monitor |  |
| _ROLL_ROT |  |
| _Roll_DEC |  |
| _Roll_RA | 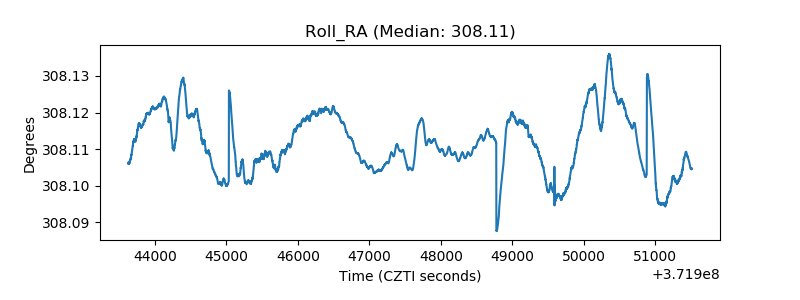 |
| Veto Counter | 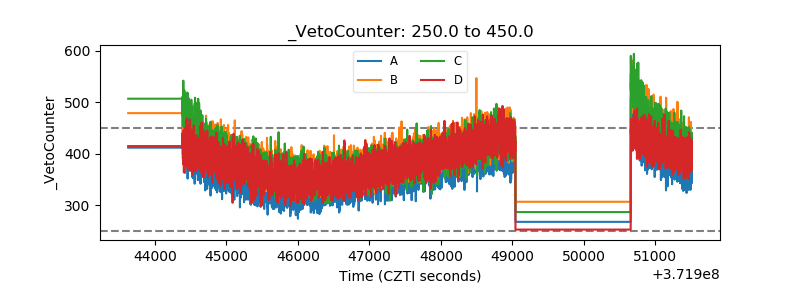 |