| Param | Original file | Final file |
|---|---|---|
| Filename | modeM0/AS1T04_063T01_9000004724_32696cztM0_level2.evt | modeM0/AS1T04_063T01_9000004724_32696cztM0_level2_quad_clean.evt |
| Size (bytes) | 786,061,440 | 56,430,720 |
| Size | 749.6 MB | 53.8 MB |
| Events in quadrant A | 10,592,176 | 248,716 |
| Events in quadrant B | 3,202,974 | 373,278 |
| Events in quadrant C | 4,202,463 | 349,966 |
| Events in quadrant D | 5,415,332 | 327,873 |
| Mode SS | |||
|---|---|---|---|
| Quadrant | BADHDUFLAG | Total packets | Discarded packets |
| A | 0 | 122 | 0 |
| B | 0 | 122 | 0 |
| C | 0 | 122 | 0 |
| D | 0 | 122 | 0 |
| Mode M9 | |||
|---|---|---|---|
| Quadrant | BADHDUFLAG | Total packets | Discarded packets |
| A | 0 | 33 | 0 |
| B | 0 | 33 | 0 |
| C | 0 | 33 | 0 |
| D | 0 | 33 | 0 |
| Mode M0 | |||
|---|---|---|---|
| Quadrant | BADHDUFLAG | Total packets | Discarded packets |
| A | 0 | 35499 | 3 |
| B | 0 | 13261 | 2 |
| C | 0 | 16321 | 2 |
| D | 0 | 20158 | 2 |
| Quadrant | Total seconds | Saturated seconds | Saturation percentage |
|---|---|---|---|
| A | 5828 | 2945 | 50.531915% |
| B | 5828 | 27 | 0.463281% |
| C | 5828 | 217 | 3.723404% |
| D | 5828 | 469 | 8.047358% |
Noise dominated data is calculated using 1-second bins in cleaned event files. If a bin has >2000 counts, and if more than 50% of those come from <1% of pixels, then it is considered to be noise-dominated and hence unusable.
| Quadrant | # 1 sec bins | Bins with >0 counts | Bins with >2000 counts | High rate bins dominated by noise | Noise dominated (total time) | Noise dominated (detector-on time) | Marked lightcurve |
|---|---|---|---|---|---|---|---|
| A | 9142 | 5830 | 2550 | 2550 | 27.89% | 43.74% | 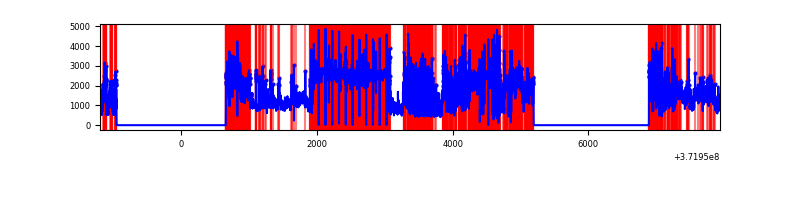 |
| B | 9142 | 5830 | 14 | 14 | 0.15% | 0.24% | 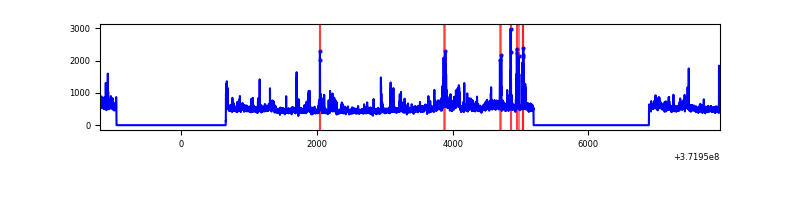 |
| C | 9142 | 5830 | 136 | 136 | 1.49% | 2.33% | 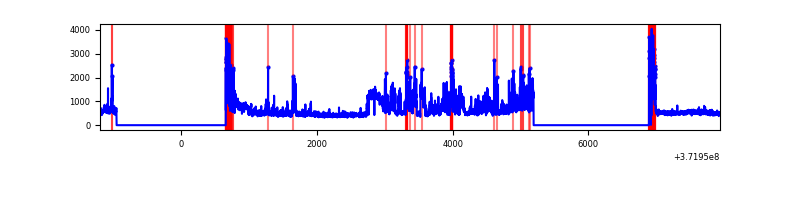 |
| D | 9142 | 5830 | 390 | 390 | 4.27% | 6.69% | 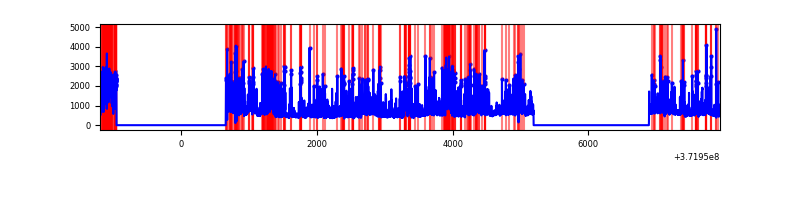 |
Top three noisy pixels from each quadrant. If the there are fewer than three noisy pixels in the level2.evt file, extra rows are filled as -1
| Pixel properties | Quadrant properties | ||||||
|---|---|---|---|---|---|---|---|
| Quadrant | DetID | PixID | Counts | Sigma | Mean | Median | Sigma |
| A | 15 | 249 | 8676301 | 89466.88 | 483 | 474 | 97.0 |
| A | 15 | 174 | 7913 | 76.71 | 483 | 474 | 97.0 |
| A | 7 | 16 | 7865 | 76.22 | 483 | 474 | 97.0 |
| B | 0 | 219 | 118622 | 872.7 | 713 | 697 | 135.1 |
| B | 3 | 26 | 94165 | 691.71 | 713 | 697 | 135.1 |
| B | 0 | 230 | 71000 | 520.27 | 713 | 697 | 135.1 |
| C | 0 | 10 | 1332245 | 8496.87 | 672 | 679 | 156.7 |
| C | 3 | 233 | 141902 | 901.16 | 672 | 679 | 156.7 |
| C | 8 | 35 | 34616 | 216.56 | 672 | 679 | 156.7 |
| D | 2 | 249 | 632834 | 3992.02 | 658 | 644 | 158.4 |
| D | 2 | 250 | 496371 | 3130.31 | 658 | 644 | 158.4 |
| D | 12 | 33 | 317432 | 2000.39 | 658 | 644 | 158.4 |
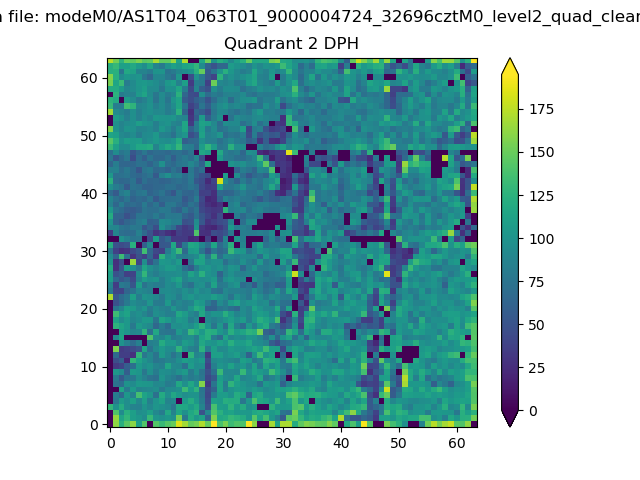
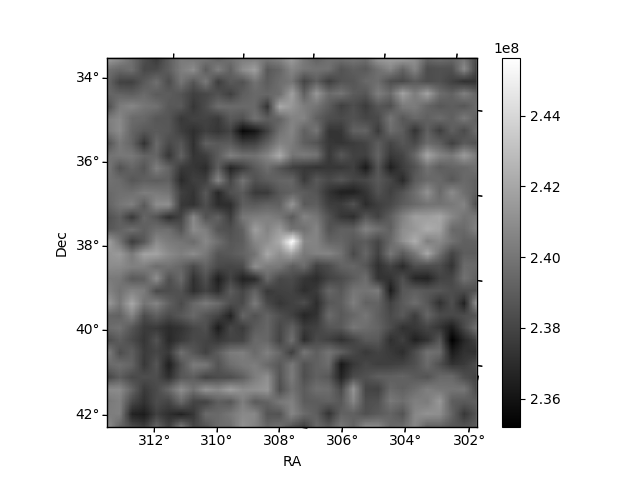
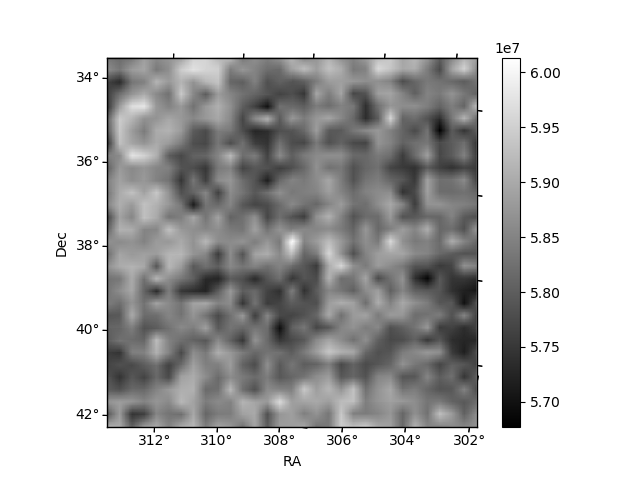
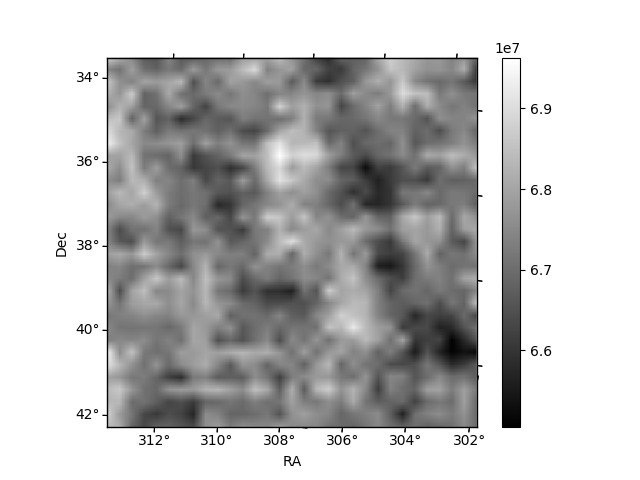
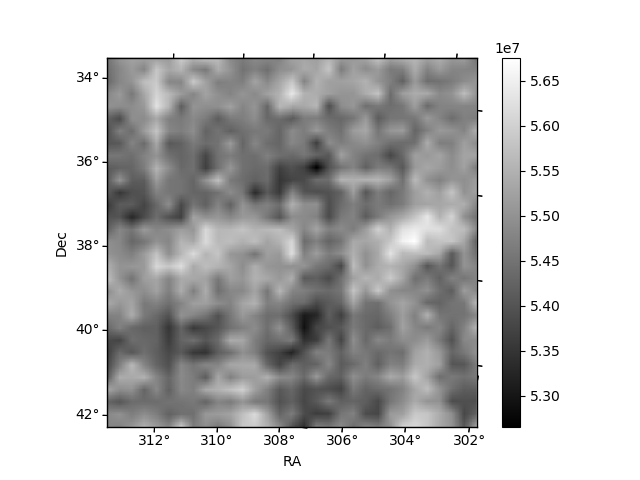
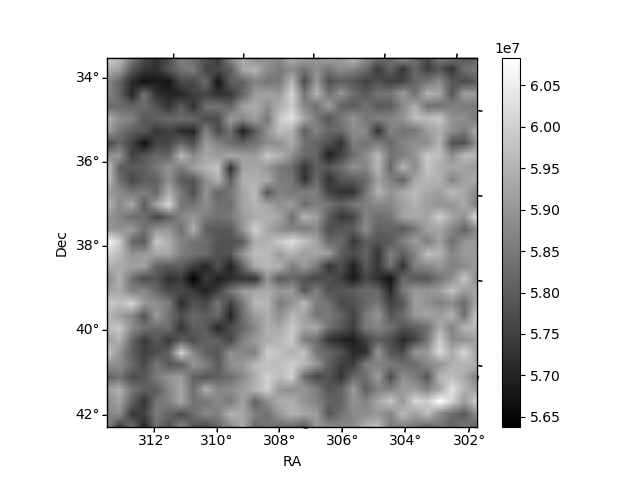
Histogram calculated using DETX and DETY for each event in the final _common_clean file
| Quadrant A | 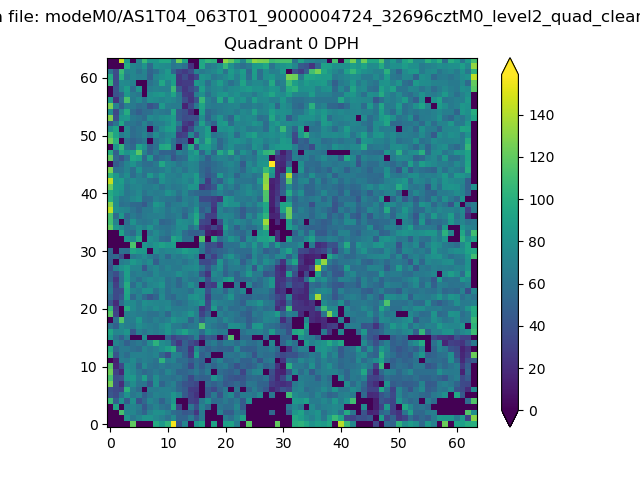 |
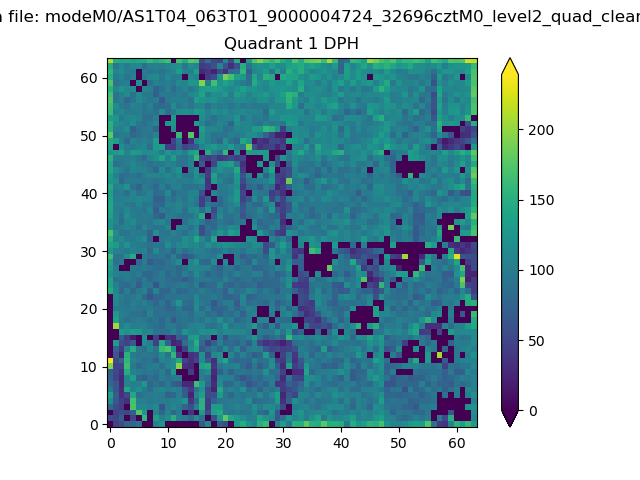 |
Quadrant B |
|---|---|---|---|
| Quadrant D | 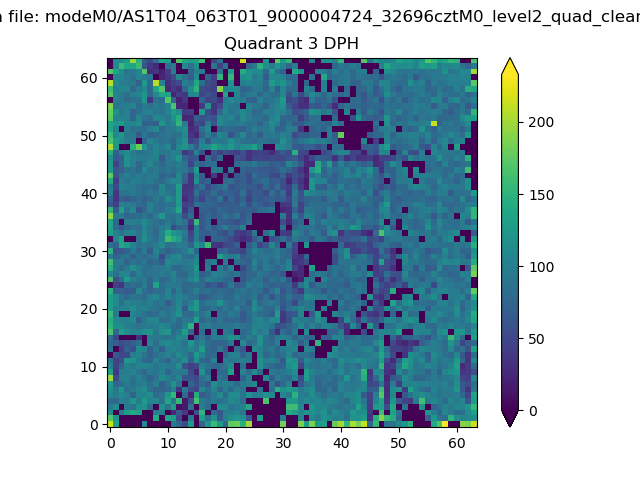 |
 |
Quadrant C |
| Plot type | Count rate plots | Images |
|---|---|---|
| Comparison with Poisson distribution Blue bars denote a histogram of data divided into 1 sec bins. Red curve is a Poisson curve with rate = median count rate of data. |
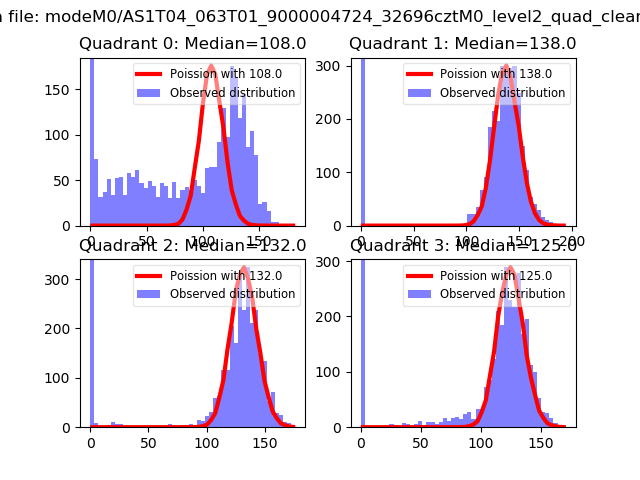 |
 |
| Quadrant-wise count rates Data is divided into 100 sec bins |
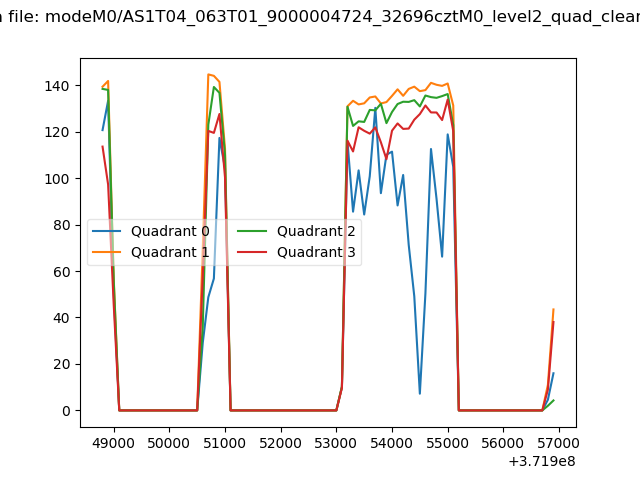 |
|
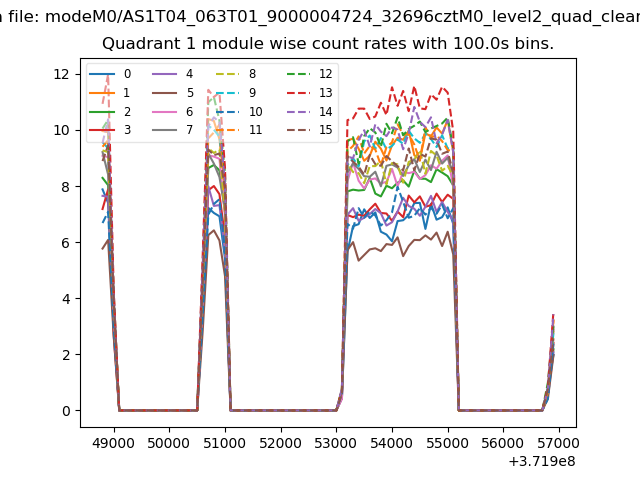
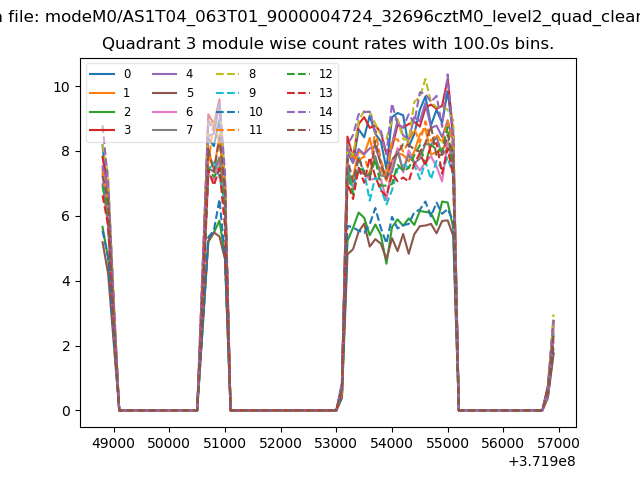
| Module-wise count rates for Quadrant A Data is divided into 100 sec bins |
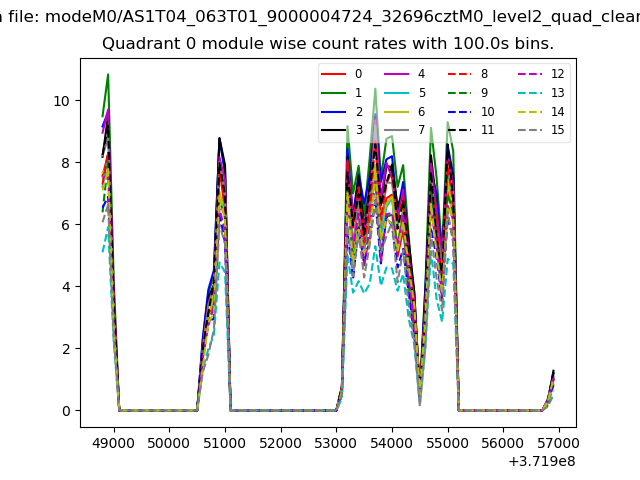 |
 |
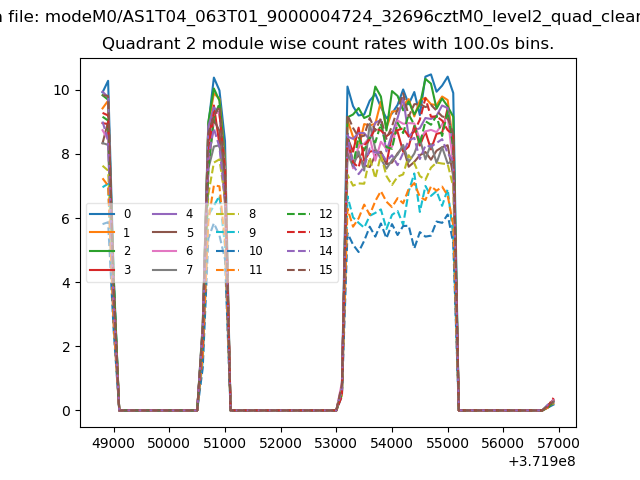
| Module-wise count rates for Quadrant B Data is divided into 100 sec bins |
 |
 |
| Module-wise count rates for Quadrant C Data is divided into 100 sec bins |
 |
 |
| Module-wise count rates for Quadrant D Data is divided into 100 sec bins |
 |
 |
| Parameter | Plot |
|---|---|
| CZT HV Monitor | 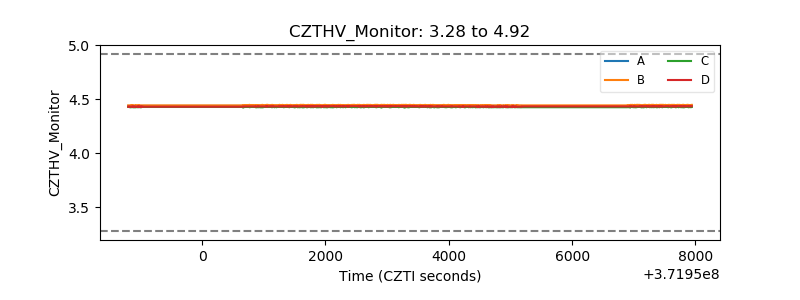 |
| D_VDD | 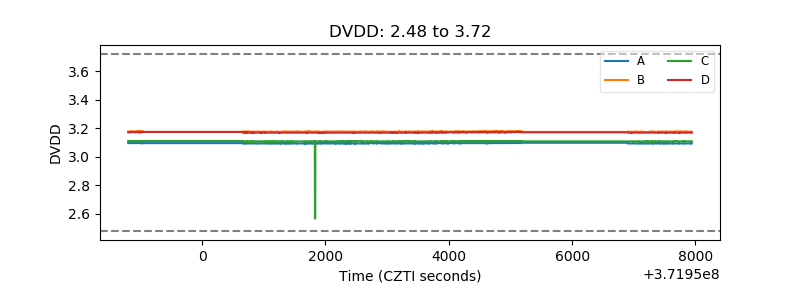 |
| Temperature 1 | 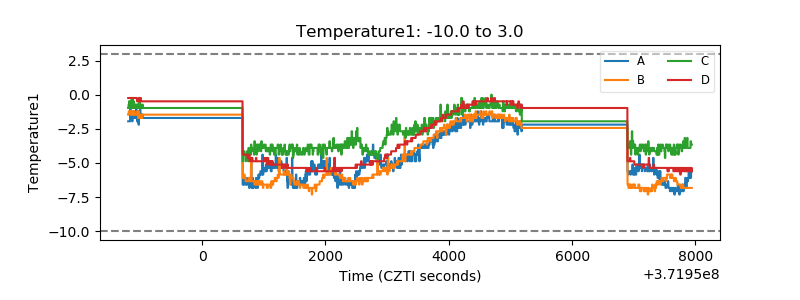 |
| Veto HV Monitor | 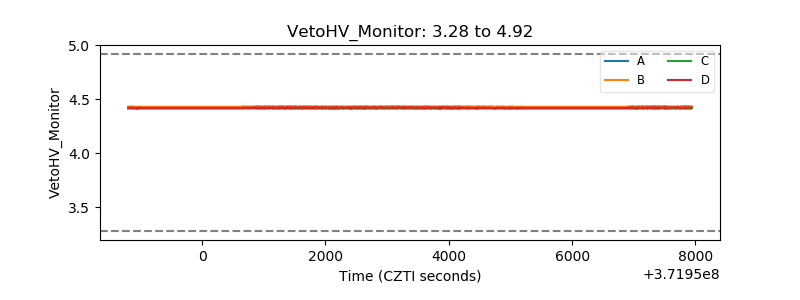 |
| Veto LLD | 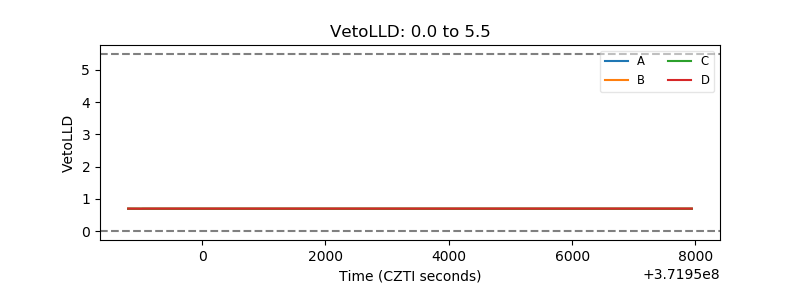 |
| Alpha Counter | 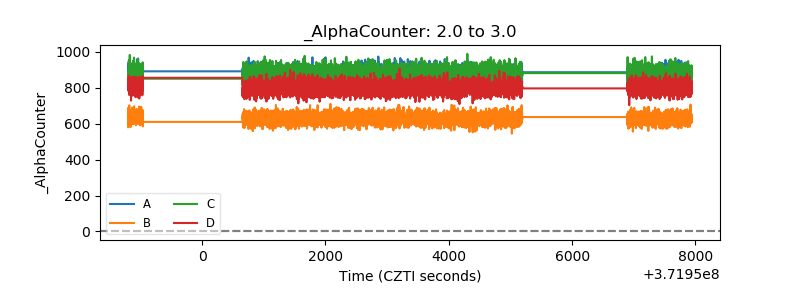 |
| _CPM_Rate | 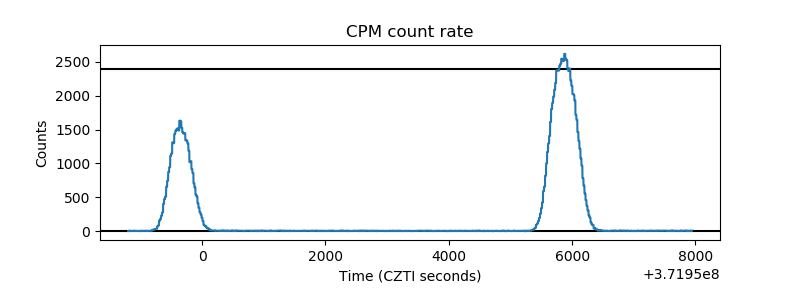 |
| CZT Counter | 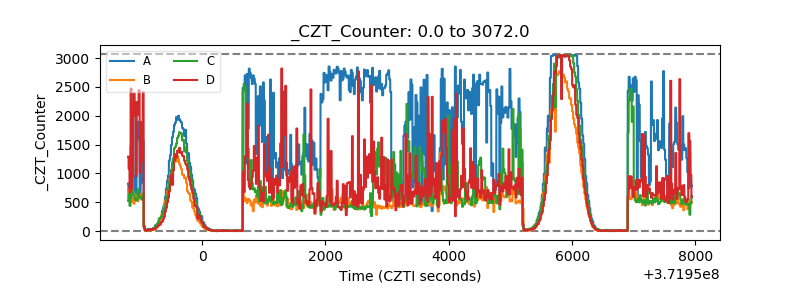 |
| +2.5 Volts monitor |  |
| +5 Volts monitor |  |
| _ROLL_ROT | 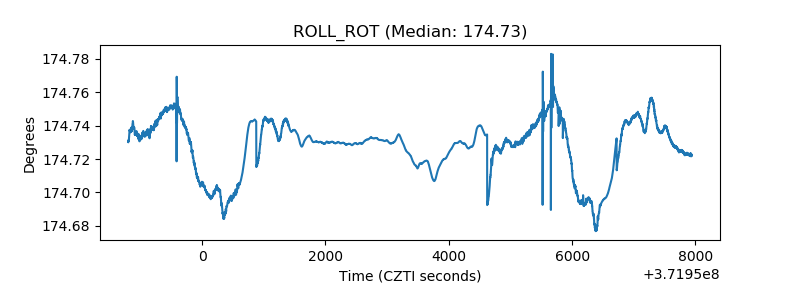 |
| _Roll_DEC | 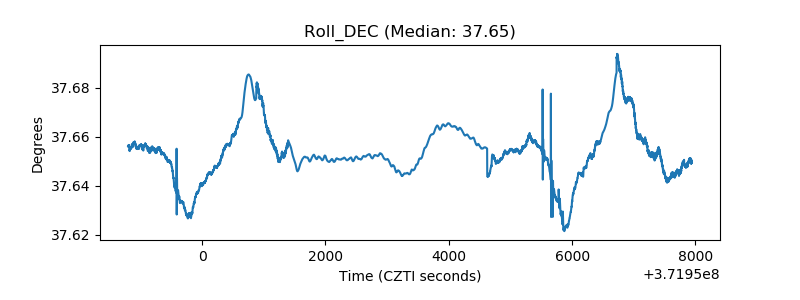 |
| _Roll_RA | 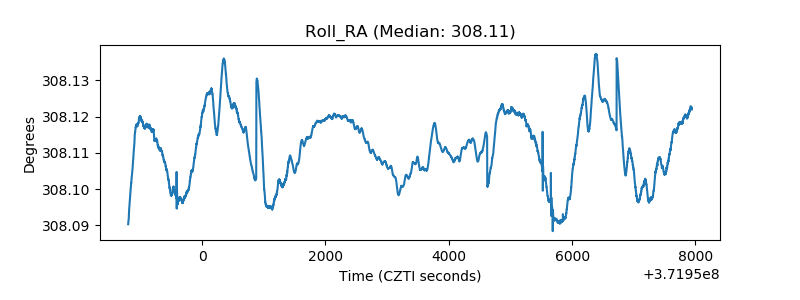 |
| Veto Counter | 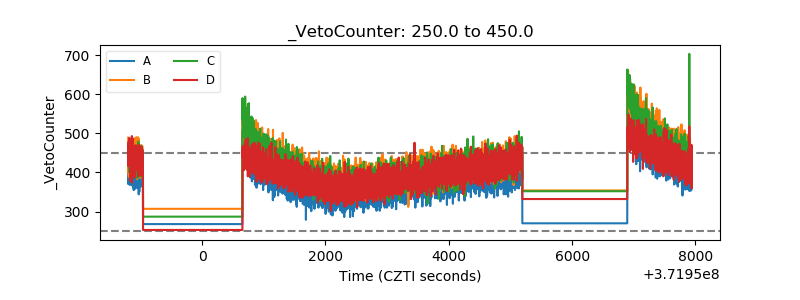 |