| Param | Original file | Final file |
|---|---|---|
| Filename | modeM0/AS1T04_063T01_9000004724_32698cztM0_level2.evt | modeM0/AS1T04_063T01_9000004724_32698cztM0_level2_quad_clean.evt |
| Size (bytes) | 550,972,800 | 59,060,160 |
| Size | 525.4 MB | 56.3 MB |
| Events in quadrant A | 5,129,707 | 340,961 |
| Events in quadrant B | 3,069,292 | 381,657 |
| Events in quadrant C | 3,094,504 | 366,452 |
| Events in quadrant D | 5,044,083 | 337,436 |
| Mode SS | |||
|---|---|---|---|
| Quadrant | BADHDUFLAG | Total packets | Discarded packets |
| A | 0 | 104 | 0 |
| B | 0 | 104 | 0 |
| C | 0 | 104 | 0 |
| D | 0 | 104 | 0 |
| Mode M9 | |||
|---|---|---|---|
| Quadrant | BADHDUFLAG | Total packets | Discarded packets |
| A | 0 | 27 | 0 |
| B | 0 | 27 | 0 |
| C | 0 | 27 | 0 |
| D | 0 | 28 | 0 |
| Mode M0 | |||
|---|---|---|---|
| Quadrant | BADHDUFLAG | Total packets | Discarded packets |
| A | 0 | 18609 | 3 |
| B | 0 | 12280 | 2 |
| C | 0 | 12280 | 2 |
| D | 0 | 18634 | 2 |
| Quadrant | Total seconds | Saturated seconds | Saturation percentage |
|---|---|---|---|
| A | 5162 | 801 | 15.517241% |
| B | 5162 | 34 | 0.658659% |
| C | 5162 | 84 | 1.627276% |
| D | 5162 | 366 | 7.090275% |
Noise dominated data is calculated using 1-second bins in cleaned event files. If a bin has >2000 counts, and if more than 50% of those come from <1% of pixels, then it is considered to be noise-dominated and hence unusable.
| Quadrant | # 1 sec bins | Bins with >0 counts | Bins with >2000 counts | High rate bins dominated by noise | Noise dominated (total time) | Noise dominated (detector-on time) | Marked lightcurve |
|---|---|---|---|---|---|---|---|
| A | 7135 | 5163 | 616 | 616 | 8.63% | 11.93% | 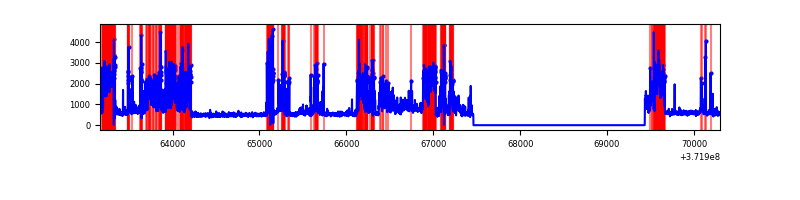 |
| B | 7135 | 5163 | 16 | 16 | 0.22% | 0.31% | 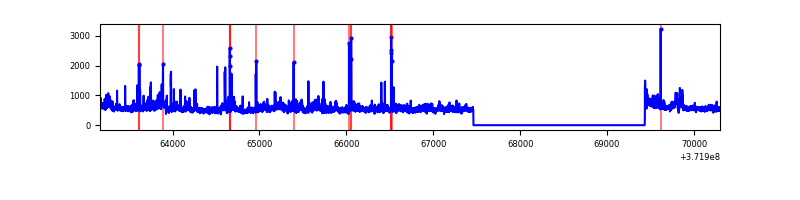 |
| C | 7135 | 5163 | 67 | 67 | 0.94% | 1.30% | 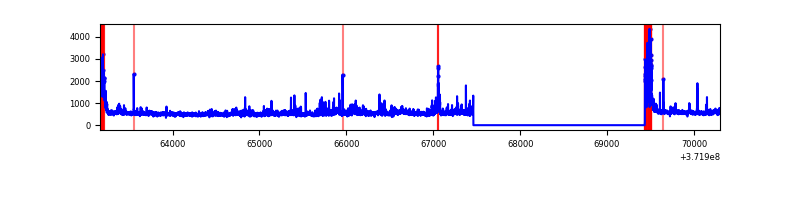 |
| D | 7135 | 5163 | 305 | 305 | 4.27% | 5.91% | 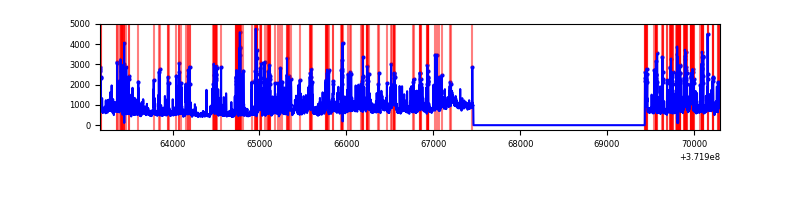 |
Top three noisy pixels from each quadrant. If the there are fewer than three noisy pixels in the level2.evt file, extra rows are filled as -1
| Pixel properties | Quadrant properties | ||||||
|---|---|---|---|---|---|---|---|
| Quadrant | DetID | PixID | Counts | Sigma | Mean | Median | Sigma |
| A | 15 | 249 | 2591382 | 20397.22 | 635 | 624 | 127.0 |
| A | 12 | 247 | 26692 | 205.24 | 635 | 624 | 127.0 |
| A | 0 | 159 | 15692 | 118.63 | 635 | 624 | 127.0 |
| B | 0 | 219 | 176438 | 1394.88 | 684 | 675 | 126.0 |
| B | 3 | 26 | 73326 | 576.57 | 684 | 675 | 126.0 |
| B | 0 | 230 | 48321 | 378.12 | 684 | 675 | 126.0 |
| C | 0 | 10 | 394299 | 2632.85 | 646 | 652 | 149.5 |
| C | 3 | 233 | 47297 | 311.98 | 646 | 652 | 149.5 |
| C | 0 | 207 | 43029 | 283.43 | 646 | 652 | 149.5 |
| D | 7 | 80 | 573542 | 3872.85 | 627 | 616 | 147.9 |
| D | 8 | 195 | 433988 | 2929.5 | 627 | 616 | 147.9 |
| D | 2 | 249 | 432855 | 2921.84 | 627 | 616 | 147.9 |
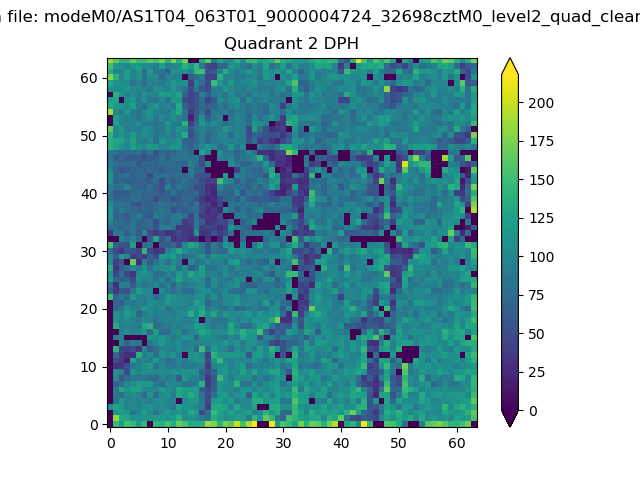
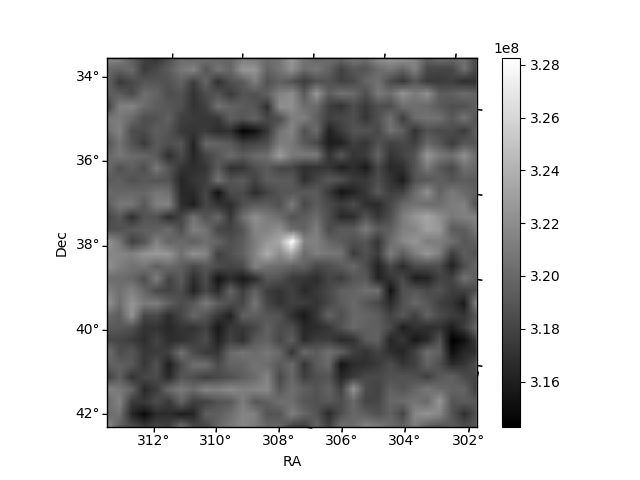
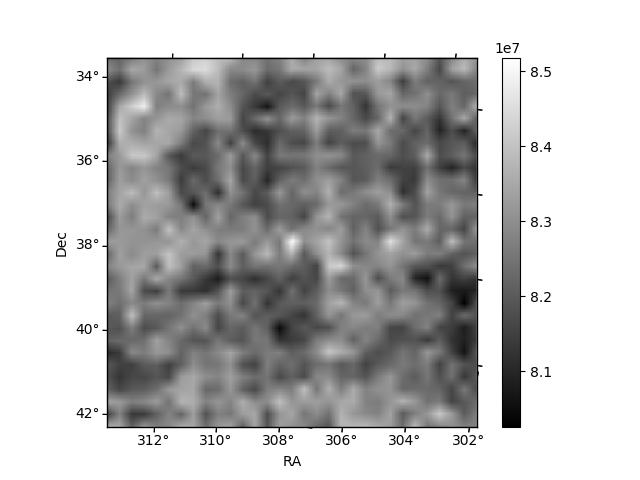
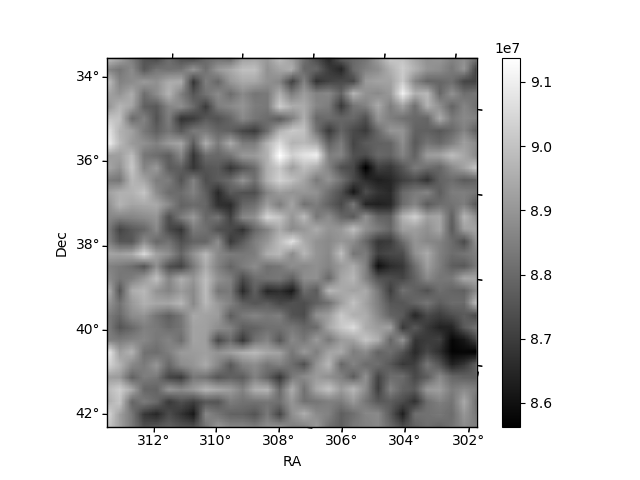
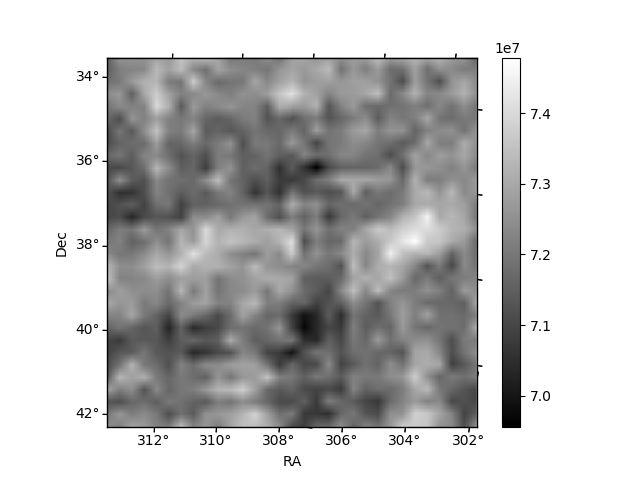
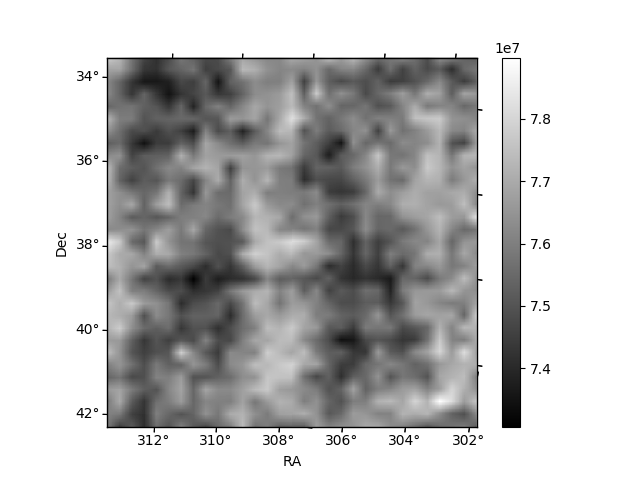
Histogram calculated using DETX and DETY for each event in the final _common_clean file
| Quadrant A | 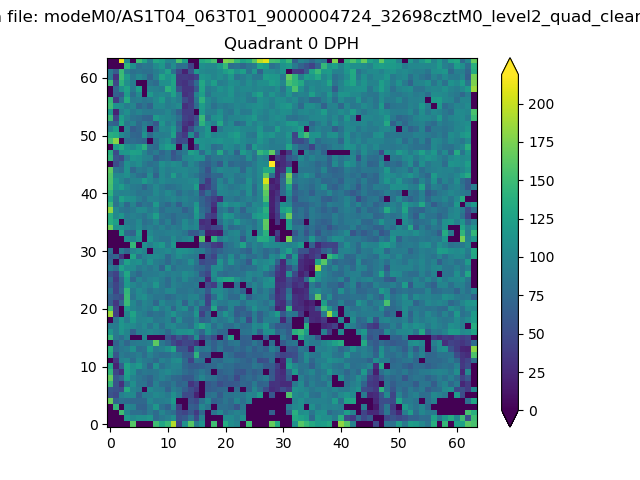 |
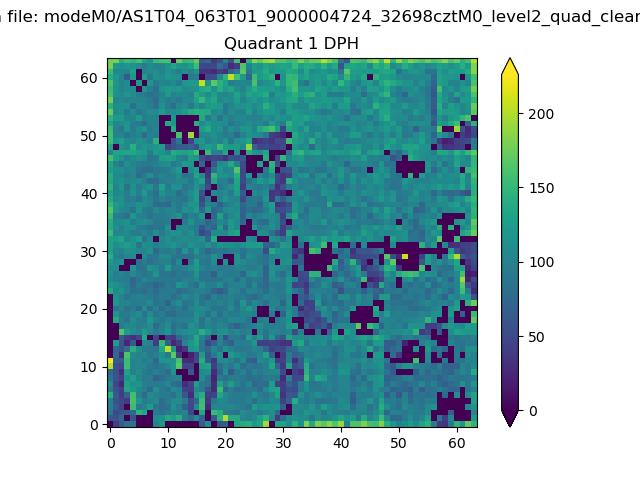 |
Quadrant B |
|---|---|---|---|
| Quadrant D | 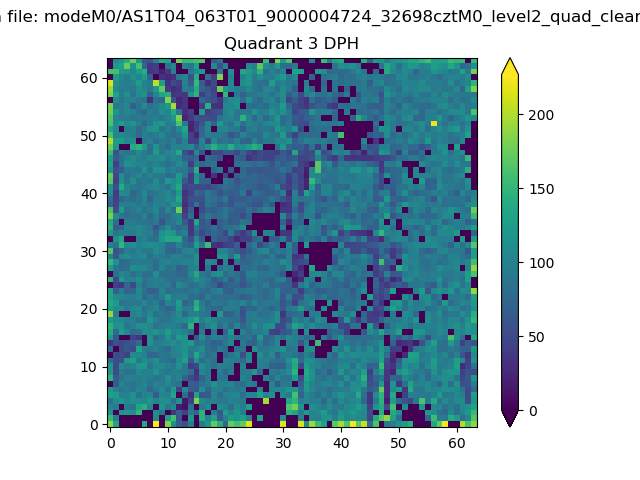 |
 |
Quadrant C |
| Plot type | Count rate plots | Images |
|---|---|---|
| Comparison with Poisson distribution Blue bars denote a histogram of data divided into 1 sec bins. Red curve is a Poisson curve with rate = median count rate of data. |
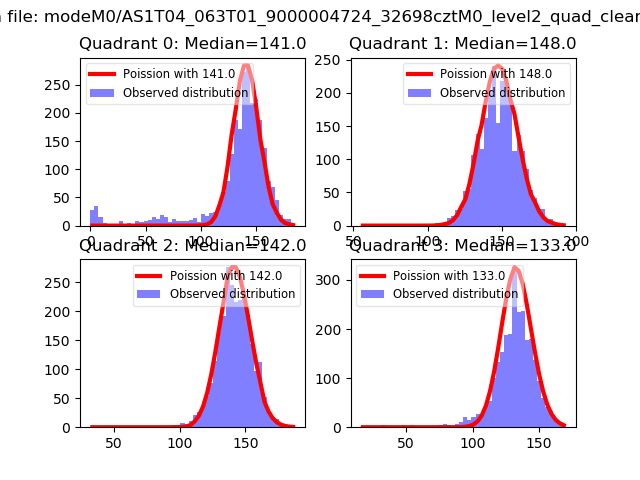 |
 |
| Quadrant-wise count rates Data is divided into 100 sec bins |
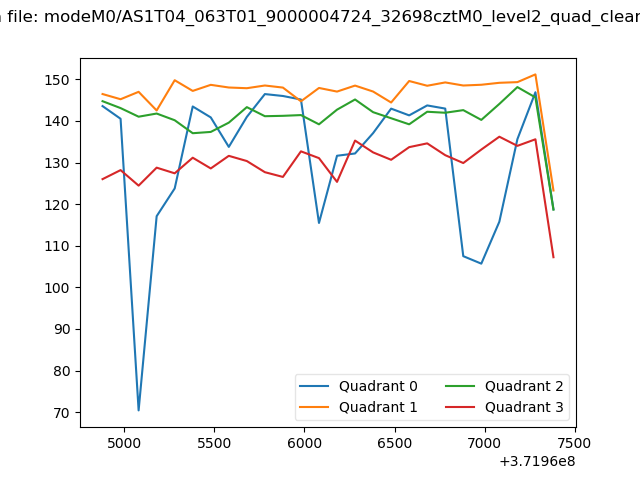 |
|
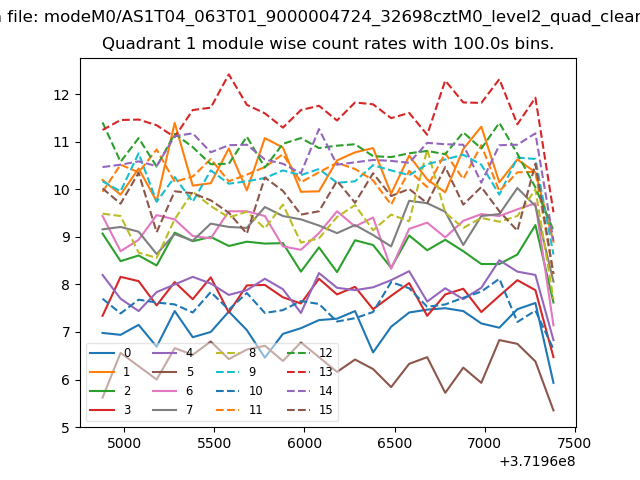
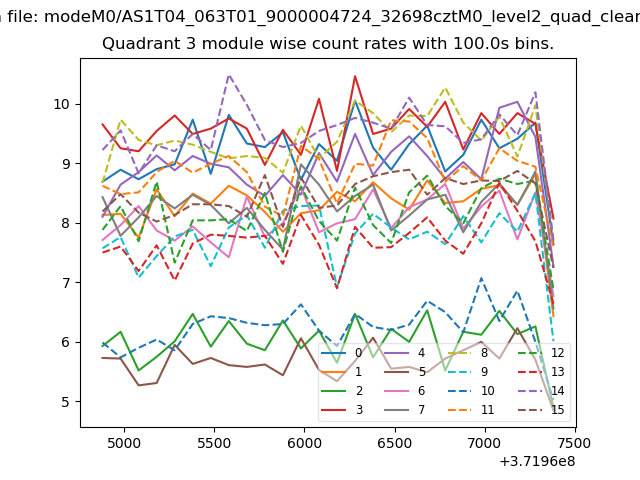
| Module-wise count rates for Quadrant A Data is divided into 100 sec bins |
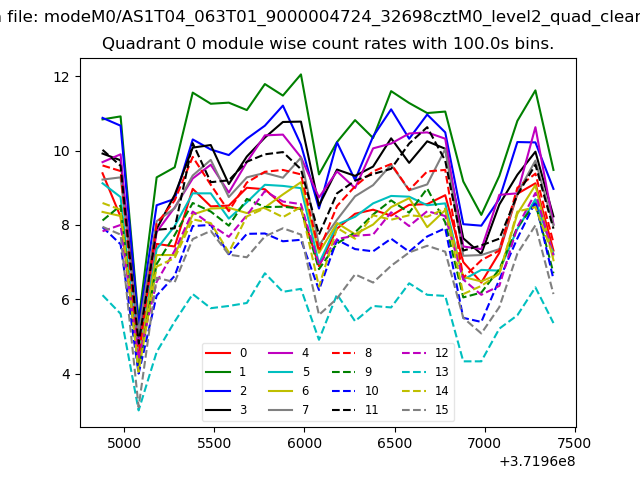 |
 |
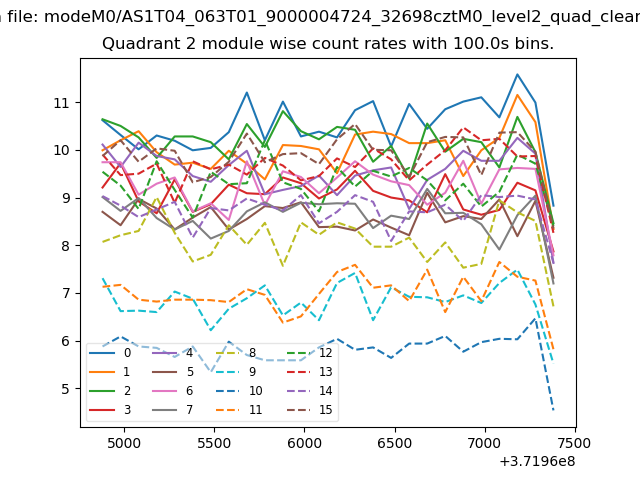
| Module-wise count rates for Quadrant B Data is divided into 100 sec bins |
 |
 |
| Module-wise count rates for Quadrant C Data is divided into 100 sec bins |
 |
 |
| Module-wise count rates for Quadrant D Data is divided into 100 sec bins |
 |
 |
| Parameter | Plot |
|---|---|
| CZT HV Monitor | 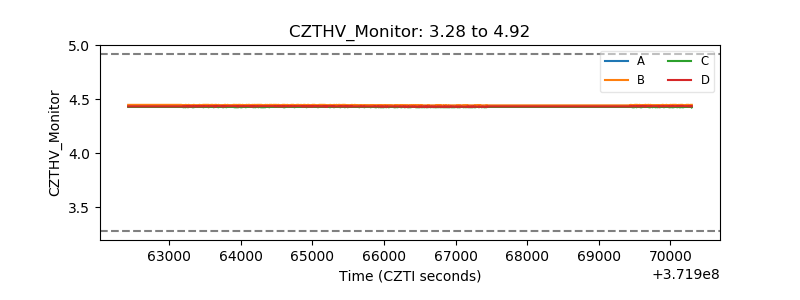 |
| D_VDD | 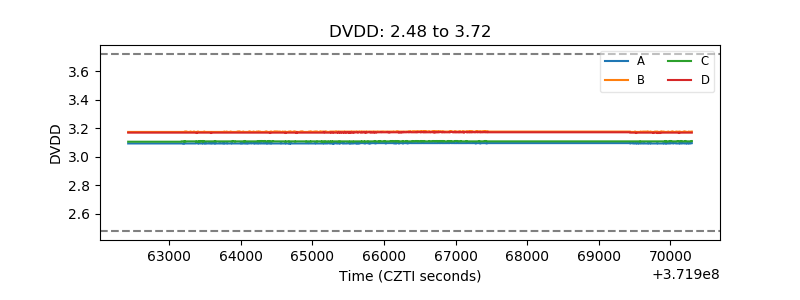 |
| Temperature 1 | 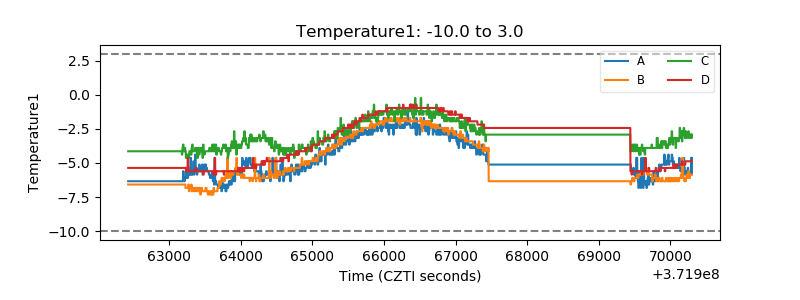 |
| Veto HV Monitor | 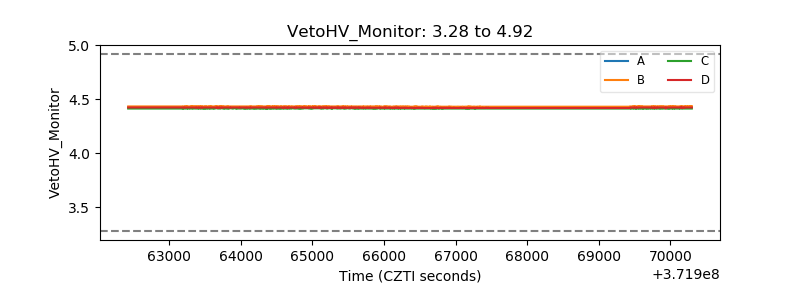 |
| Veto LLD | 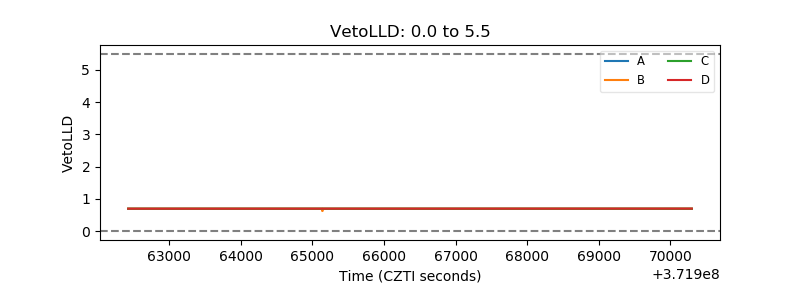 |
| Alpha Counter | 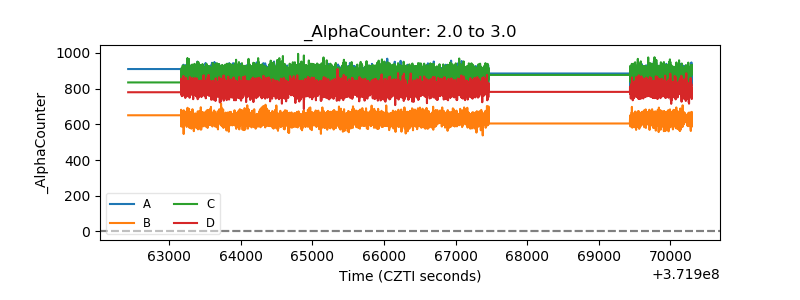 |
| _CPM_Rate | 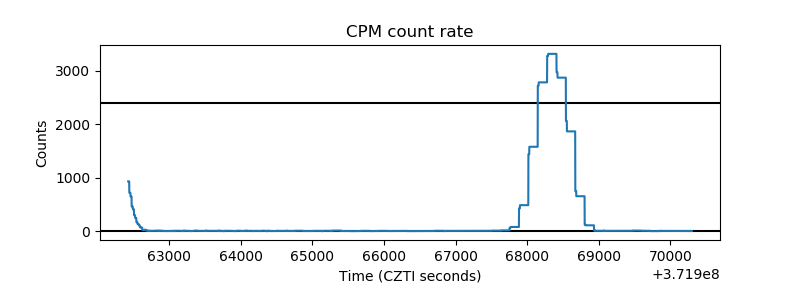 |
| CZT Counter | 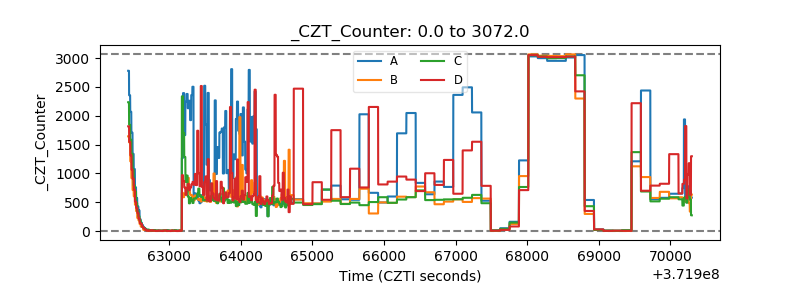 |
| +2.5 Volts monitor |  |
| +5 Volts monitor |  |
| _ROLL_ROT | 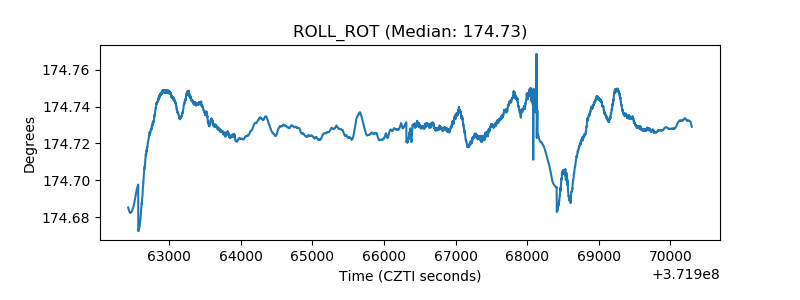 |
| _Roll_DEC | 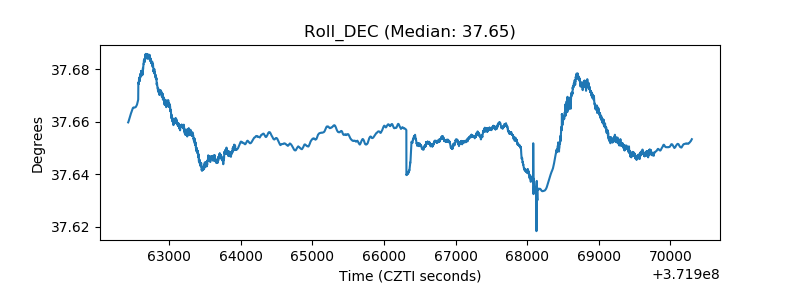 |
| _Roll_RA | 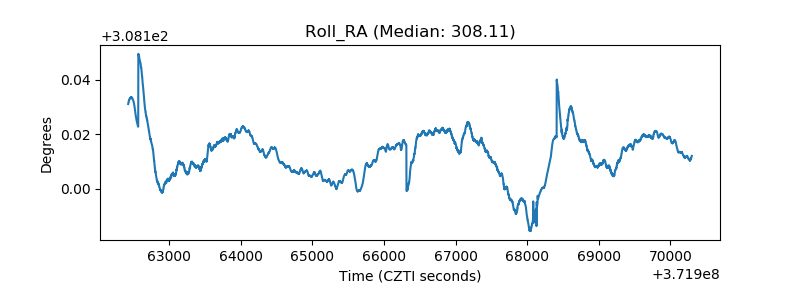 |
| Veto Counter | 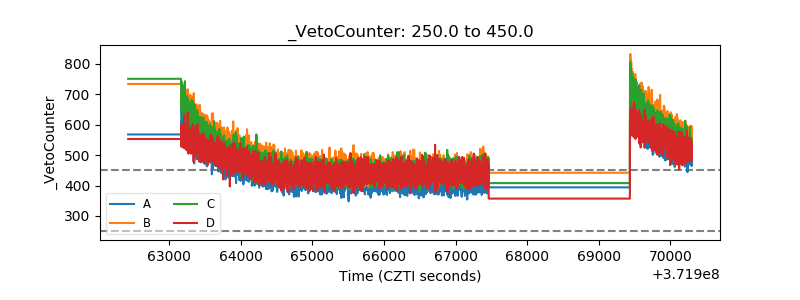 |