| Param | Original file | Final file |
|---|---|---|
| Filename | modeM0/AS1T04_063T01_9000004724_32700cztM0_level2.evt | modeM0/AS1T04_063T01_9000004724_32700cztM0_level2_quad_clean.evt |
| Size (bytes) | 531,158,400 | 82,681,920 |
| Size | 506.6 MB | 78.9 MB |
| Events in quadrant A | 3,332,819 | 560,450 |
| Events in quadrant B | 3,177,566 | 573,097 |
| Events in quadrant C | 3,171,691 | 540,345 |
| Events in quadrant D | 6,067,786 | 481,209 |
| Mode SS | |||
|---|---|---|---|
| Quadrant | BADHDUFLAG | Total packets | Discarded packets |
| A | 0 | 102 | 0 |
| B | 0 | 102 | 0 |
| C | 0 | 102 | 0 |
| D | 0 | 102 | 0 |
| Mode M9 | |||
|---|---|---|---|
| Quadrant | BADHDUFLAG | Total packets | Discarded packets |
| A | 0 | 35 | 0 |
| B | 0 | 35 | 0 |
| C | 0 | 35 | 0 |
| D | 0 | 36 | 0 |
| Mode M0 | |||
|---|---|---|---|
| Quadrant | BADHDUFLAG | Total packets | Discarded packets |
| A | 0 | 12841 | 3 |
| B | 0 | 12761 | 2 |
| C | 0 | 12293 | 2 |
| D | 0 | 21654 | 2 |
| Quadrant | Total seconds | Saturated seconds | Saturation percentage |
|---|---|---|---|
| A | 4969 | 99 | 1.992353% |
| B | 4969 | 45 | 0.905615% |
| C | 4969 | 154 | 3.099215% |
| D | 4969 | 892 | 17.951298% |
Noise dominated data is calculated using 1-second bins in cleaned event files. If a bin has >2000 counts, and if more than 50% of those come from <1% of pixels, then it is considered to be noise-dominated and hence unusable.
| Quadrant | # 1 sec bins | Bins with >0 counts | Bins with >2000 counts | High rate bins dominated by noise | Noise dominated (total time) | Noise dominated (detector-on time) | Marked lightcurve |
|---|---|---|---|---|---|---|---|
| A | 7093 | 4970 | 52 | 52 | 0.73% | 1.05% | 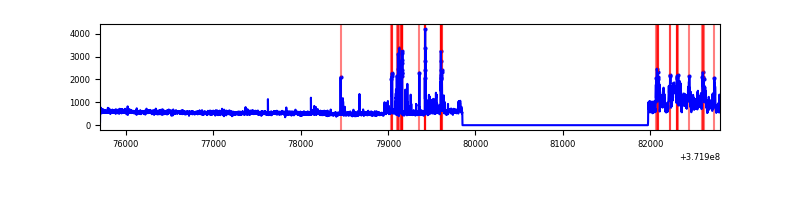 |
| B | 7093 | 4970 | 20 | 20 | 0.28% | 0.40% | 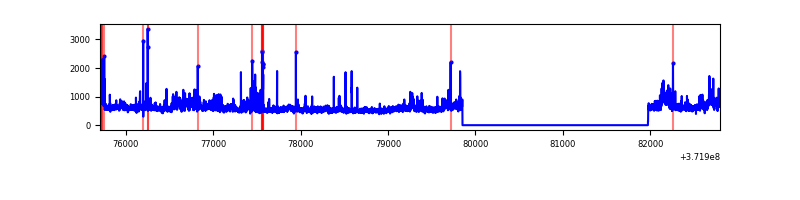 |
| C | 7093 | 4970 | 116 | 116 | 1.64% | 2.33% | 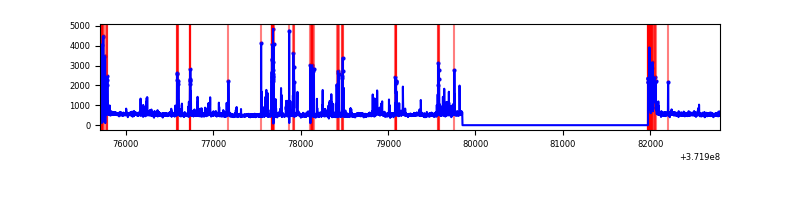 |
| D | 7093 | 4970 | 812 | 812 | 11.45% | 16.34% | 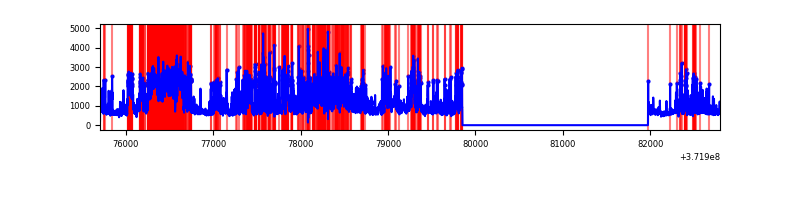 |
Top three noisy pixels from each quadrant. If the there are fewer than three noisy pixels in the level2.evt file, extra rows are filled as -1
| Pixel properties | Quadrant properties | ||||||
|---|---|---|---|---|---|---|---|
| Quadrant | DetID | PixID | Counts | Sigma | Mean | Median | Sigma |
| A | 15 | 249 | 680665 | 5153.59 | 666 | 656 | 131.9 |
| A | 0 | 159 | 24015 | 177.03 | 666 | 656 | 131.9 |
| A | 13 | 6 | 15304 | 111.01 | 666 | 656 | 131.9 |
| B | 0 | 219 | 253579 | 2027.23 | 669 | 657 | 124.8 |
| B | 5 | 172 | 67345 | 534.52 | 669 | 657 | 124.8 |
| B | 0 | 230 | 63830 | 506.35 | 669 | 657 | 124.8 |
| C | 0 | 10 | 351220 | 2445.41 | 623 | 630 | 143.4 |
| C | 6 | 247 | 172083 | 1195.91 | 623 | 630 | 143.4 |
| C | 0 | 207 | 72169 | 498.99 | 623 | 630 | 143.4 |
| D | 7 | 80 | 1183880 | 8342.61 | 599 | 588 | 141.8 |
| D | 2 | 249 | 689244 | 4855.26 | 599 | 588 | 141.8 |
| D | 12 | 33 | 392700 | 2764.52 | 599 | 588 | 141.8 |
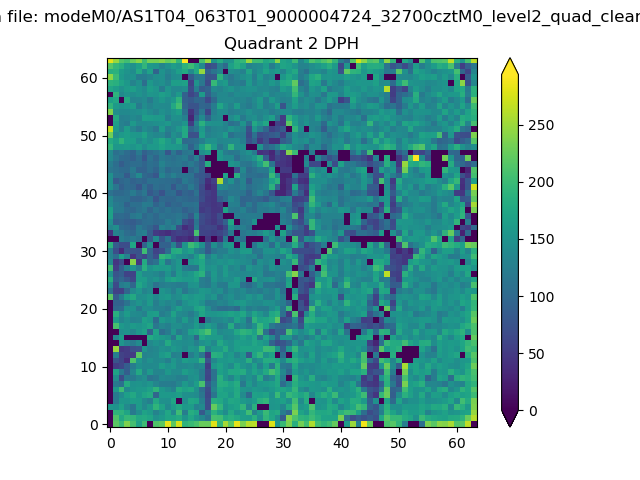
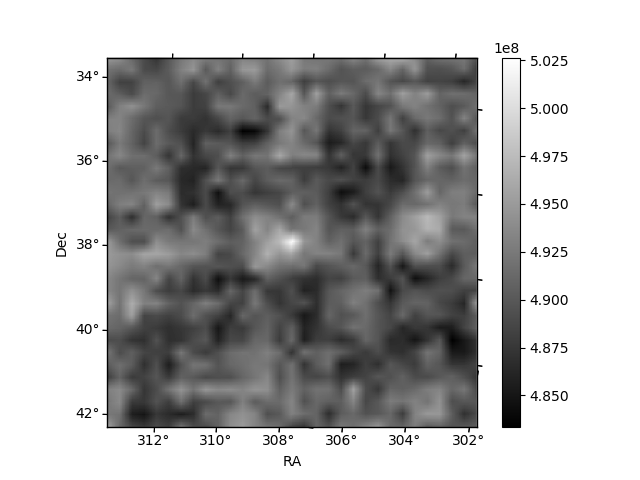
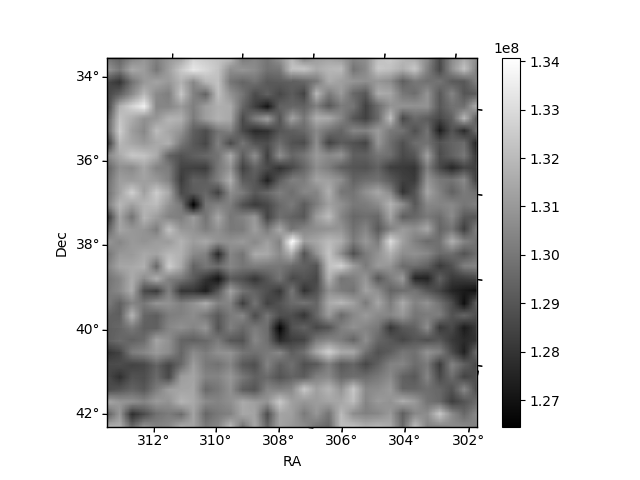
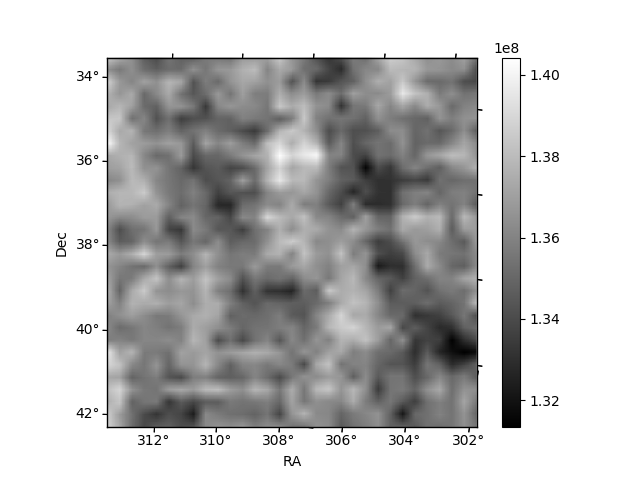
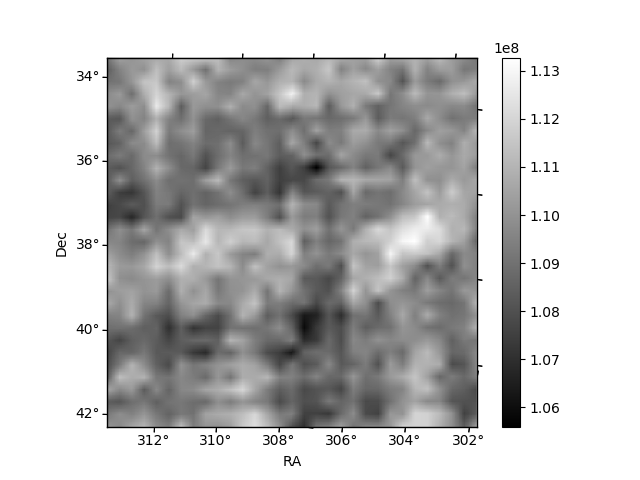
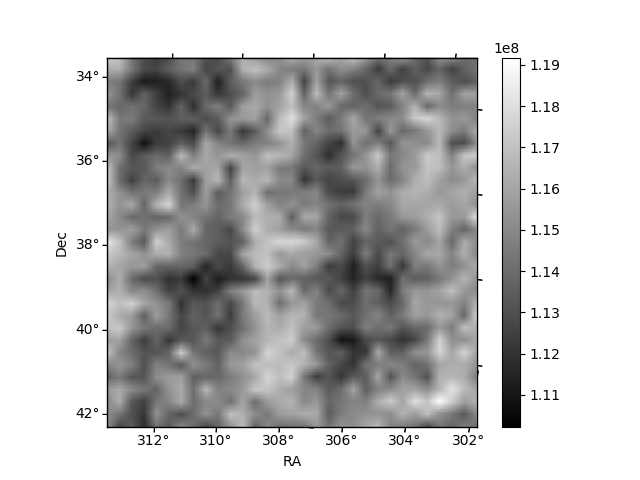
Histogram calculated using DETX and DETY for each event in the final _common_clean file
| Quadrant A | 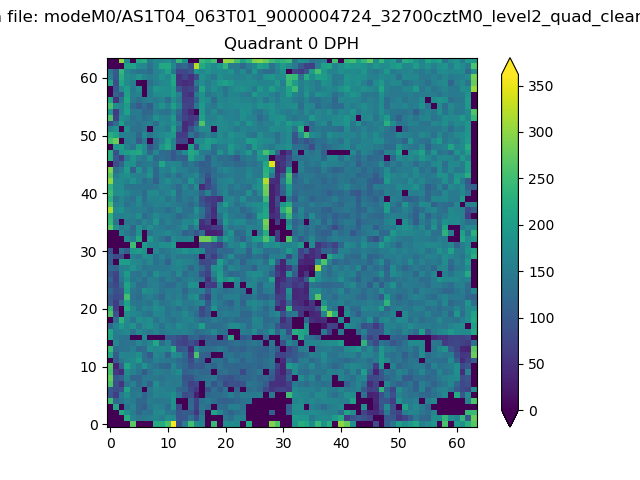 |
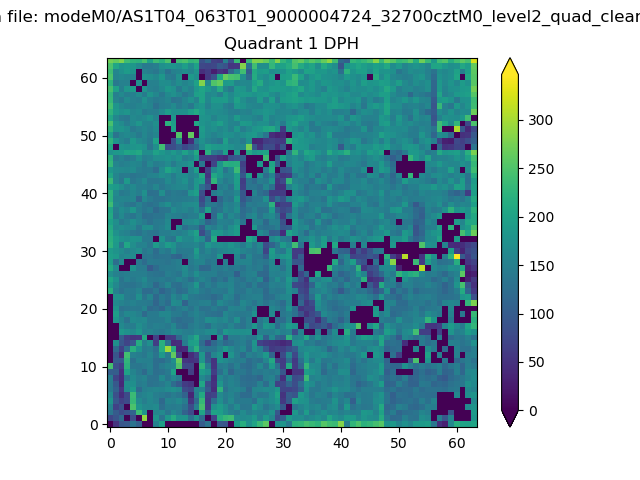 |
Quadrant B |
|---|---|---|---|
| Quadrant D | 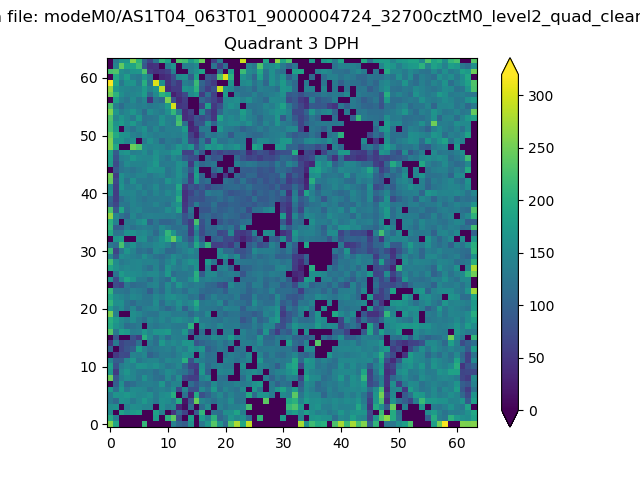 |
 |
Quadrant C |
| Plot type | Count rate plots | Images |
|---|---|---|
| Comparison with Poisson distribution Blue bars denote a histogram of data divided into 1 sec bins. Red curve is a Poisson curve with rate = median count rate of data. |
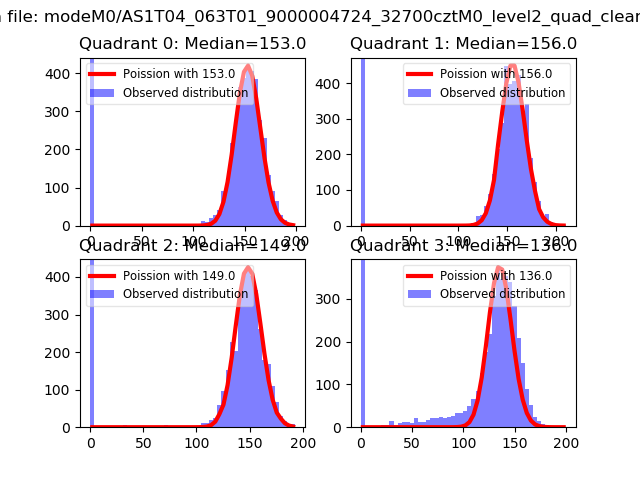 |
 |
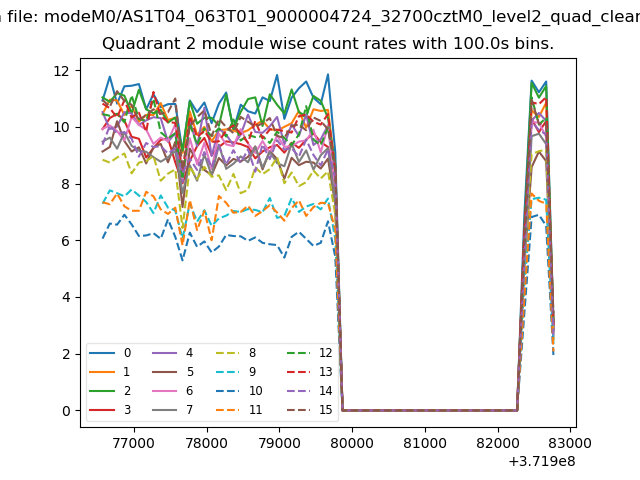
| Quadrant-wise count rates Data is divided into 100 sec bins |
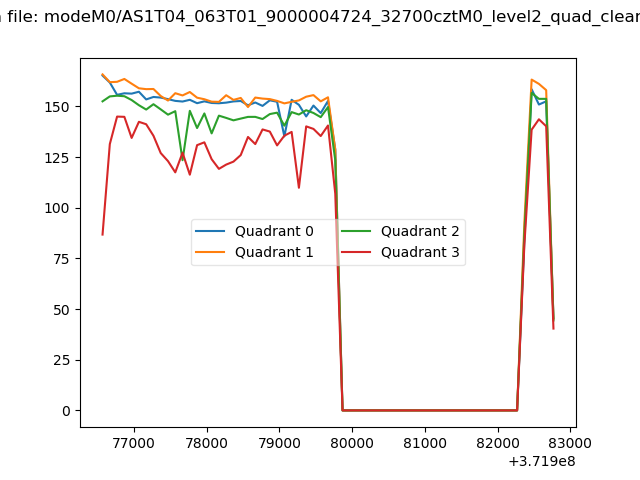 |
|
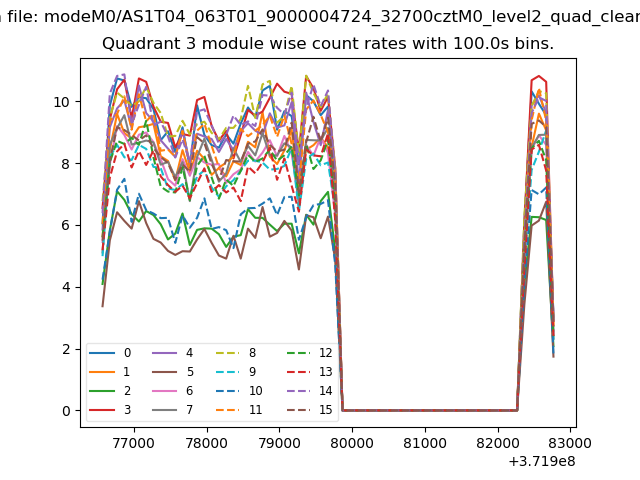
| Module-wise count rates for Quadrant A Data is divided into 100 sec bins |
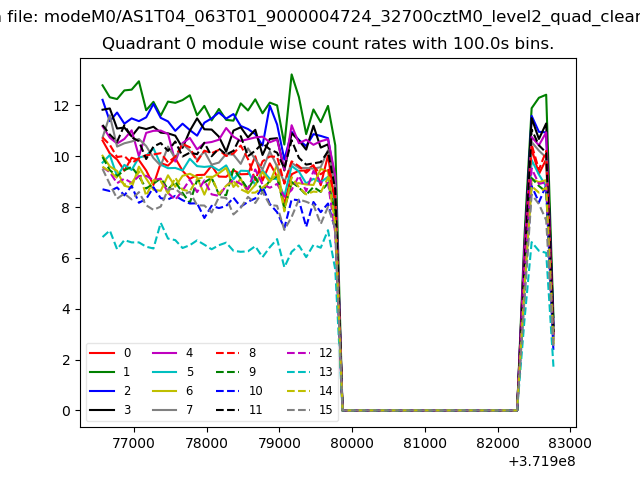 |
 |
| Module-wise count rates for Quadrant B Data is divided into 100 sec bins |
 |
 |
| Module-wise count rates for Quadrant C Data is divided into 100 sec bins |
 |
 |
| Module-wise count rates for Quadrant D Data is divided into 100 sec bins |
 |
 |
| Parameter | Plot |
|---|---|
| CZT HV Monitor | 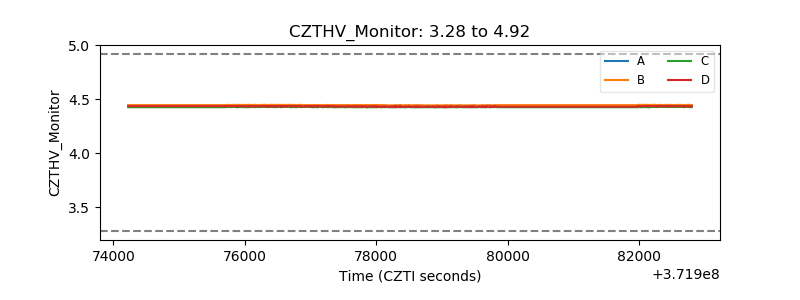 |
| D_VDD | 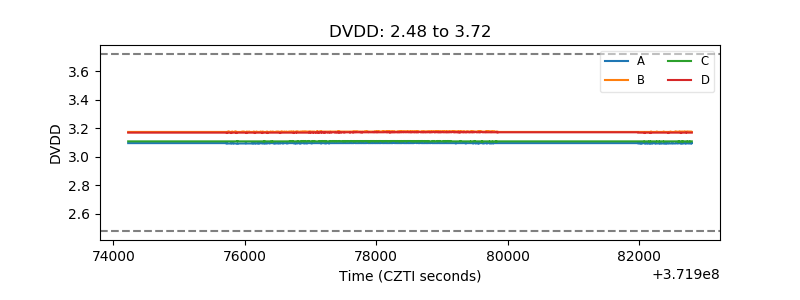 |
| Temperature 1 | 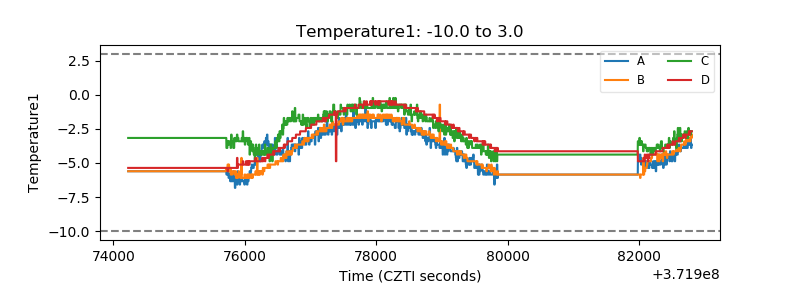 |
| Veto HV Monitor | 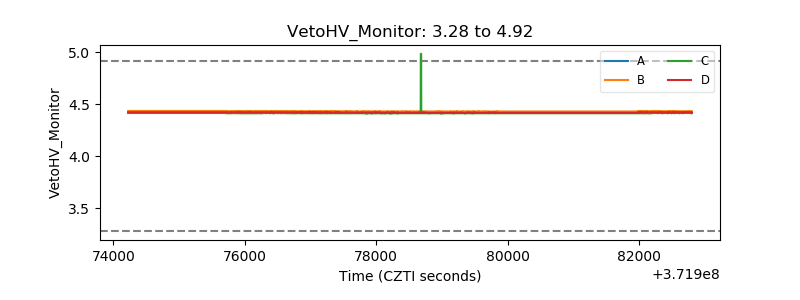 |
| Veto LLD | 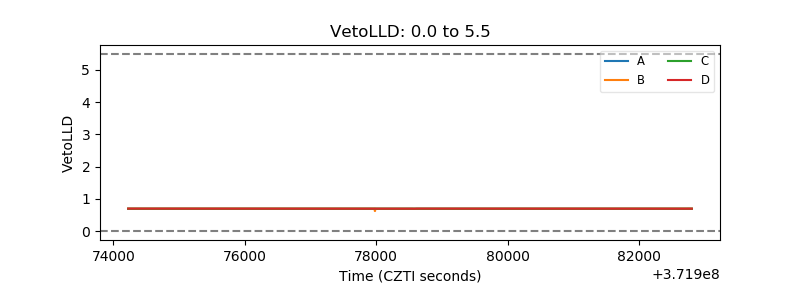 |
| Alpha Counter | 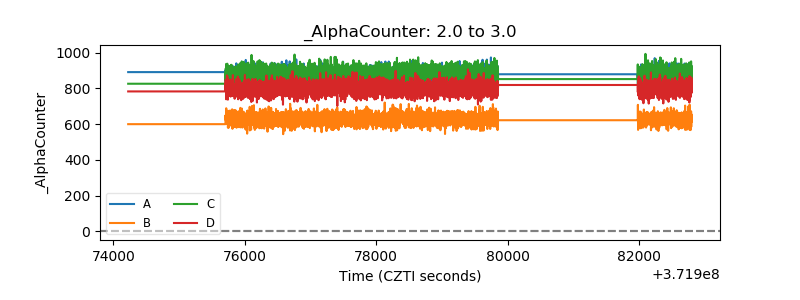 |
| _CPM_Rate | 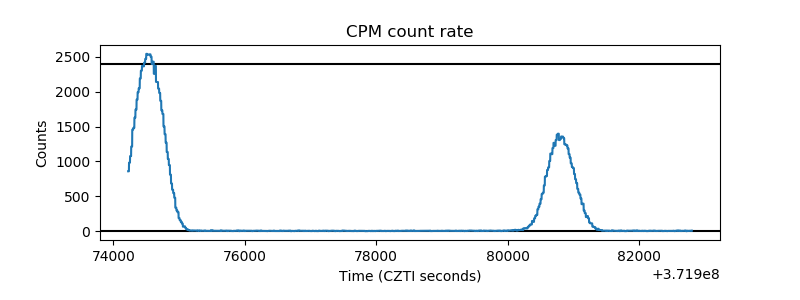 |
| CZT Counter | 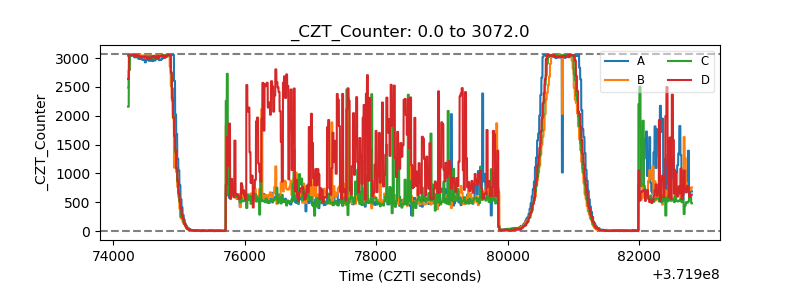 |
| +2.5 Volts monitor | 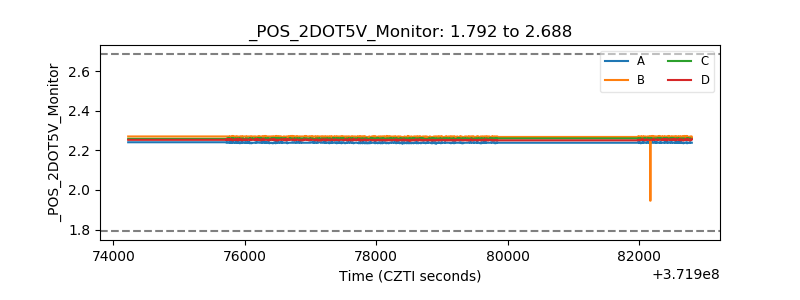 |
| +5 Volts monitor | 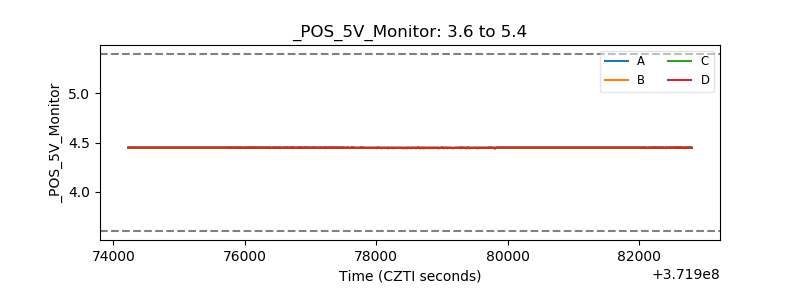 |
| _ROLL_ROT | 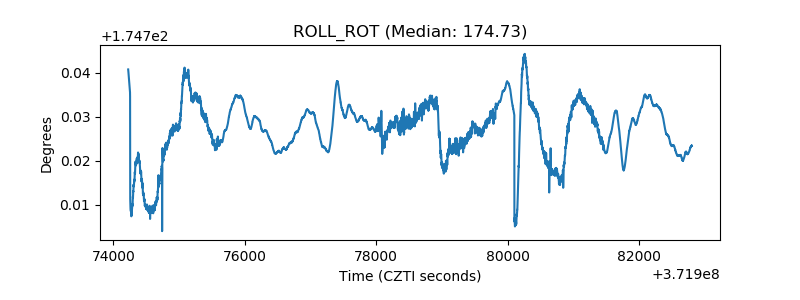 |
| _Roll_DEC | 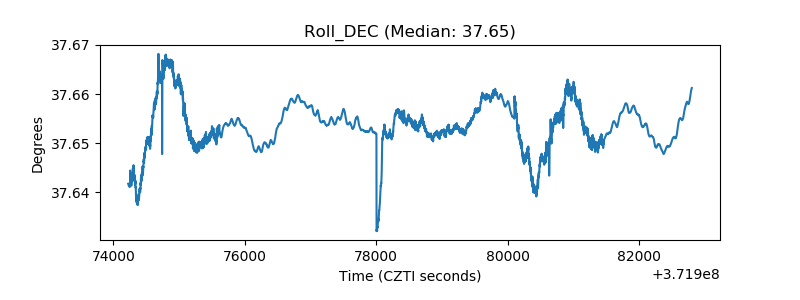 |
| _Roll_RA | 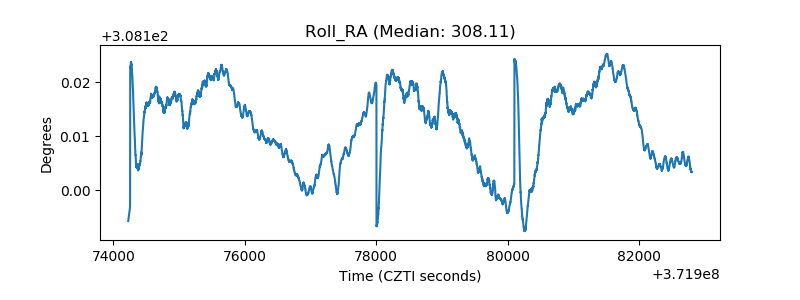 |
| Veto Counter | 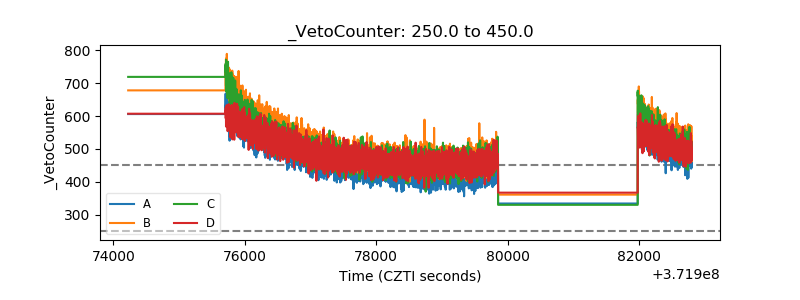 |