| Param | Original file | Final file |
|---|---|---|
| Filename | modeM0/AS1T04_063T01_9000004724_32701cztM0_level2.evt | modeM0/AS1T04_063T01_9000004724_32701cztM0_level2_quad_clean.evt |
| Size (bytes) | 1,827,630,720 | 289,212,480 |
| Size | 1.7 GB | 275.8 MB |
| Events in quadrant A | 13,023,371 | 1,934,202 |
| Events in quadrant B | 10,128,570 | 2,023,187 |
| Events in quadrant C | 10,593,048 | 1,920,299 |
| Events in quadrant D | 20,457,003 | 1,702,693 |
| Mode SS | |||
|---|---|---|---|
| Quadrant | BADHDUFLAG | Total packets | Discarded packets |
| A | 0 | 350 | 0 |
| B | 0 | 350 | 0 |
| C | 0 | 350 | 0 |
| D | 0 | 350 | 0 |
| Mode M9 | |||
|---|---|---|---|
| Quadrant | BADHDUFLAG | Total packets | Discarded packets |
| A | 0 | 82 | 0 |
| B | 0 | 82 | 0 |
| C | 0 | 82 | 0 |
| D | 0 | 82 | 0 |
| Mode M0 | |||
|---|---|---|---|
| Quadrant | BADHDUFLAG | Total packets | Discarded packets |
| A | 0 | 49262 | 5 |
| B | 0 | 40545 | 4 |
| C | 0 | 41618 | 4 |
| D | 0 | 73036 | 4 |
| Quadrant | Total seconds | Saturated seconds | Saturation percentage |
|---|---|---|---|
| A | 17100 | 967 | 5.654971% |
| B | 17100 | 98 | 0.573099% |
| C | 17100 | 364 | 2.128655% |
| D | 17100 | 2645 | 15.467836% |
Noise dominated data is calculated using 1-second bins in cleaned event files. If a bin has >2000 counts, and if more than 50% of those come from <1% of pixels, then it is considered to be noise-dominated and hence unusable.
| Quadrant | # 1 sec bins | Bins with >0 counts | Bins with >2000 counts | High rate bins dominated by noise | Noise dominated (total time) | Noise dominated (detector-on time) | Marked lightcurve |
|---|---|---|---|---|---|---|---|
| A | 25354 | 17104 | 689 | 689 | 2.72% | 4.03% |  |
| B | 25354 | 17104 | 43 | 43 | 0.17% | 0.25% | 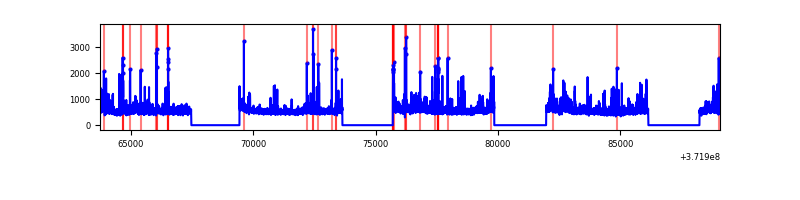 |
| C | 25354 | 17104 | 277 | 277 | 1.09% | 1.62% | 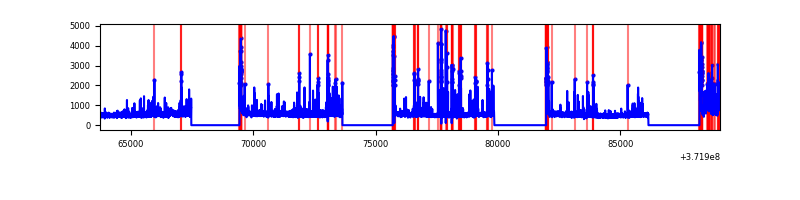 |
| D | 25354 | 17104 | 2395 | 2395 | 9.45% | 14.00% | 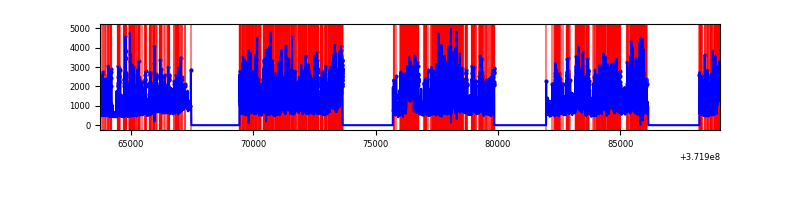 |
Top three noisy pixels from each quadrant. If the there are fewer than three noisy pixels in the level2.evt file, extra rows are filled as -1
| Pixel properties | Quadrant properties | ||||||
|---|---|---|---|---|---|---|---|
| Quadrant | DetID | PixID | Counts | Sigma | Mean | Median | Sigma |
| A | 15 | 249 | 4224094 | 9789.72 | 2192 | 2166 | 431.3 |
| A | 12 | 247 | 93275 | 211.26 | 2192 | 2166 | 431.3 |
| A | 0 | 159 | 59550 | 133.06 | 2192 | 2166 | 431.3 |
| B | 0 | 219 | 546005 | 1320.33 | 2243 | 2204 | 411.9 |
| B | 0 | 230 | 188690 | 452.78 | 2243 | 2204 | 411.9 |
| B | 3 | 26 | 171916 | 412.05 | 2243 | 2204 | 411.9 |
| C | 0 | 10 | 1168993 | 2424.83 | 2112 | 2136 | 481.2 |
| C | 3 | 233 | 411433 | 850.56 | 2112 | 2136 | 481.2 |
| C | 0 | 207 | 229434 | 472.35 | 2112 | 2136 | 481.2 |
| D | 7 | 80 | 3516212 | 7355.03 | 2018 | 1985 | 477.8 |
| D | 2 | 249 | 1908601 | 3990.41 | 2018 | 1985 | 477.8 |
| D | 8 | 195 | 1376820 | 2877.43 | 2018 | 1985 | 477.8 |
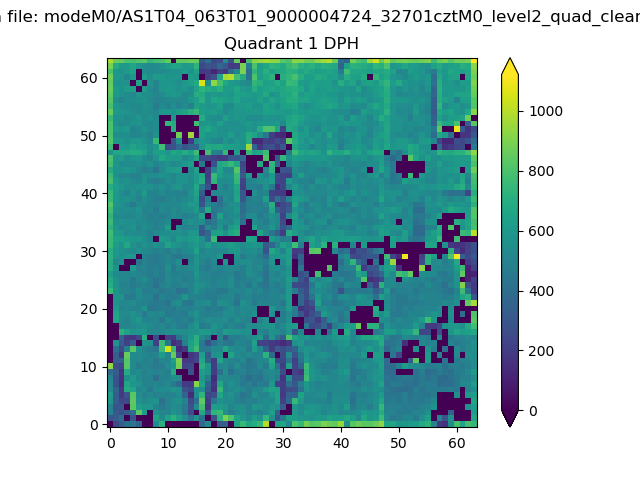
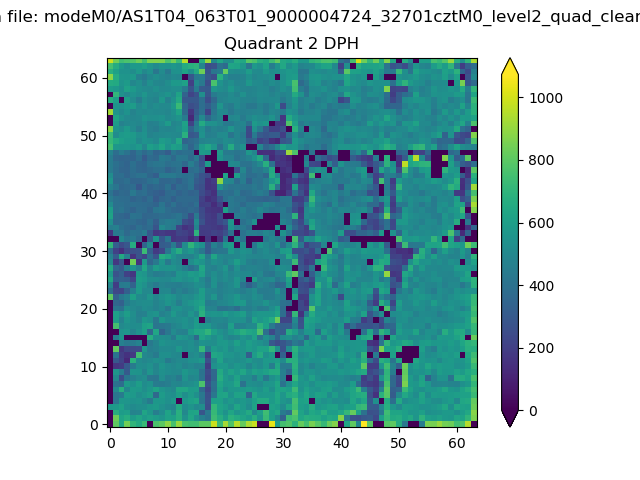
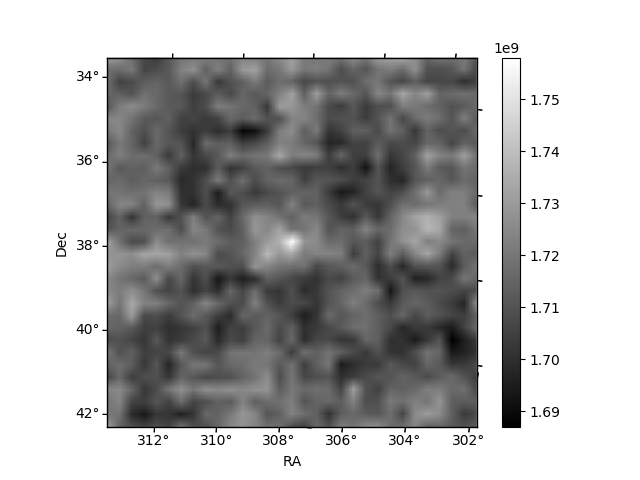
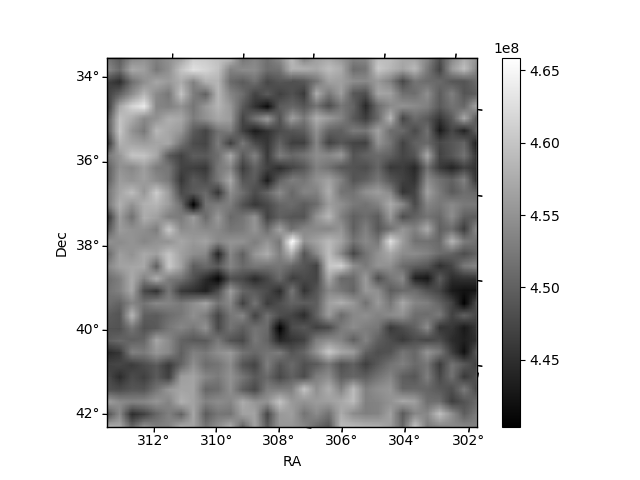
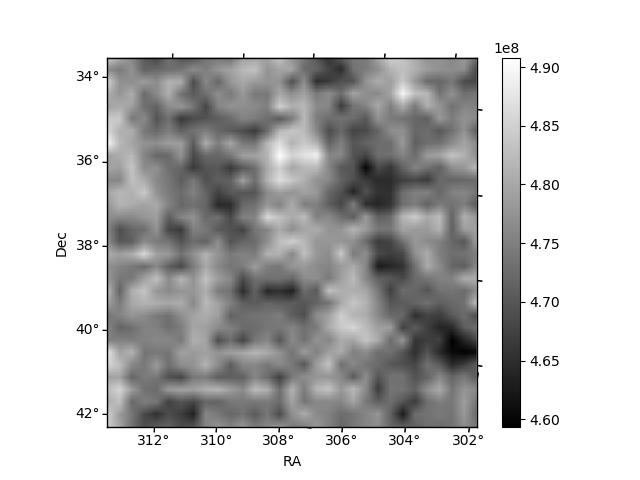
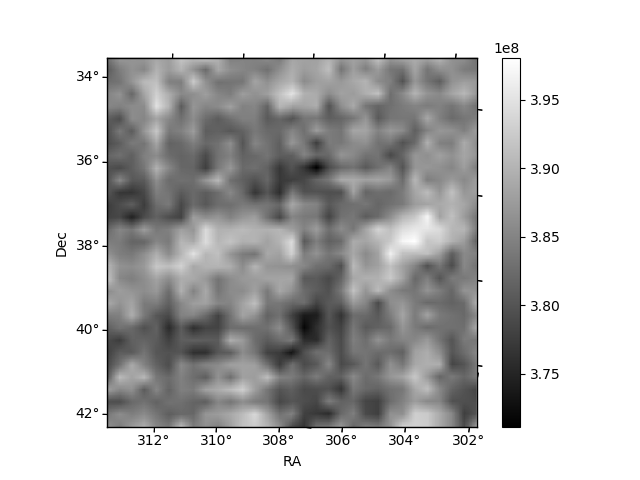
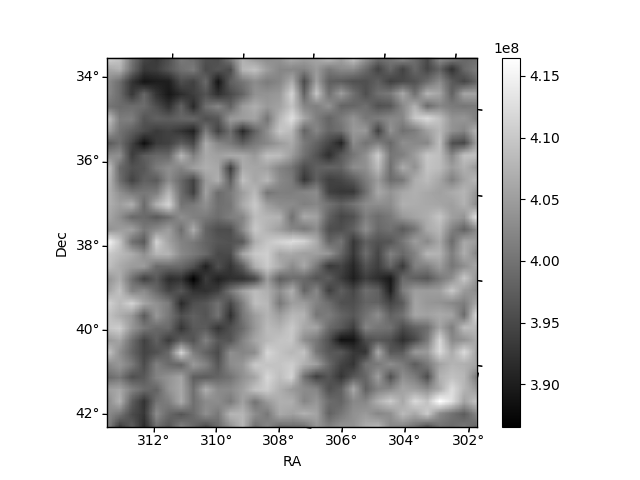
Histogram calculated using DETX and DETY for each event in the final _common_clean file
| Quadrant A | 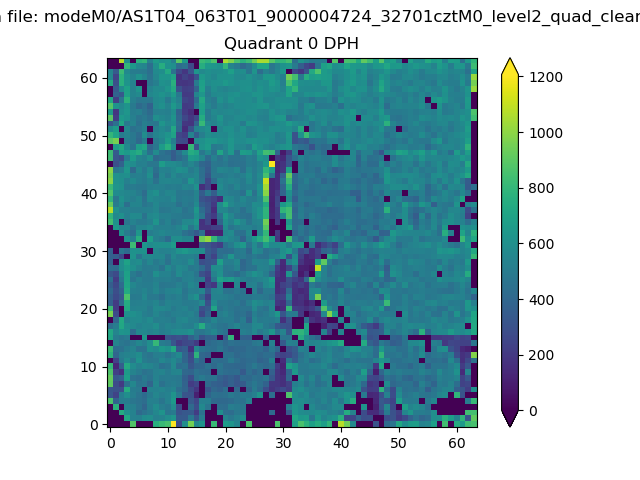 |
 |
Quadrant B |
|---|---|---|---|
| Quadrant D | 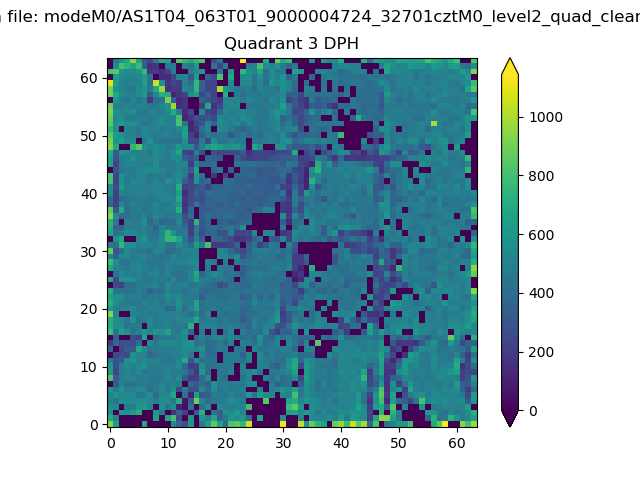 |
 |
Quadrant C |
| Plot type | Count rate plots | Images |
|---|---|---|
| Comparison with Poisson distribution Blue bars denote a histogram of data divided into 1 sec bins. Red curve is a Poisson curve with rate = median count rate of data. |
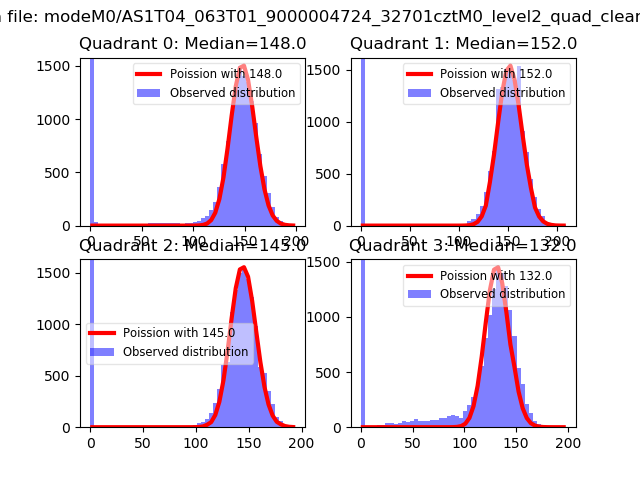 |
 |
| Quadrant-wise count rates Data is divided into 100 sec bins |
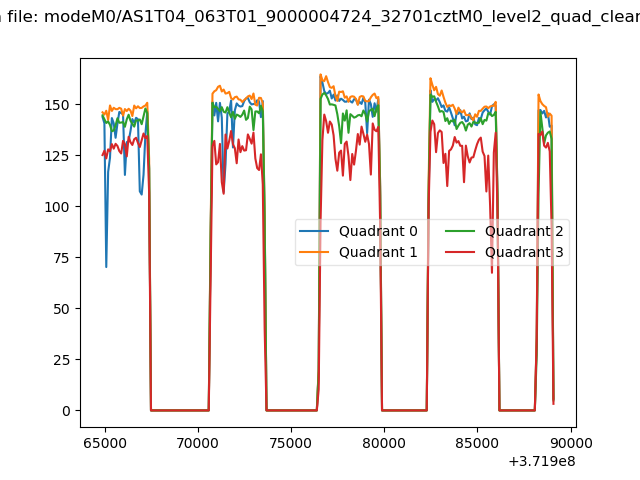 |
|
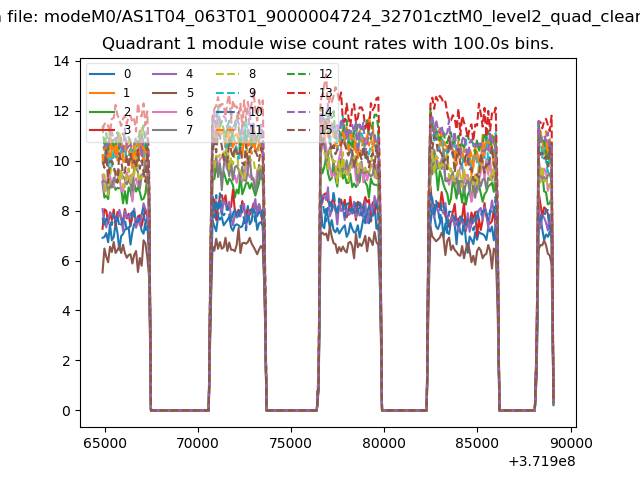
| Module-wise count rates for Quadrant A Data is divided into 100 sec bins |
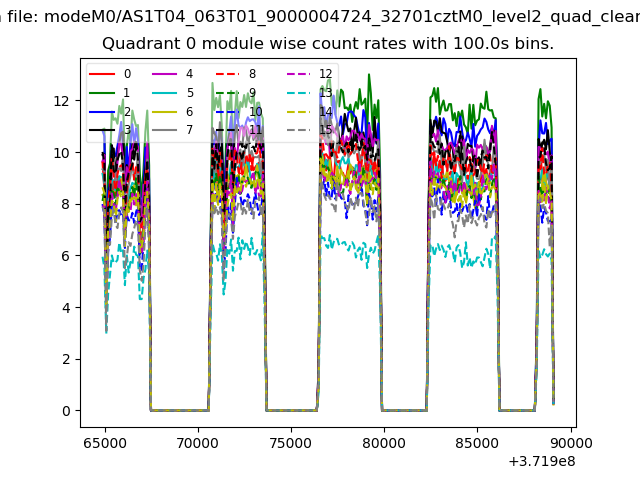 |
 |
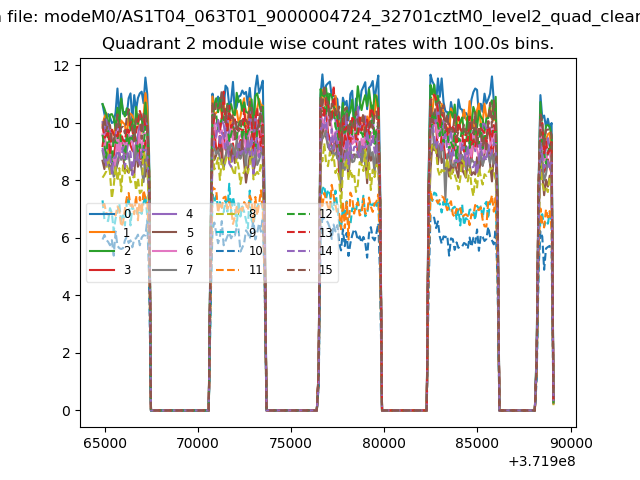
| Module-wise count rates for Quadrant B Data is divided into 100 sec bins |
 |
 |
| Module-wise count rates for Quadrant C Data is divided into 100 sec bins |
 |
 |
| Module-wise count rates for Quadrant D Data is divided into 100 sec bins |
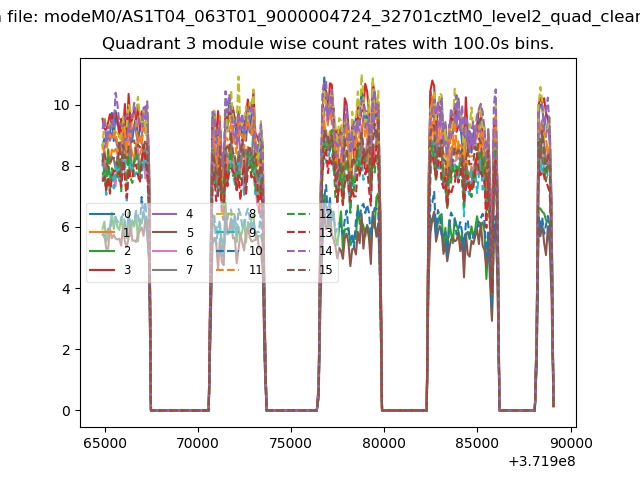 |
 |
| Parameter | Plot |
|---|---|
| CZT HV Monitor | 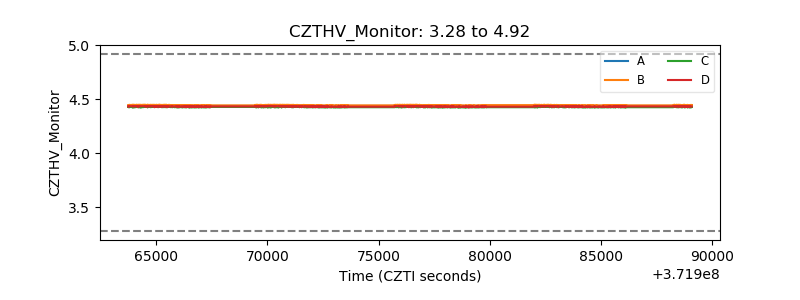 |
| D_VDD | 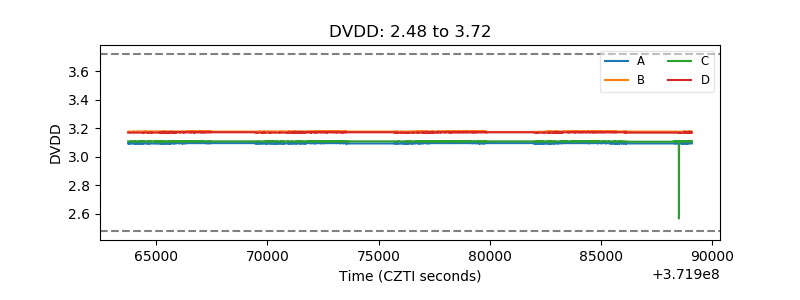 |
| Temperature 1 | 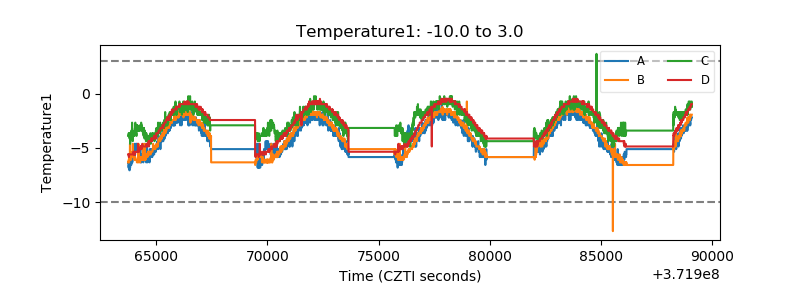 |
| Veto HV Monitor | 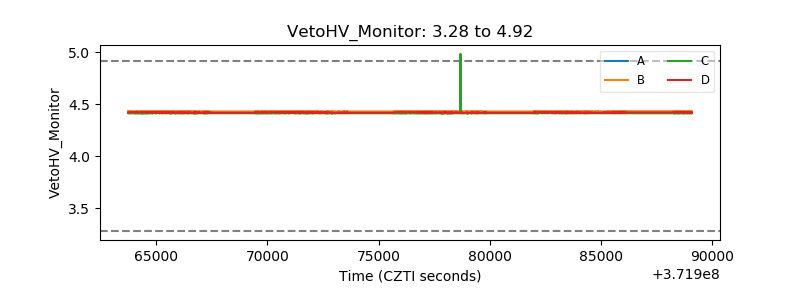 |
| Veto LLD | 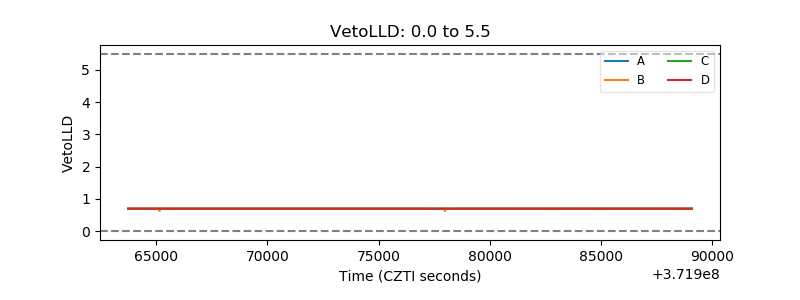 |
| Alpha Counter | 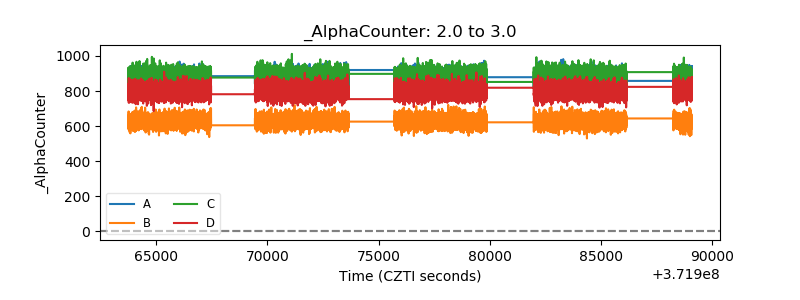 |
| _CPM_Rate | 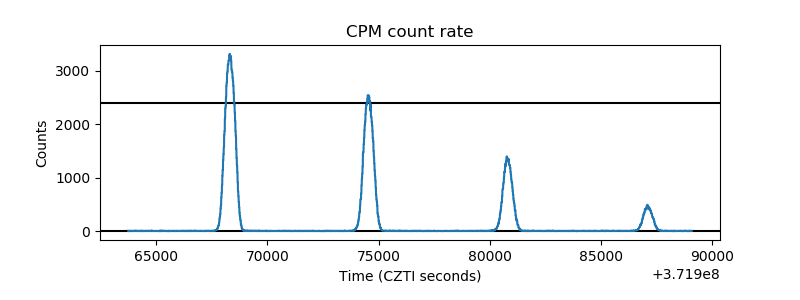 |
| CZT Counter | 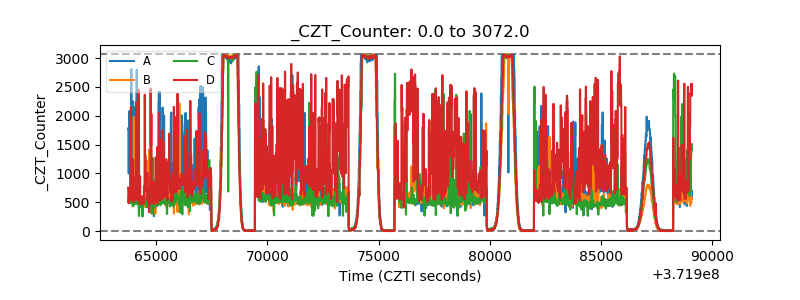 |
| +2.5 Volts monitor | 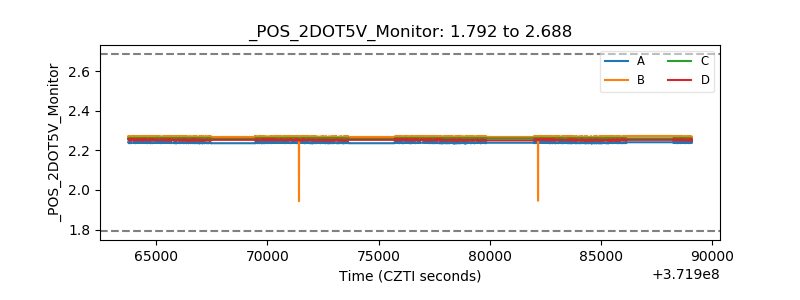 |
| +5 Volts monitor |  |
| _ROLL_ROT | 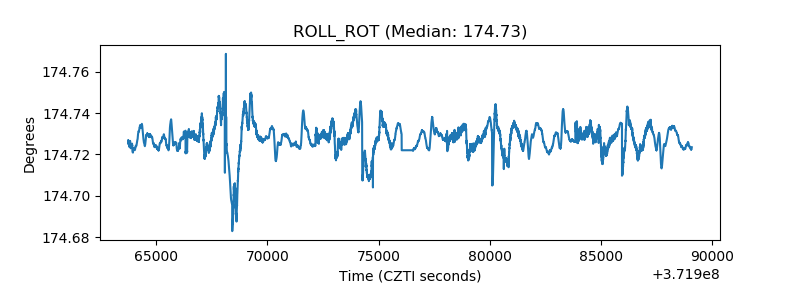 |
| _Roll_DEC | 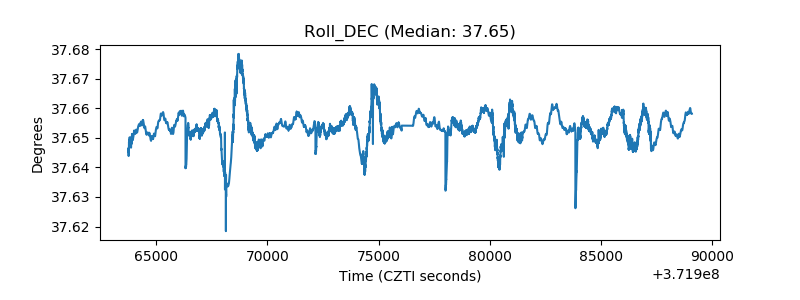 |
| _Roll_RA | 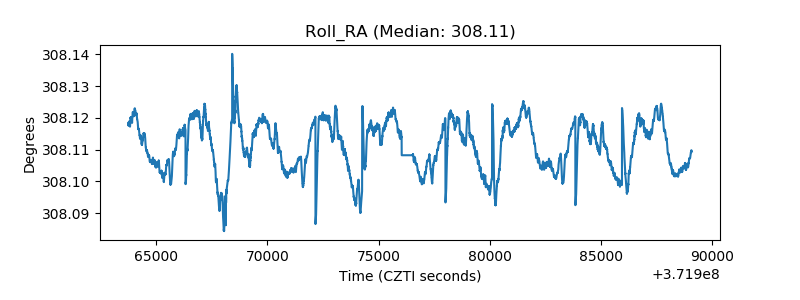 |
| Veto Counter | 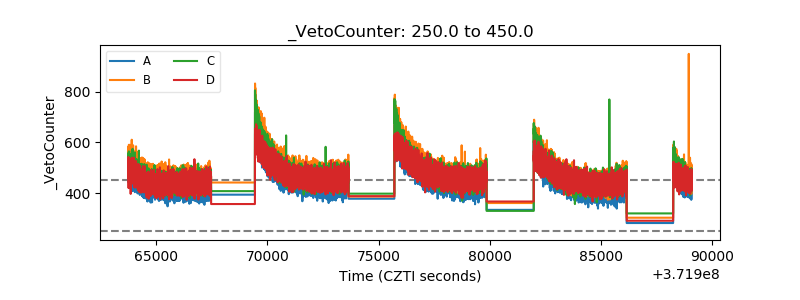 |