| Param | Original file | Final file |
|---|---|---|
| Filename | modeM0/AS1T04_063T01_9000004724_32702cztM0_level2.evt | modeM0/AS1T04_063T01_9000004724_32702cztM0_level2_quad_clean.evt |
| Size (bytes) | 598,740,480 | 90,213,120 |
| Size | 571.0 MB | 86.0 MB |
| Events in quadrant A | 3,211,144 | 620,928 |
| Events in quadrant B | 2,995,485 | 636,084 |
| Events in quadrant C | 5,013,734 | 592,325 |
| Events in quadrant D | 6,565,879 | 522,390 |
| Mode SS | |||
|---|---|---|---|
| Quadrant | BADHDUFLAG | Total packets | Discarded packets |
| A | 0 | 104 | 0 |
| B | 0 | 104 | 0 |
| C | 0 | 104 | 0 |
| D | 0 | 104 | 0 |
| Mode M9 | |||
|---|---|---|---|
| Quadrant | BADHDUFLAG | Total packets | Discarded packets |
| A | 0 | 26 | 0 |
| B | 0 | 26 | 0 |
| C | 0 | 26 | 0 |
| D | 0 | 27 | 0 |
| Mode M0 | |||
|---|---|---|---|
| Quadrant | BADHDUFLAG | Total packets | Discarded packets |
| A | 0 | 12747 | 3 |
| B | 0 | 12033 | 2 |
| C | 0 | 18609 | 2 |
| D | 0 | 23178 | 2 |
| Quadrant | Total seconds | Saturated seconds | Saturation percentage |
|---|---|---|---|
| A | 5135 | 152 | 2.960078% |
| B | 5135 | 42 | 0.817916% |
| C | 5135 | 264 | 5.141188% |
| D | 5135 | 1149 | 22.375852% |
Noise dominated data is calculated using 1-second bins in cleaned event files. If a bin has >2000 counts, and if more than 50% of those come from <1% of pixels, then it is considered to be noise-dominated and hence unusable.
| Quadrant | # 1 sec bins | Bins with >0 counts | Bins with >2000 counts | High rate bins dominated by noise | Noise dominated (total time) | Noise dominated (detector-on time) | Marked lightcurve |
|---|---|---|---|---|---|---|---|
| A | 7079 | 5136 | 63 | 63 | 0.89% | 1.23% | 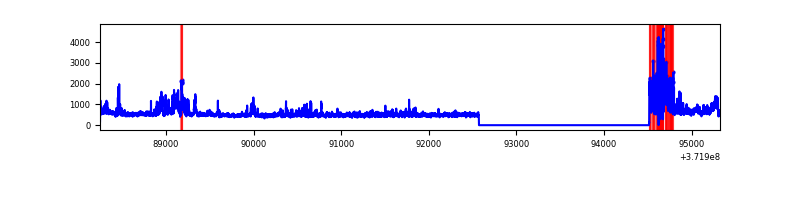 |
| B | 7079 | 5136 | 24 | 24 | 0.34% | 0.47% | 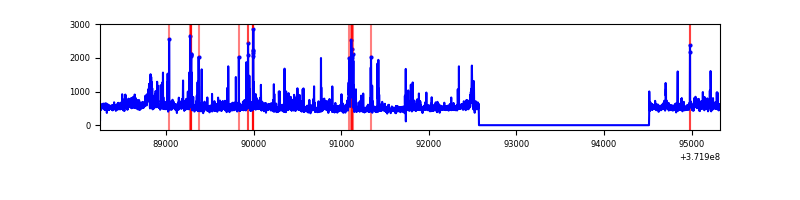 |
| C | 7079 | 5136 | 236 | 236 | 3.33% | 4.60% | 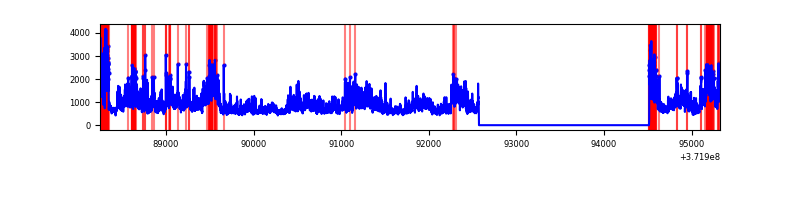 |
| D | 7079 | 5136 | 1029 | 1029 | 14.54% | 20.04% |  |
Top three noisy pixels from each quadrant. If the there are fewer than three noisy pixels in the level2.evt file, extra rows are filled as -1
| Pixel properties | Quadrant properties | ||||||
|---|---|---|---|---|---|---|---|
| Quadrant | DetID | PixID | Counts | Sigma | Mean | Median | Sigma |
| A | 15 | 249 | 736256 | 5946.57 | 622 | 613 | 123.7 |
| A | 0 | 159 | 23516 | 185.14 | 622 | 613 | 123.7 |
| A | 14 | 238 | 11417 | 87.33 | 622 | 613 | 123.7 |
| B | 0 | 219 | 96689 | 806.45 | 630 | 618 | 119.1 |
| B | 3 | 26 | 75071 | 624.98 | 630 | 618 | 119.1 |
| B | 0 | 230 | 74881 | 623.39 | 630 | 618 | 119.1 |
| C | 3 | 233 | 2184230 | 15801.59 | 592 | 597 | 138.2 |
| C | 0 | 10 | 333836 | 2411.44 | 592 | 597 | 138.2 |
| C | 0 | 207 | 99673 | 716.95 | 592 | 597 | 138.2 |
| D | 12 | 233 | 1071441 | 8118.76 | 554 | 543 | 131.9 |
| D | 1 | 47 | 641984 | 4862.94 | 554 | 543 | 131.9 |
| D | 2 | 249 | 427454 | 3236.53 | 554 | 543 | 131.9 |
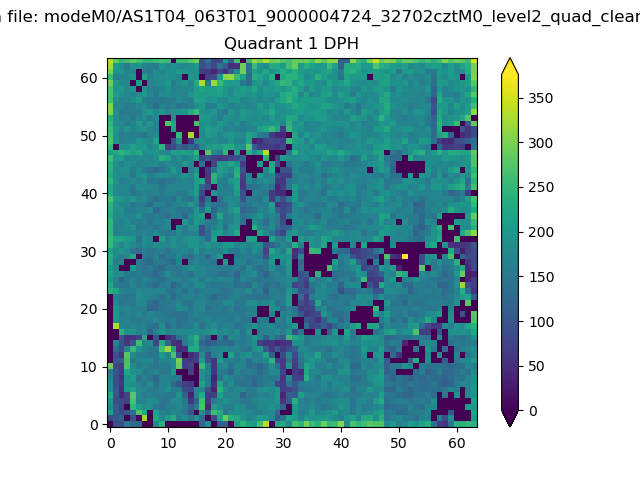
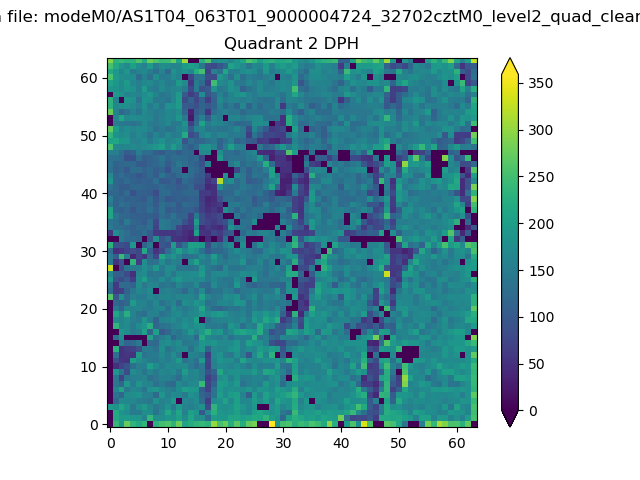
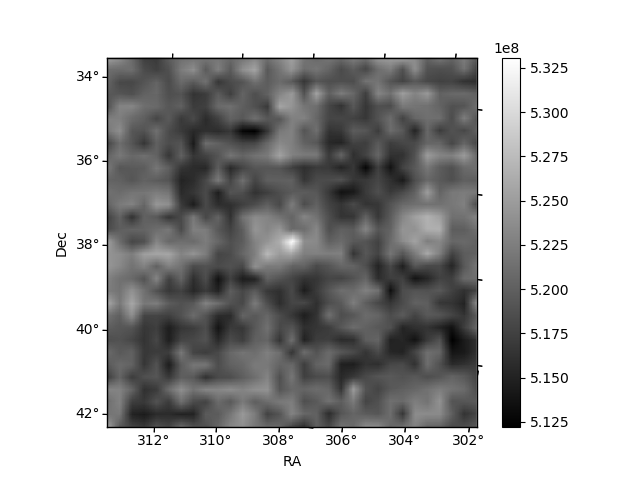
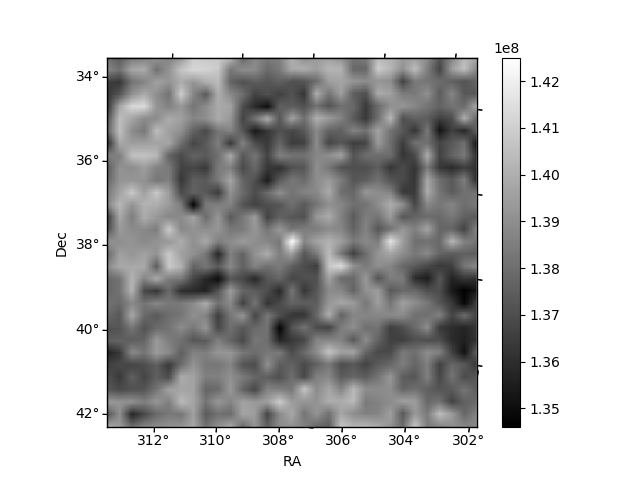
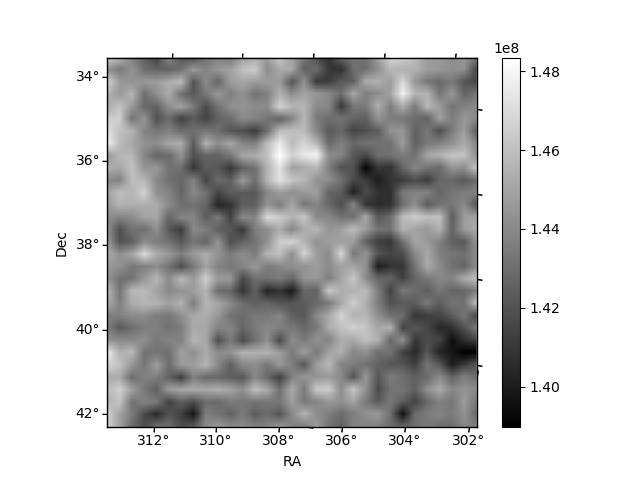
Histogram calculated using DETX and DETY for each event in the final _common_clean file
| Quadrant A | 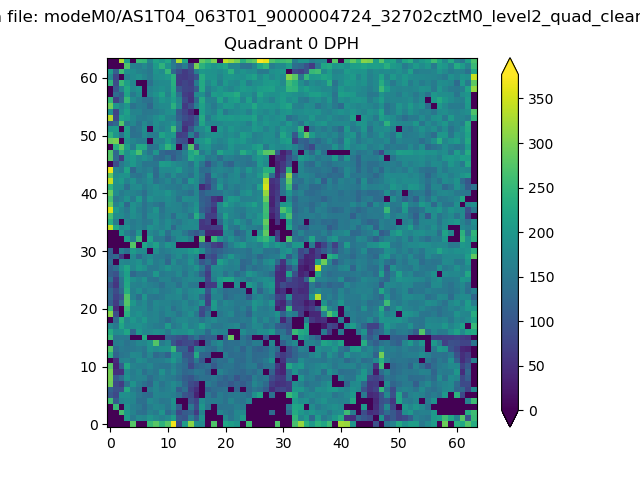 |
 |
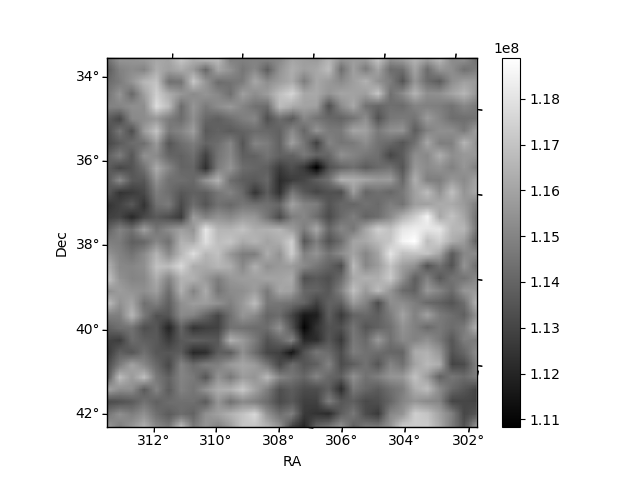
Quadrant B |
|---|---|---|---|
| Quadrant D | 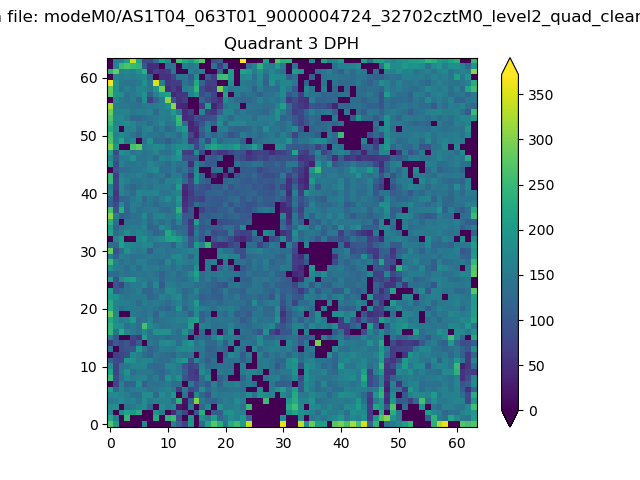 |
 |
Quadrant C |
| Plot type | Count rate plots | Images |
|---|---|---|
| Comparison with Poisson distribution Blue bars denote a histogram of data divided into 1 sec bins. Red curve is a Poisson curve with rate = median count rate of data. |
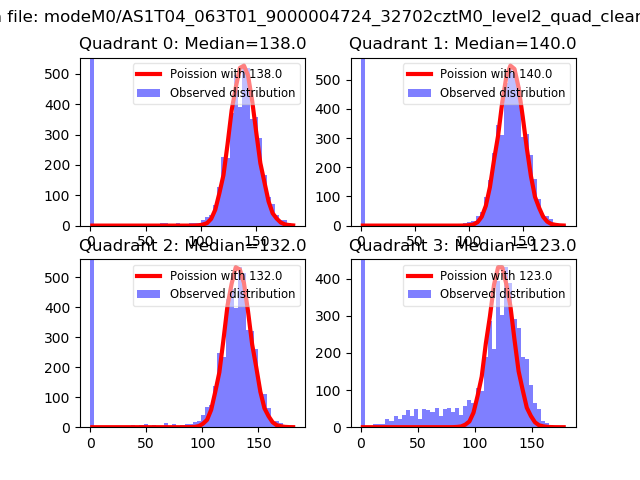 |
 |
| Quadrant-wise count rates Data is divided into 100 sec bins |
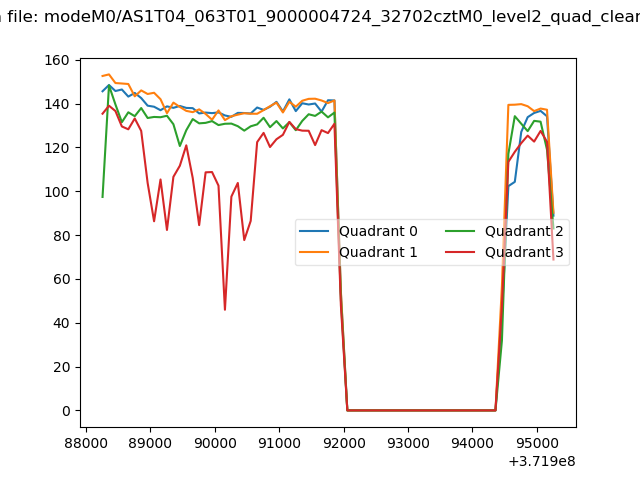 |
|
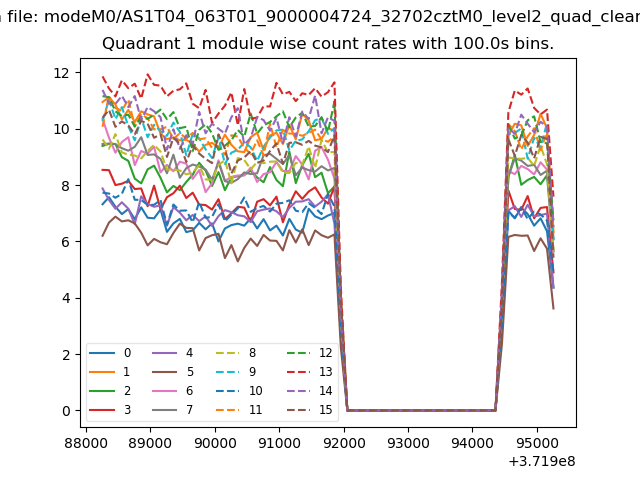
| Module-wise count rates for Quadrant A Data is divided into 100 sec bins |
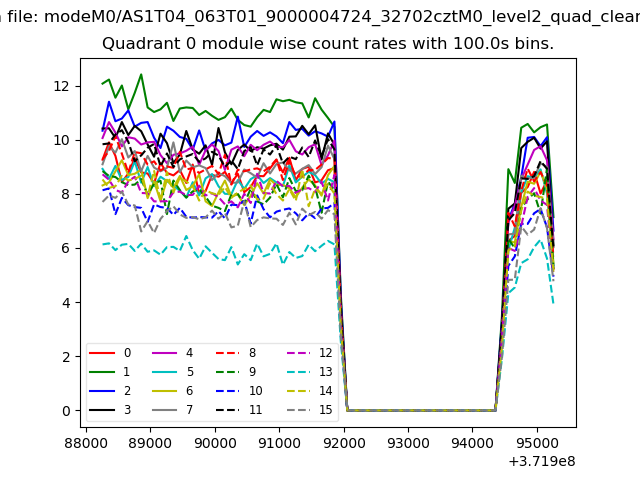 |
 |
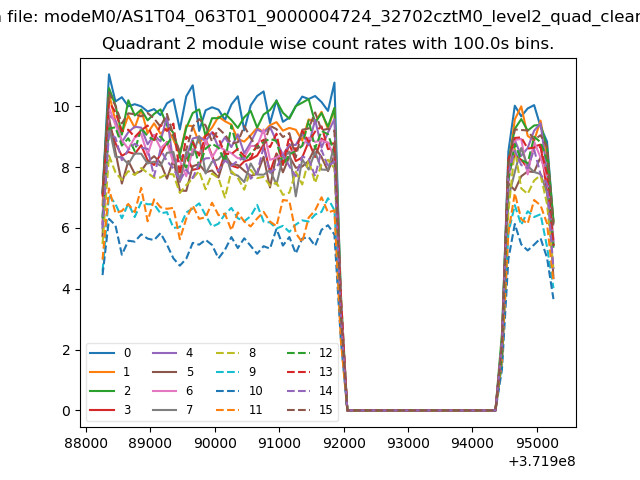
| Module-wise count rates for Quadrant B Data is divided into 100 sec bins |
 |
 |
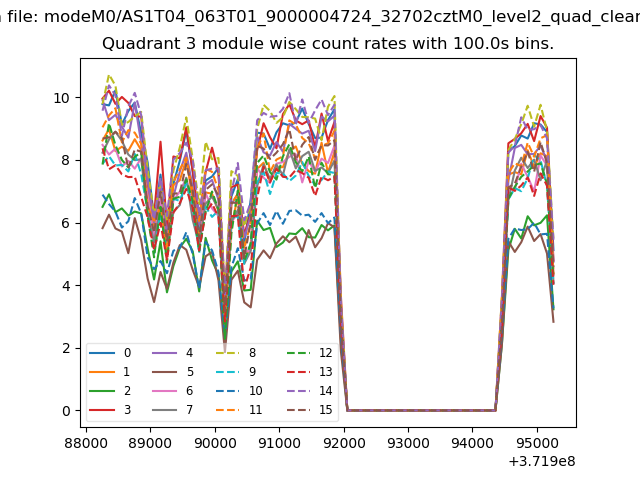
| Module-wise count rates for Quadrant C Data is divided into 100 sec bins |
 |
 |
| Module-wise count rates for Quadrant D Data is divided into 100 sec bins |
 |
 |
| Parameter | Plot |
|---|---|
| CZT HV Monitor | 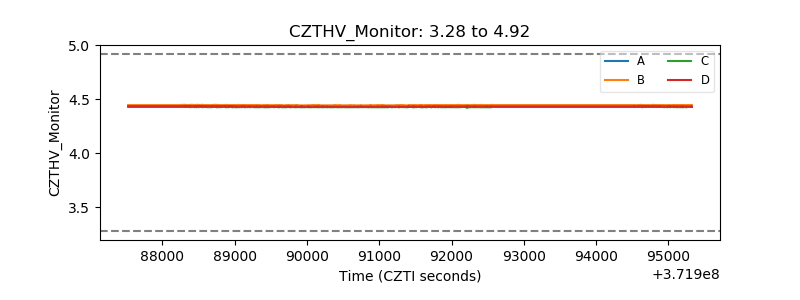 |
| D_VDD |  |
| Temperature 1 | 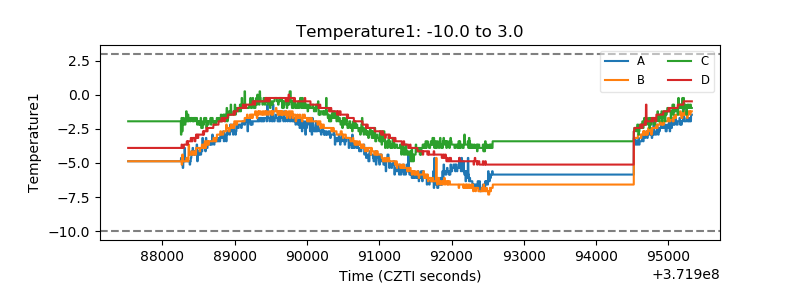 |
| Veto HV Monitor | 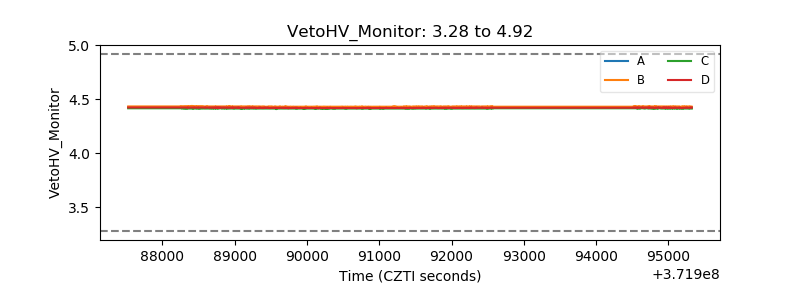 |
| Veto LLD | 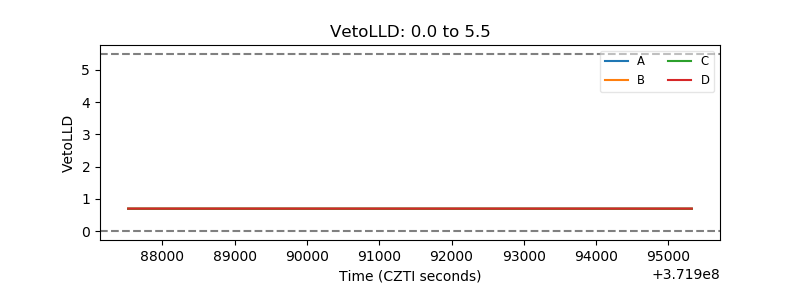 |
| Alpha Counter | 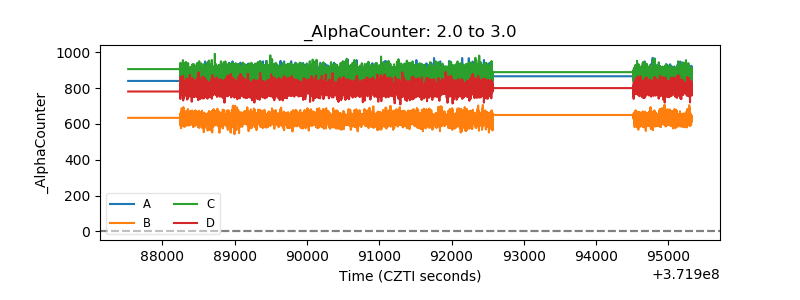 |
| _CPM_Rate | 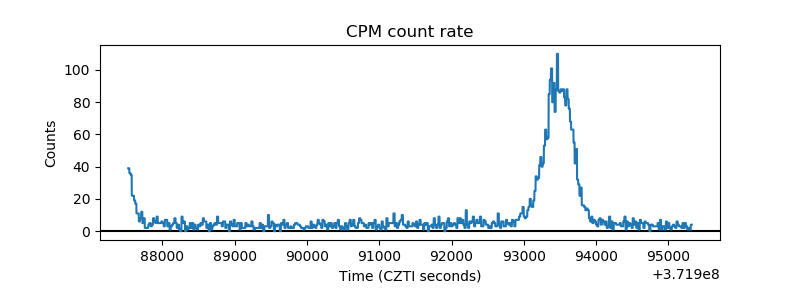 |
| CZT Counter | 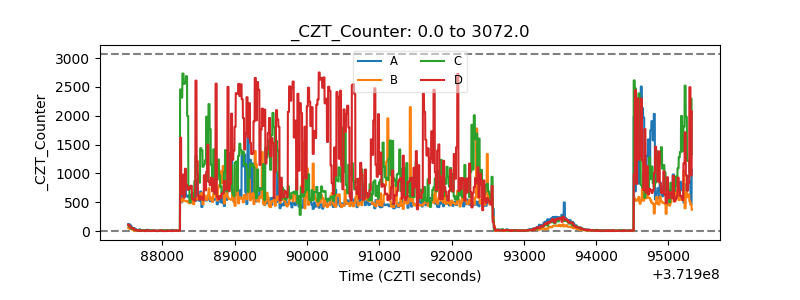 |
| +2.5 Volts monitor |  |
| +5 Volts monitor |  |
| _ROLL_ROT | 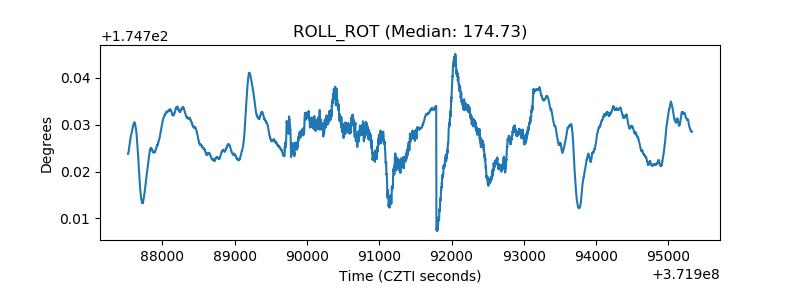 |
| _Roll_DEC | 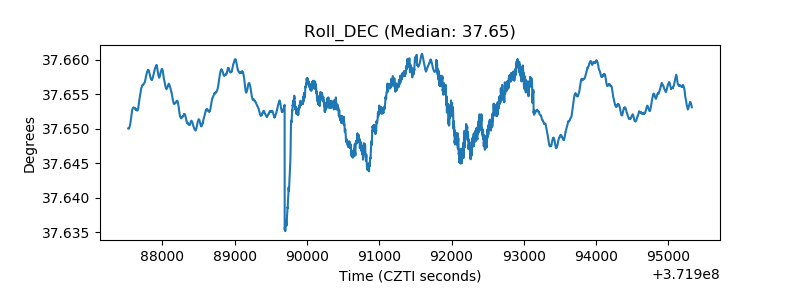 |
| _Roll_RA | 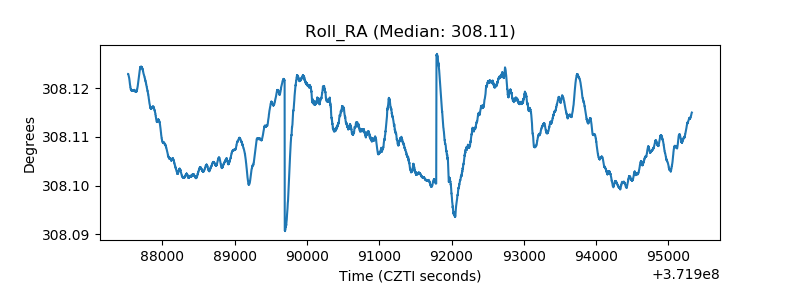 |
| Veto Counter | 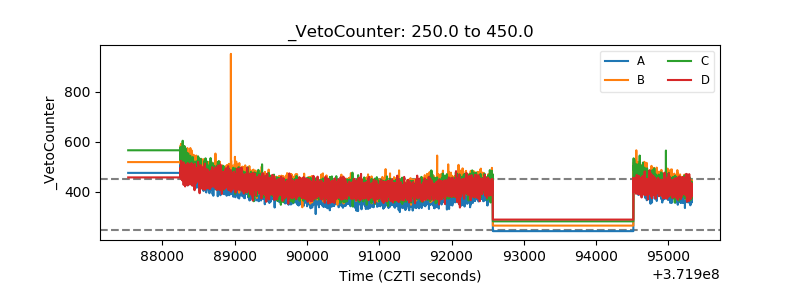 |