| Param | Original file | Final file |
|---|---|---|
| Filename | modeM0/AS1T04_063T01_9000004724_32703cztM0_level2.evt | modeM0/AS1T04_063T01_9000004724_32703cztM0_level2_quad_clean.evt |
| Size (bytes) | 622,468,800 | 80,616,960 |
| Size | 593.6 MB | 76.9 MB |
| Events in quadrant A | 4,602,400 | 508,722 |
| Events in quadrant B | 3,409,896 | 550,377 |
| Events in quadrant C | 4,604,385 | 518,611 |
| Events in quadrant D | 5,863,822 | 478,097 |
| Mode SS | |||
|---|---|---|---|
| Quadrant | BADHDUFLAG | Total packets | Discarded packets |
| A | 0 | 112 | 0 |
| B | 0 | 112 | 0 |
| C | 0 | 112 | 0 |
| D | 0 | 112 | 0 |
| Mode M9 | |||
|---|---|---|---|
| Quadrant | BADHDUFLAG | Total packets | Discarded packets |
| A | 0 | 16 | 0 |
| B | 0 | 16 | 0 |
| C | 0 | 16 | 0 |
| D | 0 | 16 | 0 |
| Mode M0 | |||
|---|---|---|---|
| Quadrant | BADHDUFLAG | Total packets | Discarded packets |
| A | 0 | 17299 | 3 |
| B | 0 | 13548 | 2 |
| C | 0 | 17333 | 2 |
| D | 0 | 21321 | 2 |
| Quadrant | Total seconds | Saturated seconds | Saturation percentage |
|---|---|---|---|
| A | 5499 | 486 | 8.837971% |
| B | 5499 | 109 | 1.982179% |
| C | 5499 | 234 | 4.255319% |
| D | 5499 | 673 | 12.238589% |
Noise dominated data is calculated using 1-second bins in cleaned event files. If a bin has >2000 counts, and if more than 50% of those come from <1% of pixels, then it is considered to be noise-dominated and hence unusable.
| Quadrant | # 1 sec bins | Bins with >0 counts | Bins with >2000 counts | High rate bins dominated by noise | Noise dominated (total time) | Noise dominated (detector-on time) | Marked lightcurve |
|---|---|---|---|---|---|---|---|
| A | 7082 | 5500 | 370 | 370 | 5.22% | 6.73% | 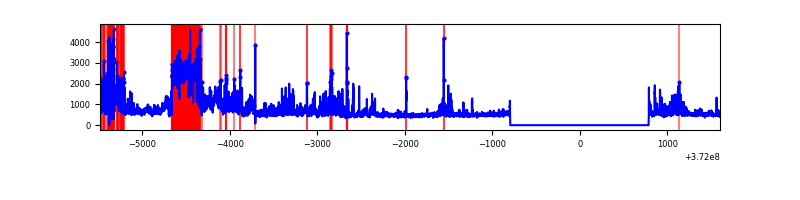 |
| B | 7082 | 5500 | 55 | 55 | 0.78% | 1.00% | 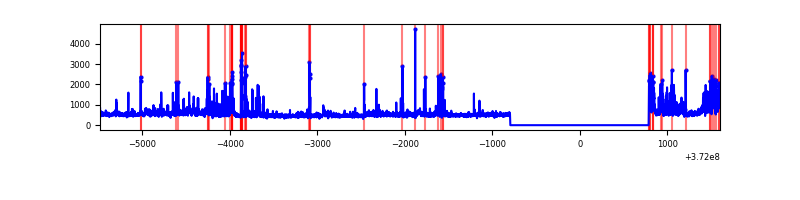 |
| C | 7082 | 5500 | 228 | 228 | 3.22% | 4.15% | 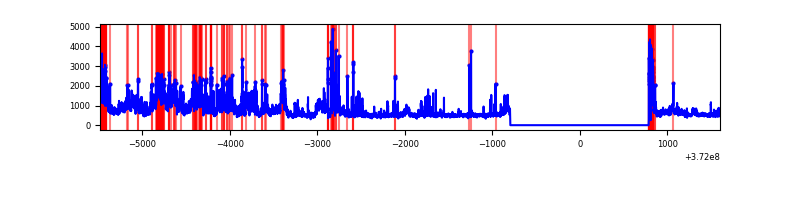 |
| D | 7082 | 5500 | 598 | 598 | 8.44% | 10.87% | 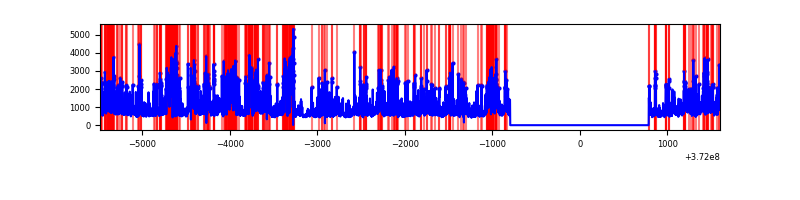 |
Top three noisy pixels from each quadrant. If the there are fewer than three noisy pixels in the level2.evt file, extra rows are filled as -1
| Pixel properties | Quadrant properties | ||||||
|---|---|---|---|---|---|---|---|
| Quadrant | DetID | PixID | Counts | Sigma | Mean | Median | Sigma |
| A | 15 | 249 | 2101683 | 16844.8 | 624 | 613 | 124.7 |
| A | 7 | 16 | 26155 | 204.78 | 624 | 613 | 124.7 |
| A | 14 | 238 | 23554 | 183.92 | 624 | 613 | 124.7 |
| B | 4 | 251 | 229516 | 1847.48 | 656 | 643 | 123.9 |
| B | 4 | 206 | 184040 | 1480.4 | 656 | 643 | 123.9 |
| B | 0 | 219 | 175701 | 1413.08 | 656 | 643 | 123.9 |
| C | 3 | 233 | 1296628 | 8930.65 | 622 | 628 | 145.1 |
| C | 0 | 10 | 568435 | 3912.72 | 622 | 628 | 145.1 |
| C | 9 | 236 | 233759 | 1606.49 | 622 | 628 | 145.1 |
| D | 2 | 249 | 749447 | 5291.0 | 600 | 588 | 141.5 |
| D | 8 | 195 | 444927 | 3139.44 | 600 | 588 | 141.5 |
| D | 12 | 233 | 408057 | 2878.94 | 600 | 588 | 141.5 |
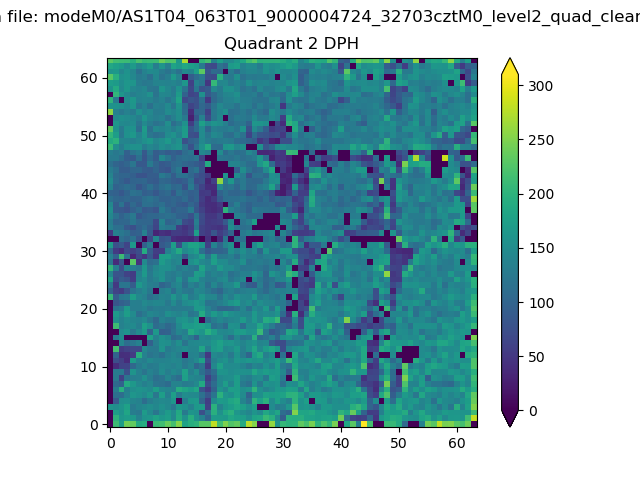
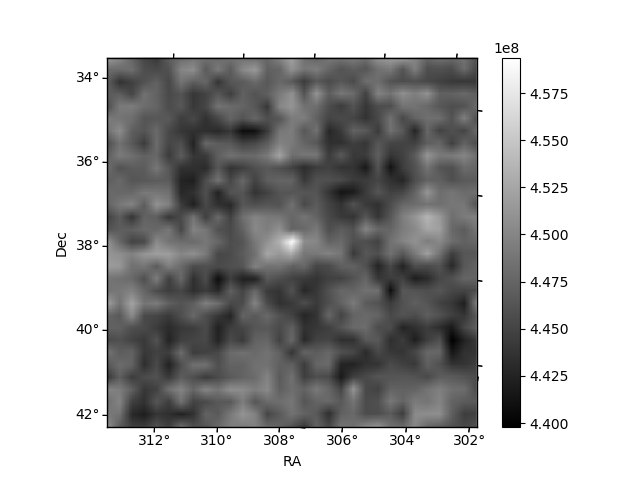
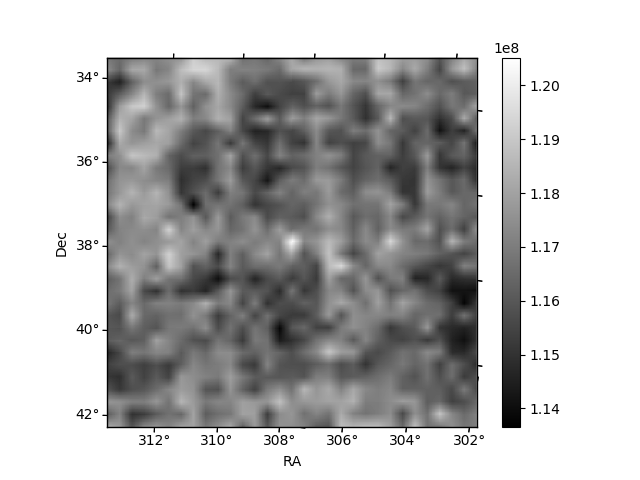
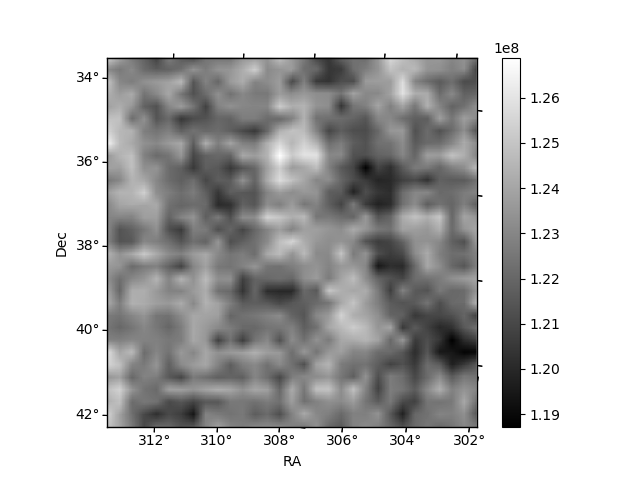
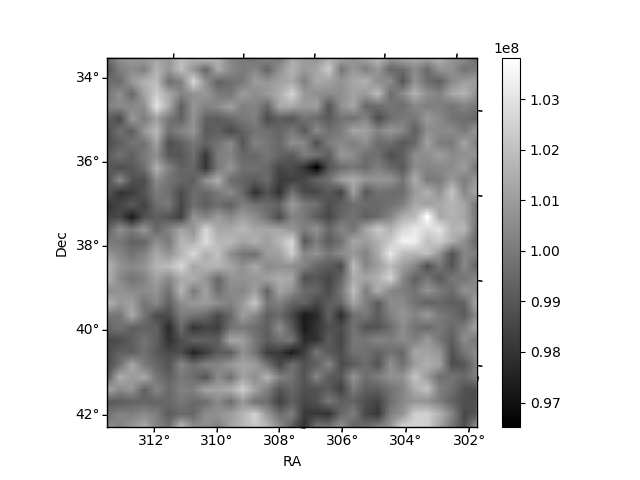
Histogram calculated using DETX and DETY for each event in the final _common_clean file
| Quadrant A | 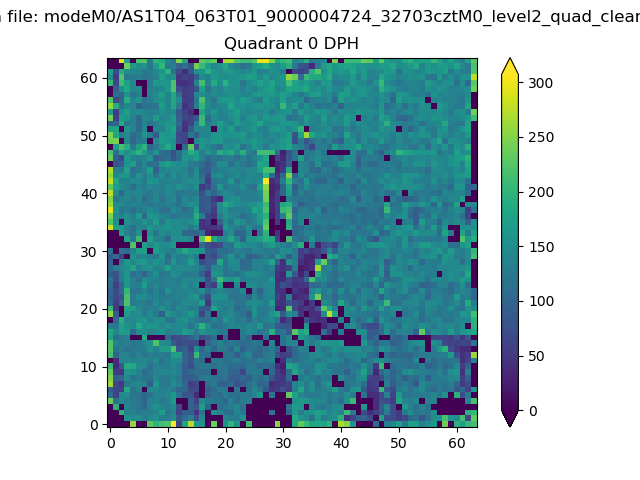 |
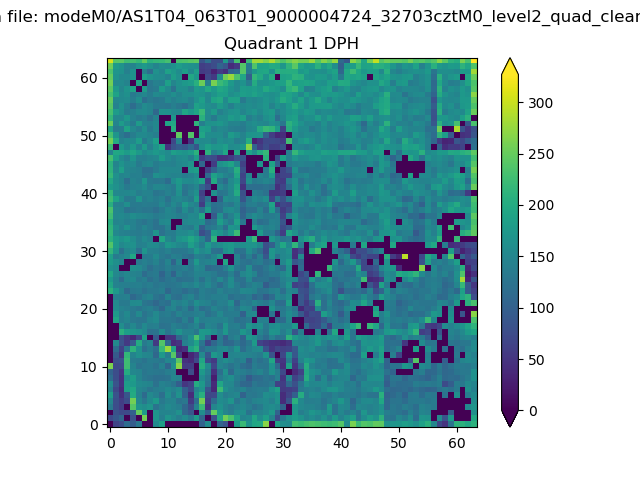 |
Quadrant B |
|---|---|---|---|
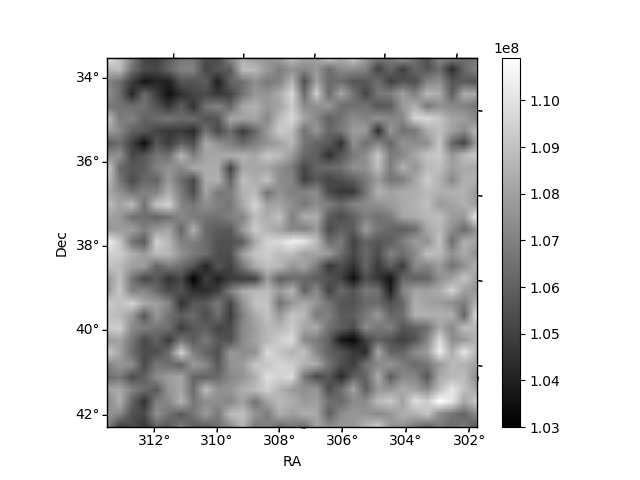
| Quadrant D | 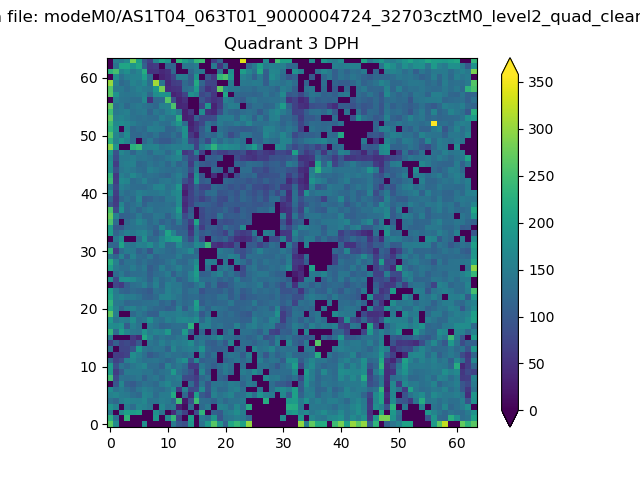 |
 |
Quadrant C |
| Plot type | Count rate plots | Images |
|---|---|---|
| Comparison with Poisson distribution Blue bars denote a histogram of data divided into 1 sec bins. Red curve is a Poisson curve with rate = median count rate of data. |
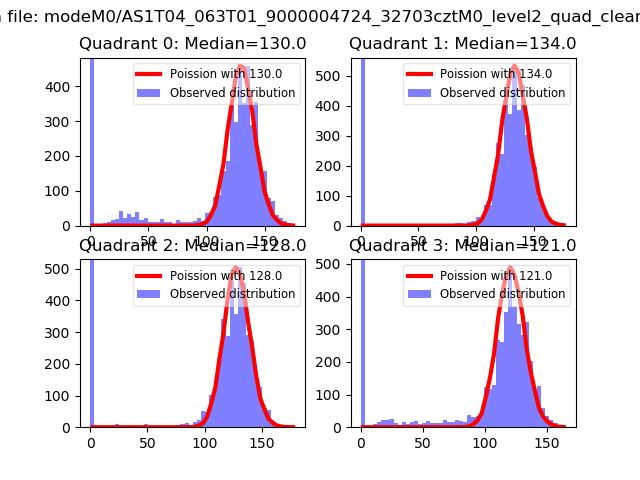 |
 |
| Quadrant-wise count rates Data is divided into 100 sec bins |
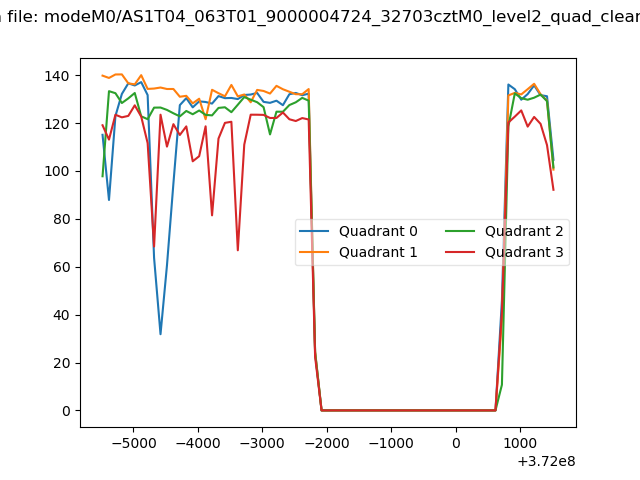 |
|
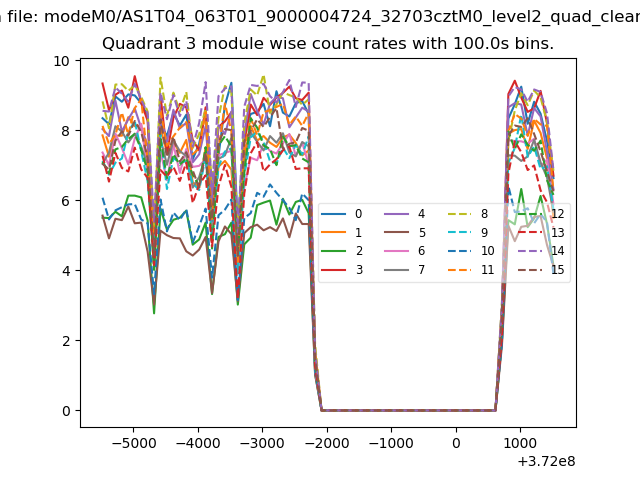
| Module-wise count rates for Quadrant A Data is divided into 100 sec bins |
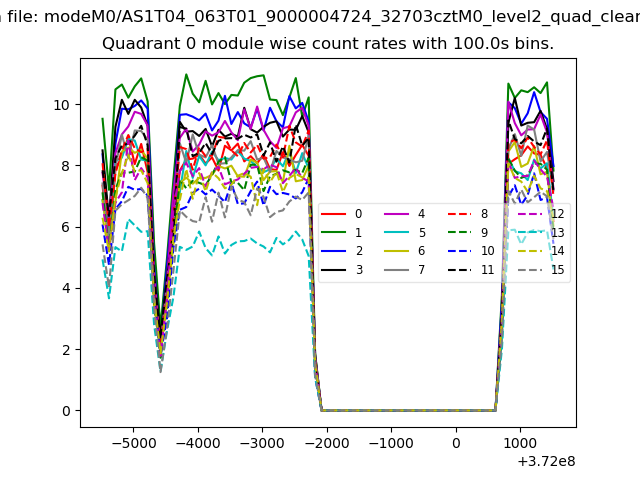 |
 |
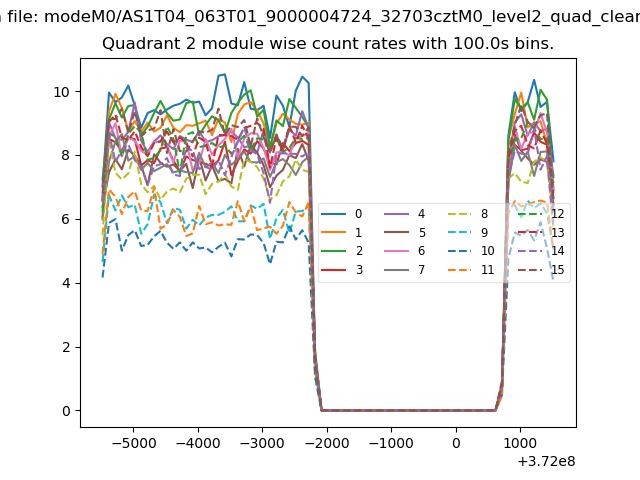
| Module-wise count rates for Quadrant B Data is divided into 100 sec bins |
 |
 |
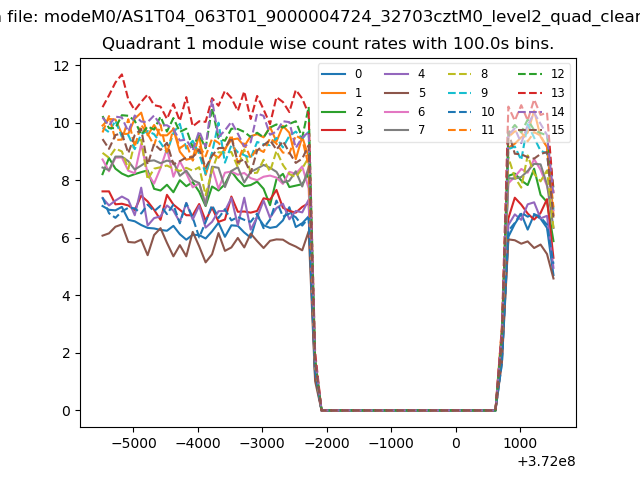
| Module-wise count rates for Quadrant C Data is divided into 100 sec bins |
 |
 |
| Module-wise count rates for Quadrant D Data is divided into 100 sec bins |
 |
 |
| Parameter | Plot |
|---|---|
| CZT HV Monitor | 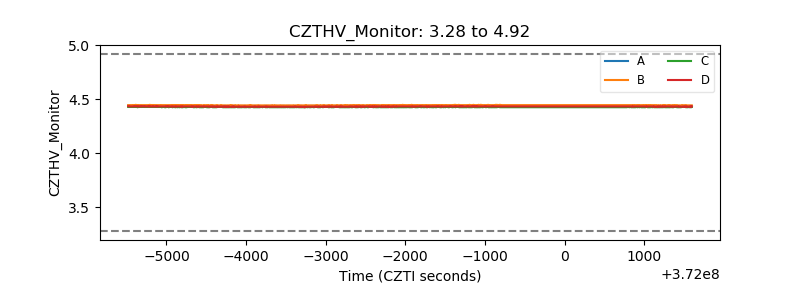 |
| D_VDD | 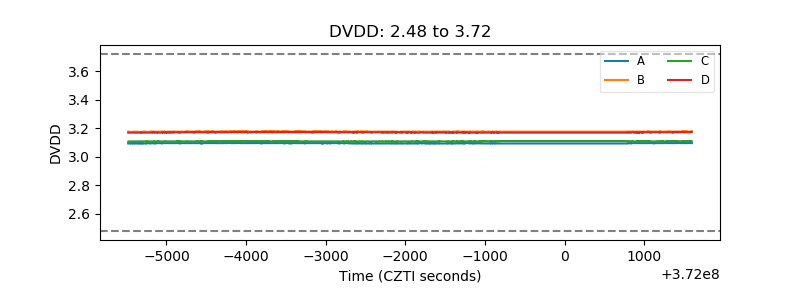 |
| Temperature 1 | 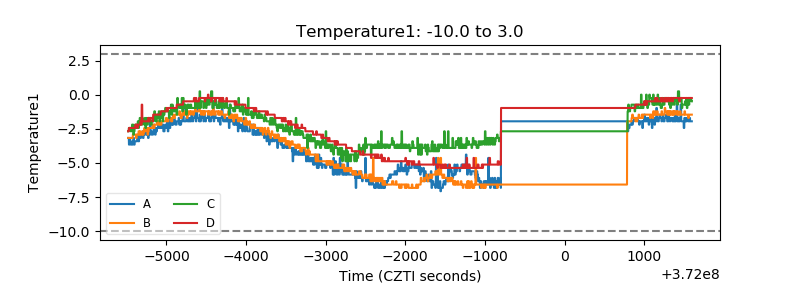 |
| Veto HV Monitor | 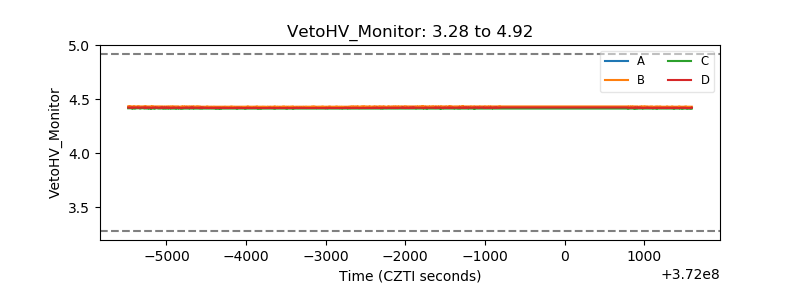 |
| Veto LLD | 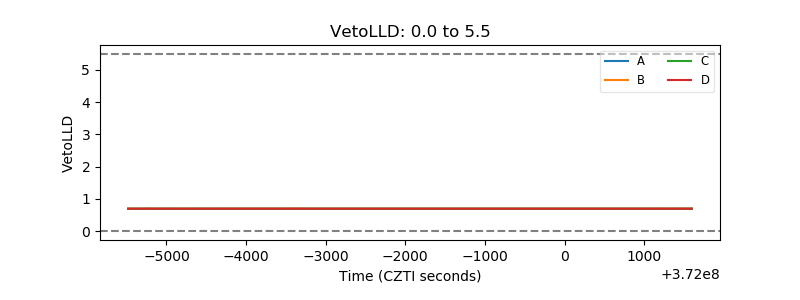 |
| Alpha Counter | 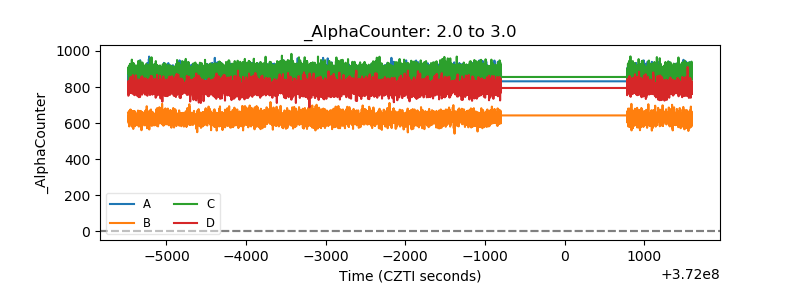 |
| _CPM_Rate | 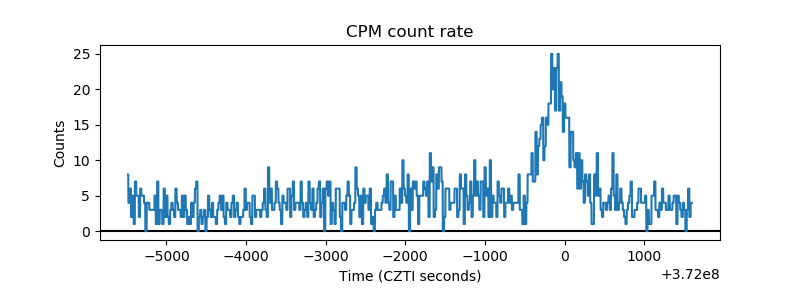 |
| CZT Counter | 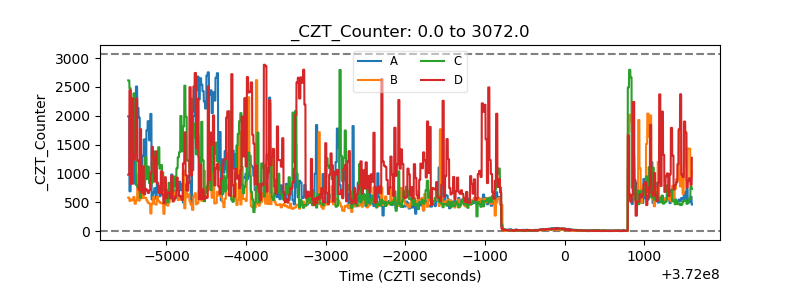 |
| +2.5 Volts monitor | 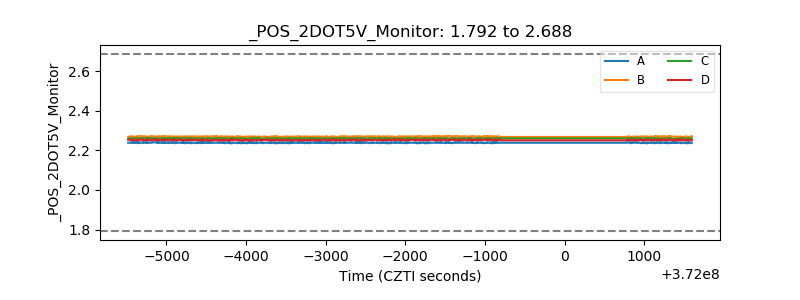 |
| +5 Volts monitor |  |
| _ROLL_ROT | 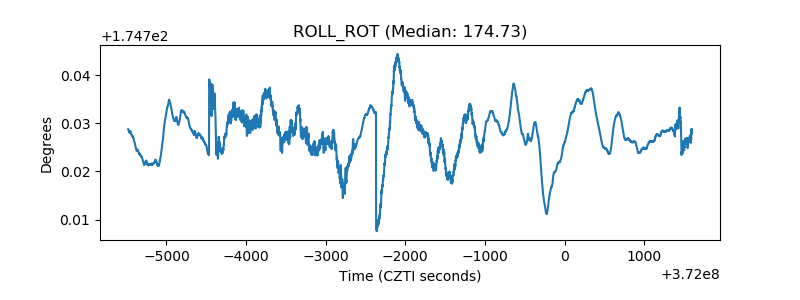 |
| _Roll_DEC | 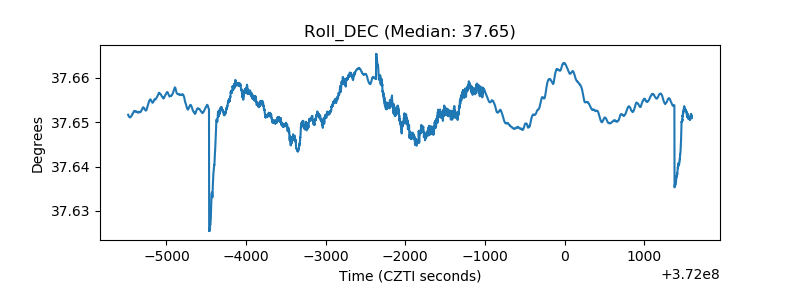 |
| _Roll_RA | 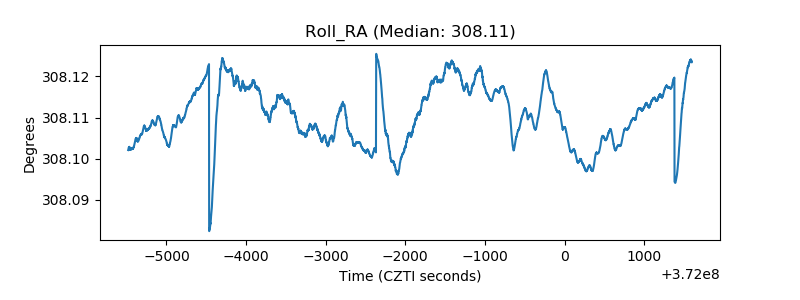 |
| Veto Counter | 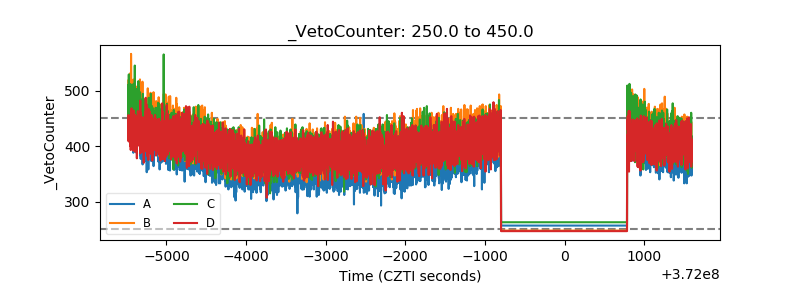 |