| Param | Original file | Final file |
|---|---|---|
| Filename | modeM0/AS1T04_063T01_9000004724_32704cztM0_level2.evt | modeM0/AS1T04_063T01_9000004724_32704cztM0_level2_quad_clean.evt |
| Size (bytes) | 607,530,240 | 76,579,200 |
| Size | 579.4 MB | 73.0 MB |
| Events in quadrant A | 3,533,307 | 496,982 |
| Events in quadrant B | 4,065,783 | 496,900 |
| Events in quadrant C | 3,366,663 | 493,412 |
| Events in quadrant D | 7,034,088 | 418,530 |
| Mode SS | |||
|---|---|---|---|
| Quadrant | BADHDUFLAG | Total packets | Discarded packets |
| A | 0 | 120 | 0 |
| B | 0 | 120 | 0 |
| C | 0 | 120 | 0 |
| D | 0 | 120 | 0 |
| Mode M9 | |||
|---|---|---|---|
| Quadrant | BADHDUFLAG | Total packets | Discarded packets |
| A | 0 | 14 | 0 |
| B | 0 | 14 | 0 |
| C | 0 | 14 | 0 |
| D | 0 | 14 | 0 |
| Mode M0 | |||
|---|---|---|---|
| Quadrant | BADHDUFLAG | Total packets | Discarded packets |
| A | 0 | 14108 | 3 |
| B | 0 | 15796 | 2 |
| C | 0 | 13678 | 2 |
| D | 0 | 25085 | 2 |
| Quadrant | Total seconds | Saturated seconds | Saturation percentage |
|---|---|---|---|
| A | 5906 | 111 | 1.879445% |
| B | 5906 | 184 | 3.115476% |
| C | 5906 | 105 | 1.777853% |
| D | 5906 | 1091 | 18.472740% |
Noise dominated data is calculated using 1-second bins in cleaned event files. If a bin has >2000 counts, and if more than 50% of those come from <1% of pixels, then it is considered to be noise-dominated and hence unusable.
| Quadrant | # 1 sec bins | Bins with >0 counts | Bins with >2000 counts | High rate bins dominated by noise | Noise dominated (total time) | Noise dominated (detector-on time) | Marked lightcurve |
|---|---|---|---|---|---|---|---|
| A | 7250 | 5907 | 65 | 65 | 0.90% | 1.10% | 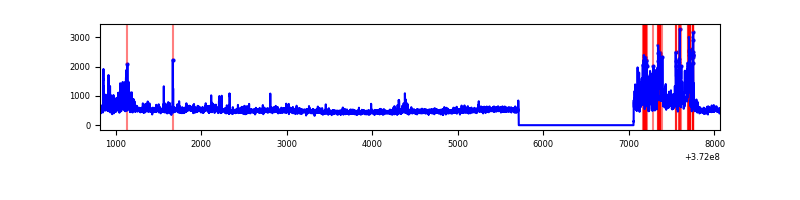 |
| B | 7250 | 5907 | 101 | 101 | 1.39% | 1.71% | 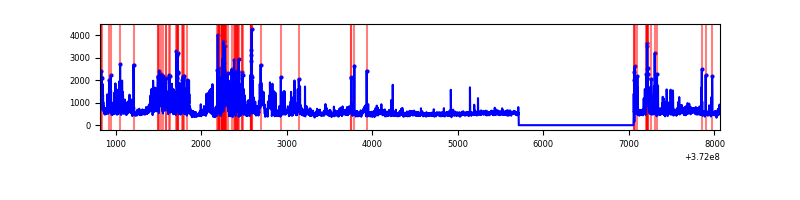 |
| C | 7250 | 5907 | 80 | 80 | 1.10% | 1.35% | 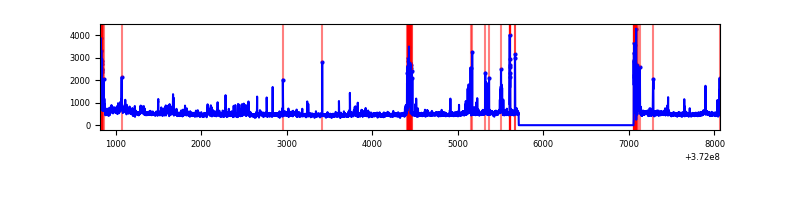 |
| D | 7250 | 5907 | 913 | 913 | 12.59% | 15.46% | 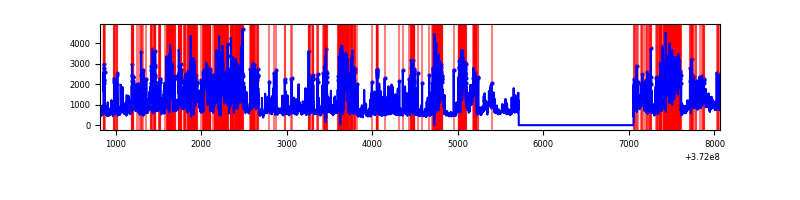 |
Top three noisy pixels from each quadrant. If the there are fewer than three noisy pixels in the level2.evt file, extra rows are filled as -1
| Pixel properties | Quadrant properties | ||||||
|---|---|---|---|---|---|---|---|
| Quadrant | DetID | PixID | Counts | Sigma | Mean | Median | Sigma |
| A | 15 | 249 | 759070 | 5422.01 | 692 | 678 | 139.9 |
| A | 0 | 159 | 29545 | 206.38 | 692 | 678 | 139.9 |
| A | 7 | 16 | 18925 | 130.45 | 692 | 678 | 139.9 |
| B | 4 | 251 | 644094 | 4899.0 | 693 | 679 | 131.3 |
| B | 4 | 206 | 190706 | 1446.88 | 693 | 679 | 131.3 |
| B | 5 | 172 | 189405 | 1436.97 | 693 | 679 | 131.3 |
| C | 0 | 10 | 309533 | 1969.15 | 671 | 678 | 156.8 |
| C | 9 | 236 | 240886 | 1531.48 | 671 | 678 | 156.8 |
| C | 3 | 233 | 137980 | 875.39 | 671 | 678 | 156.8 |
| D | 2 | 250 | 1059901 | 7280.14 | 619 | 608 | 145.5 |
| D | 2 | 249 | 837522 | 5751.81 | 619 | 608 | 145.5 |
| D | 8 | 195 | 749656 | 5147.94 | 619 | 608 | 145.5 |
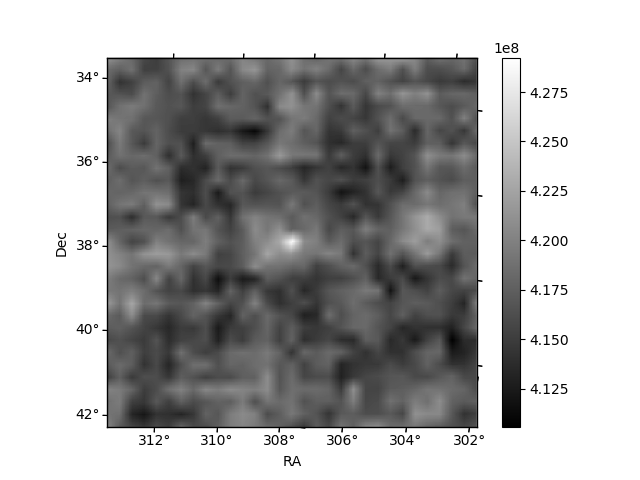
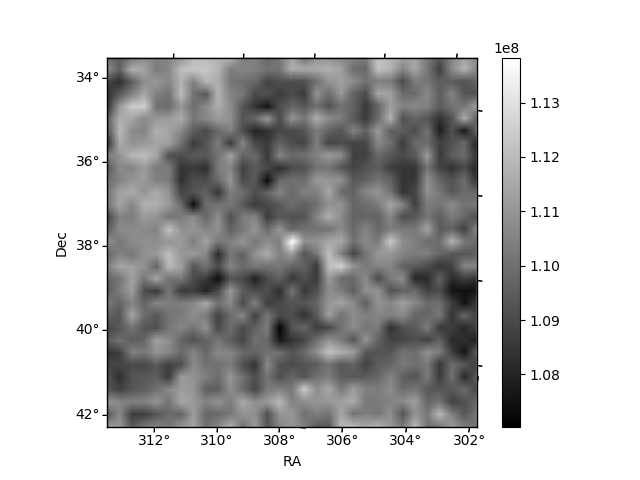
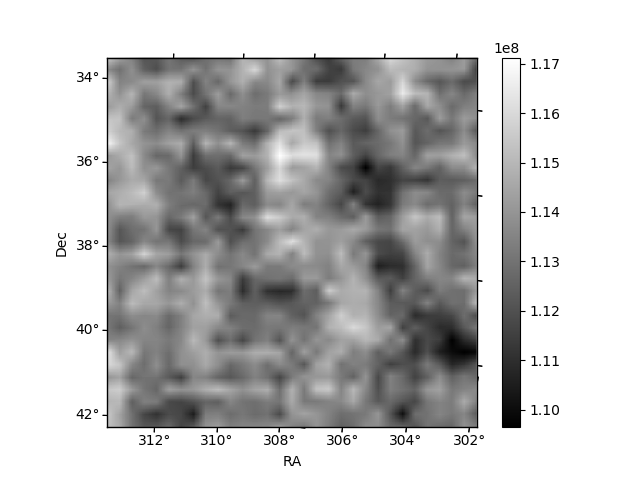
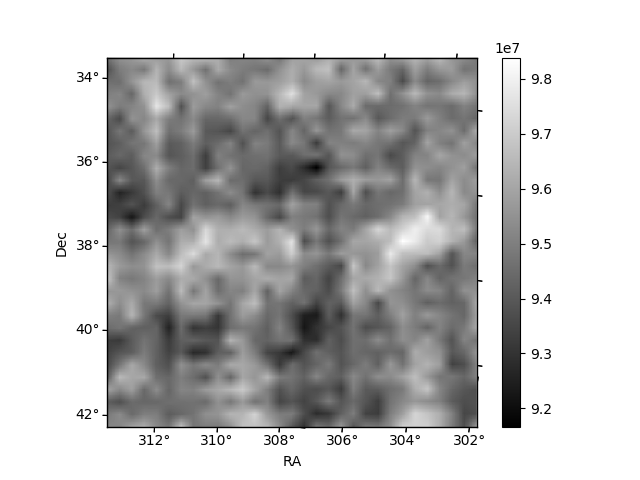
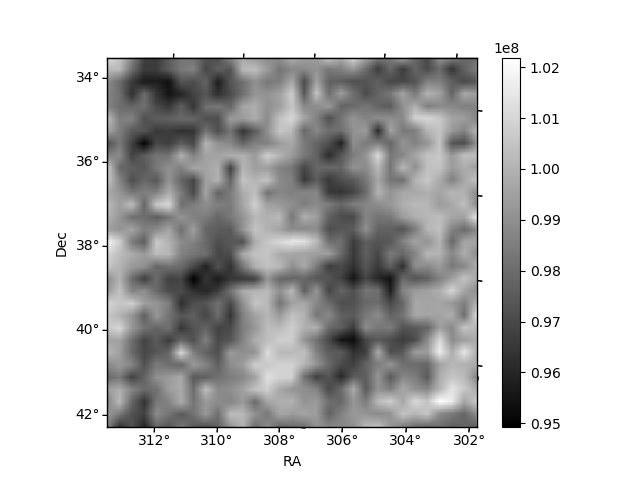
Histogram calculated using DETX and DETY for each event in the final _common_clean file
| Quadrant A | 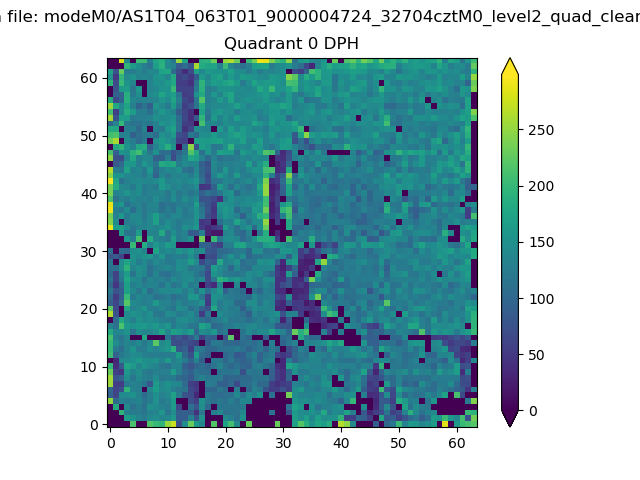 |
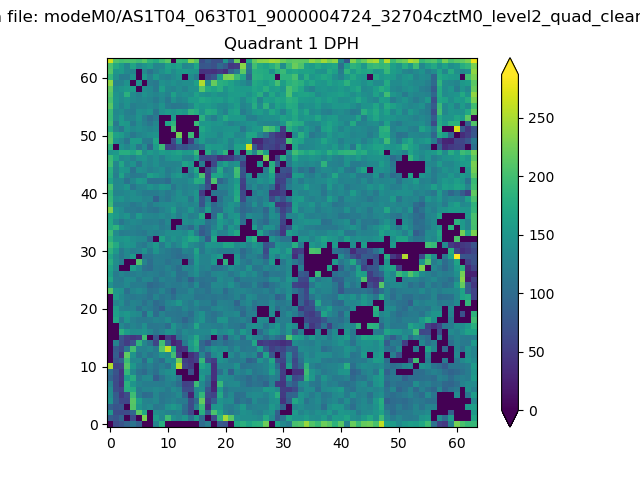 |
Quadrant B |
|---|---|---|---|
| Quadrant D | 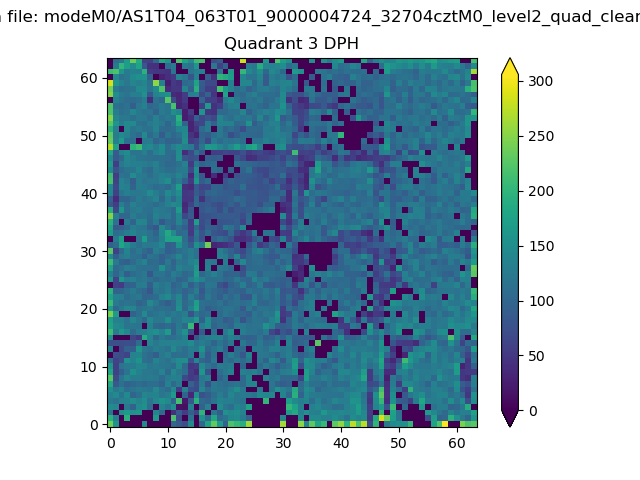 |
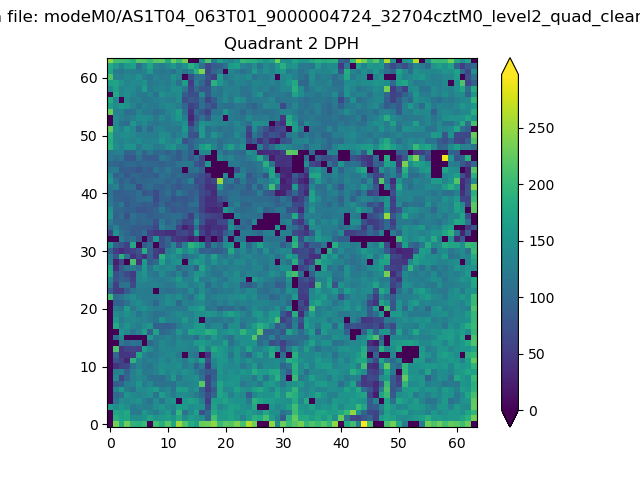 |
Quadrant C |
| Plot type | Count rate plots | Images |
|---|---|---|
| Comparison with Poisson distribution Blue bars denote a histogram of data divided into 1 sec bins. Red curve is a Poisson curve with rate = median count rate of data. |
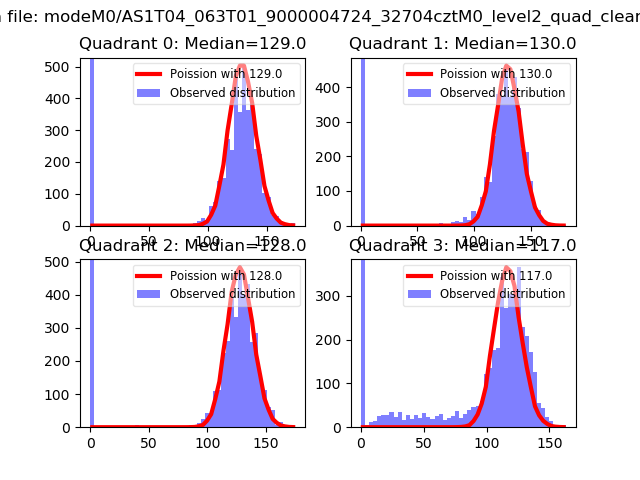 |
 |
| Quadrant-wise count rates Data is divided into 100 sec bins |
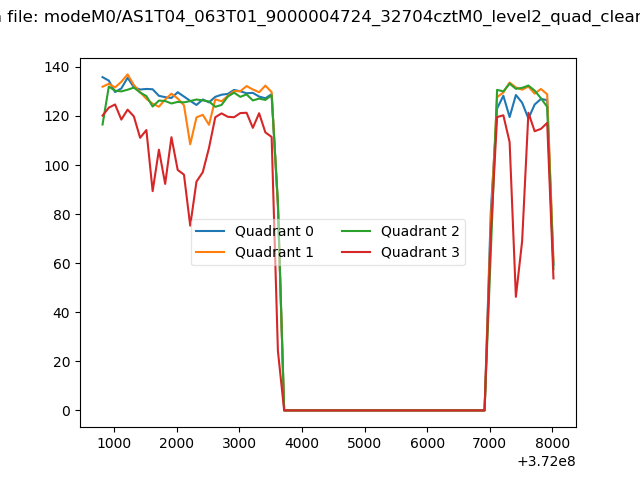 |
|
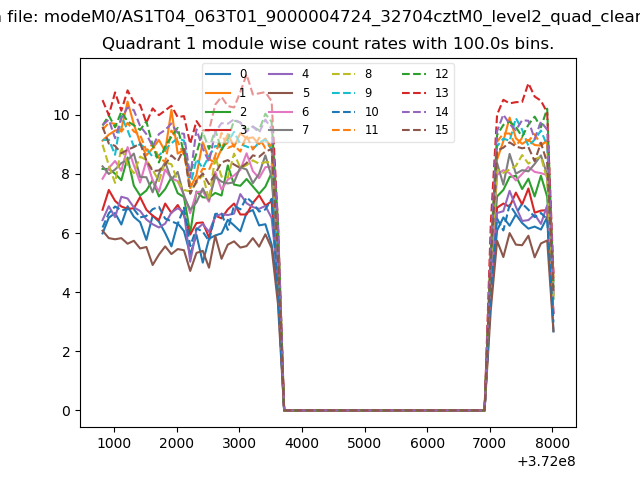
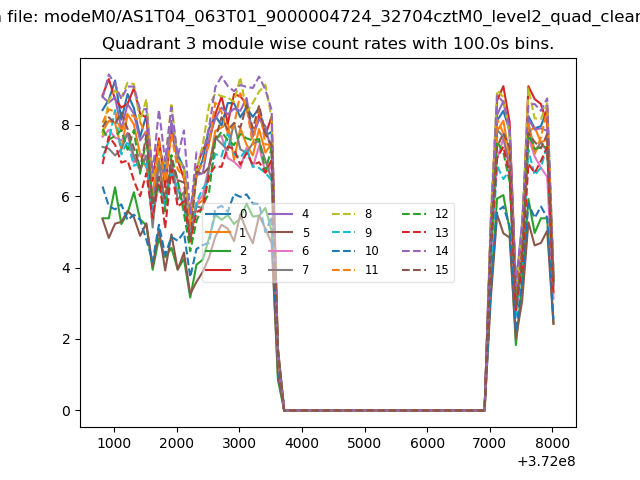
| Module-wise count rates for Quadrant A Data is divided into 100 sec bins |
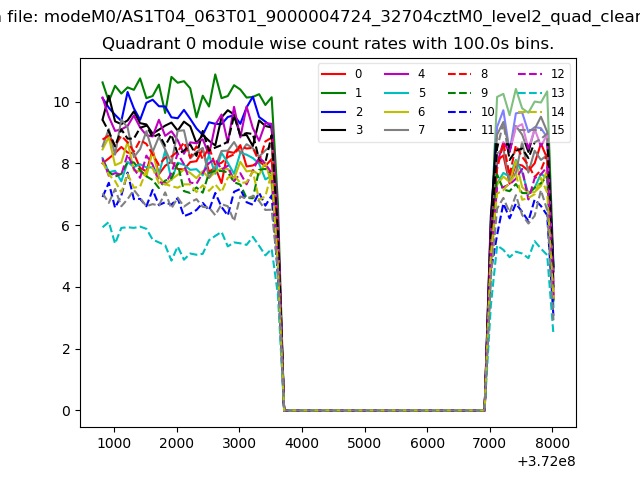 |
 |
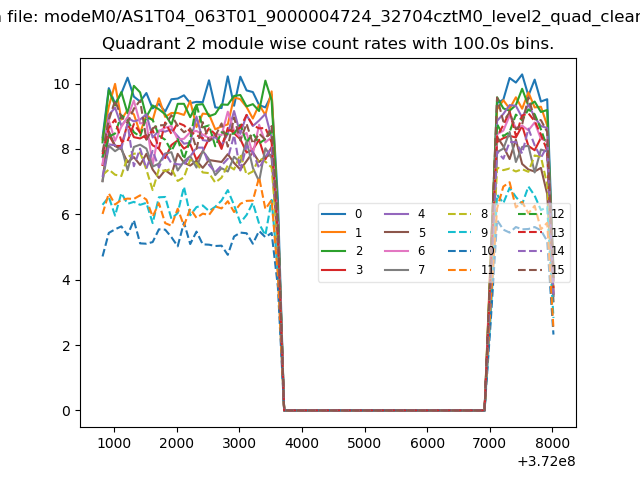
| Module-wise count rates for Quadrant B Data is divided into 100 sec bins |
 |
 |
| Module-wise count rates for Quadrant C Data is divided into 100 sec bins |
 |
 |
| Module-wise count rates for Quadrant D Data is divided into 100 sec bins |
 |
 |
| Parameter | Plot |
|---|---|
| CZT HV Monitor |  |
| D_VDD | 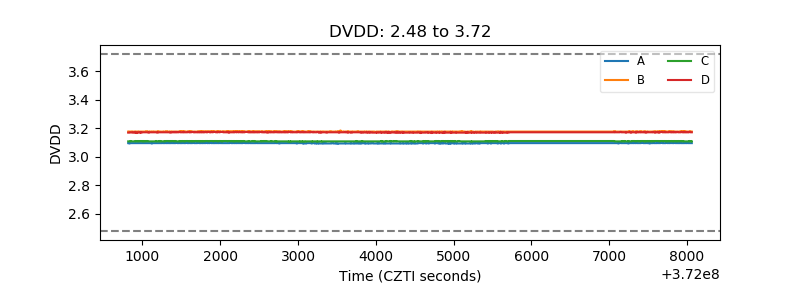 |
| Temperature 1 | 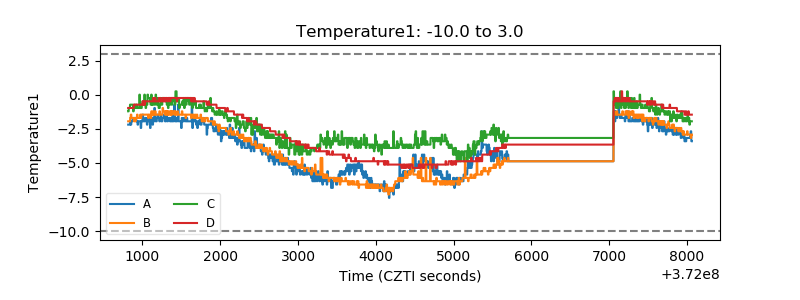 |
| Veto HV Monitor | 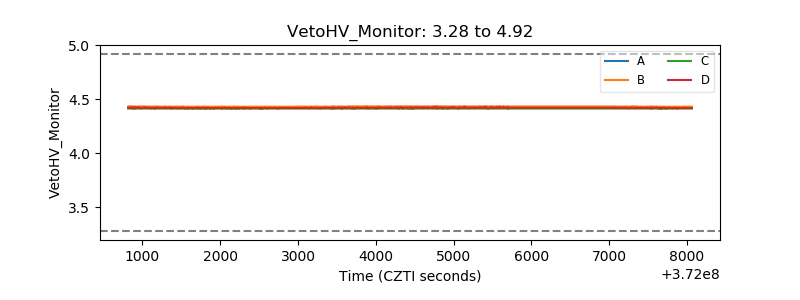 |
| Veto LLD | 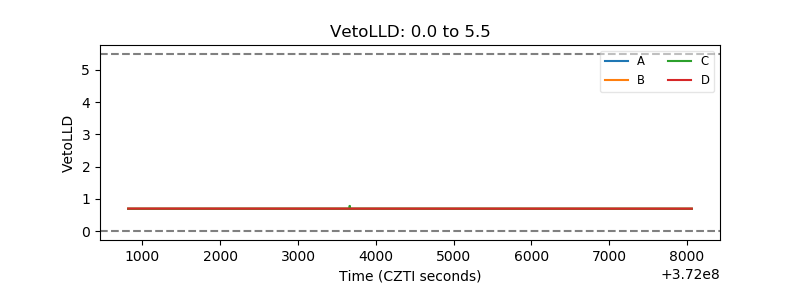 |
| Alpha Counter | 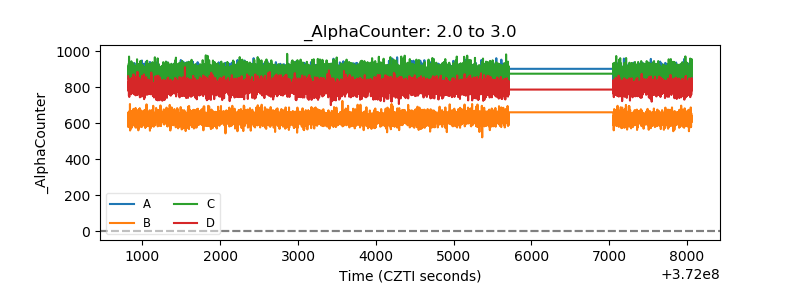 |
| _CPM_Rate | 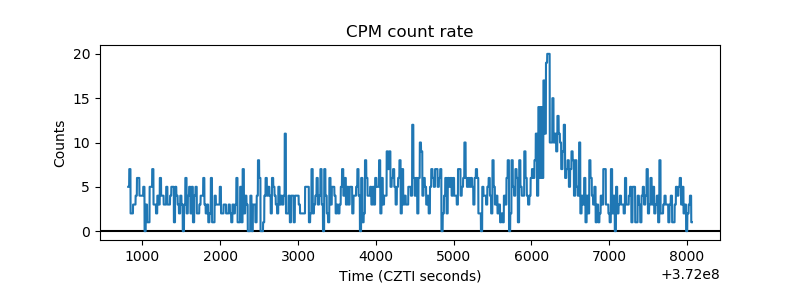 |
| CZT Counter | 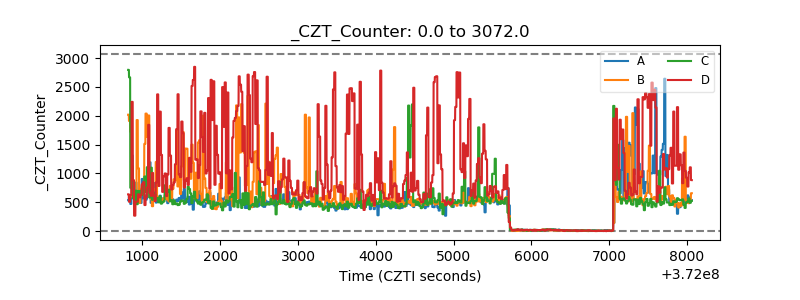 |
| +2.5 Volts monitor | 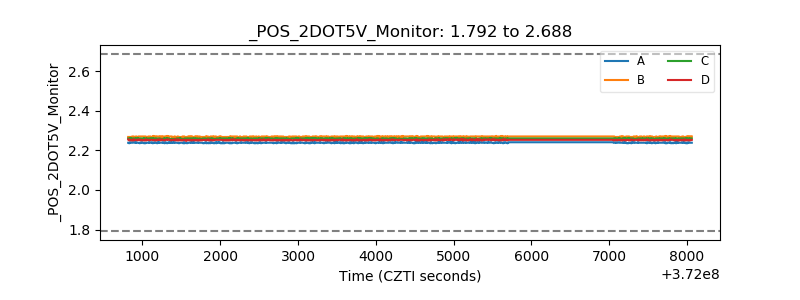 |
| +5 Volts monitor | 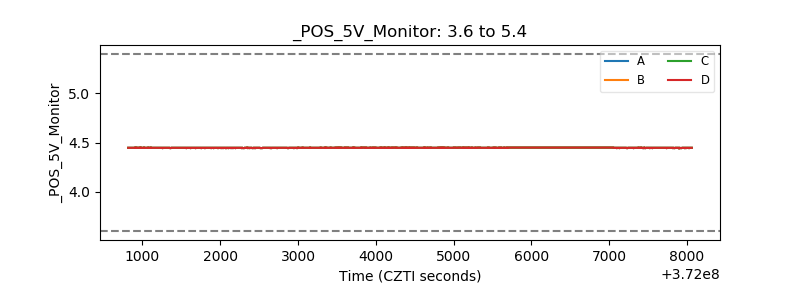 |
| _ROLL_ROT | 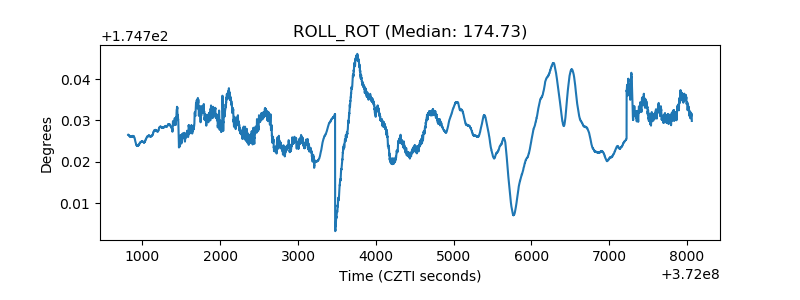 |
| _Roll_DEC | 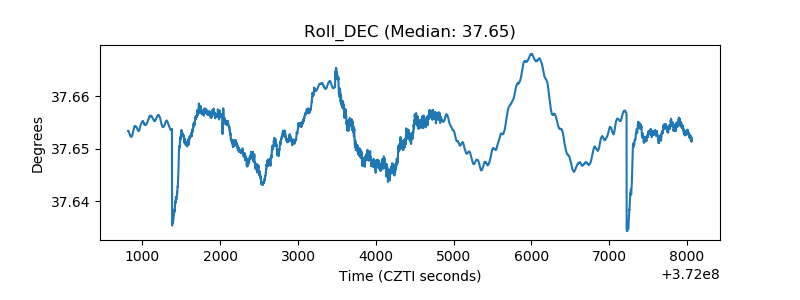 |
| _Roll_RA | 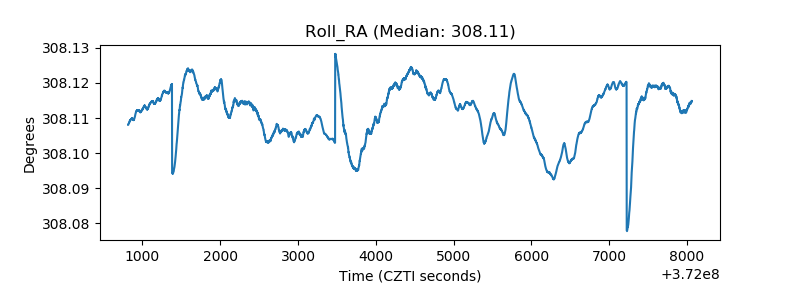 |
| Veto Counter | 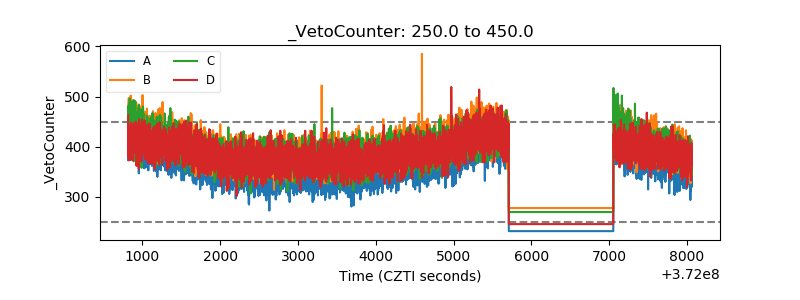 |