| Param | Original file | Final file |
|---|---|---|
| Filename | modeM0/AS1T04_063T01_9000004724_32708cztM0_level2.evt | modeM0/AS1T04_063T01_9000004724_32708cztM0_level2_quad_clean.evt |
| Size (bytes) | 1,497,965,760 | 164,952,000 |
| Size | 1.4 GB | 157.3 MB |
| Events in quadrant A | 13,406,591 | 963,489 |
| Events in quadrant B | 7,987,334 | 1,068,678 |
| Events in quadrant C | 7,750,082 | 1,052,045 |
| Events in quadrant D | 15,253,348 | 915,732 |
| Mode SS | |||
|---|---|---|---|
| Quadrant | BADHDUFLAG | Total packets | Discarded packets |
| A | 0 | 294 | 0 |
| B | 0 | 294 | 0 |
| C | 0 | 294 | 0 |
| D | 0 | 294 | 0 |
| Mode M9 | |||
|---|---|---|---|
| Quadrant | BADHDUFLAG | Total packets | Discarded packets |
| A | 0 | 31 | 0 |
| B | 0 | 31 | 0 |
| C | 0 | 31 | 0 |
| D | 0 | 32 | 0 |
| Mode M0 | |||
|---|---|---|---|
| Quadrant | BADHDUFLAG | Total packets | Discarded packets |
| A | 0 | 49849 | 57 |
| B | 0 | 33265 | 32 |
| C | 0 | 32501 | 7 |
| D | 0 | 55448 | 54 |
| Quadrant | Total seconds | Saturated seconds | Saturation percentage |
|---|---|---|---|
| A | 14395 | 1981 | 13.761723% |
| B | 14396 | 157 | 1.090581% |
| C | 14403 | 120 | 0.833160% |
| D | 14393 | 1677 | 11.651497% |
Noise dominated data is calculated using 1-second bins in cleaned event files. If a bin has >2000 counts, and if more than 50% of those come from <1% of pixels, then it is considered to be noise-dominated and hence unusable.
| Quadrant | # 1 sec bins | Bins with >0 counts | Bins with >2000 counts | High rate bins dominated by noise | Noise dominated (total time) | Noise dominated (detector-on time) | Marked lightcurve |
|---|---|---|---|---|---|---|---|
| A | 17120 | 14405 | 1403 | 1403 | 8.20% | 9.74% | 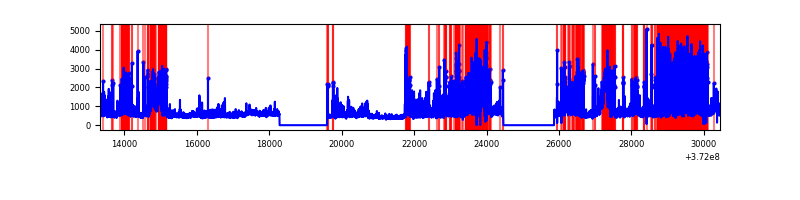 |
| B | 17120 | 14403 | 61 | 61 | 0.36% | 0.42% | 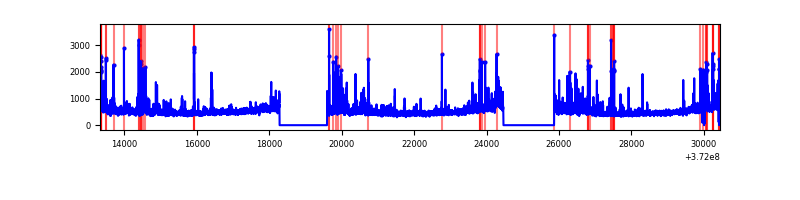 |
| C | 17120 | 14406 | 86 | 86 | 0.50% | 0.60% | 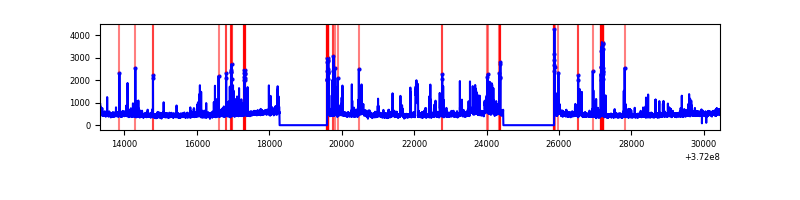 |
| D | 17120 | 14404 | 1492 | 1492 | 8.71% | 10.36% | 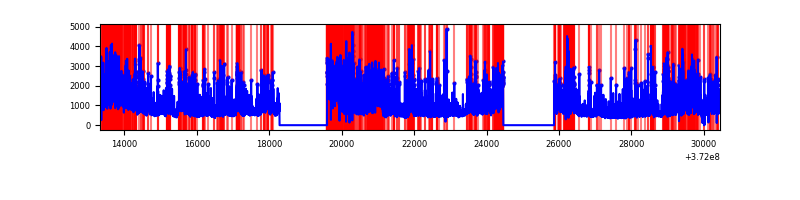 |
Top three noisy pixels from each quadrant. If the there are fewer than three noisy pixels in the level2.evt file, extra rows are filled as -1
| Pixel properties | Quadrant properties | ||||||
|---|---|---|---|---|---|---|---|
| Quadrant | DetID | PixID | Counts | Sigma | Mean | Median | Sigma |
| A | 15 | 249 | 5332324 | 16845.36 | 1575 | 1549 | 316.5 |
| A | 15 | 237 | 1749416 | 5523.29 | 1575 | 1549 | 316.5 |
| A | 10 | 228 | 49394 | 151.19 | 1575 | 1549 | 316.5 |
| B | 4 | 251 | 342826 | 1071.72 | 1699 | 1667 | 318.3 |
| B | 0 | 219 | 260408 | 812.81 | 1699 | 1667 | 318.3 |
| B | 0 | 199 | 219475 | 684.22 | 1699 | 1667 | 318.3 |
| C | 0 | 10 | 803628 | 2098.22 | 1640 | 1657 | 382.2 |
| C | 9 | 236 | 328845 | 856.03 | 1640 | 1657 | 382.2 |
| C | 0 | 207 | 67367 | 171.92 | 1640 | 1657 | 382.2 |
| D | 2 | 249 | 1901478 | 5092.51 | 1555 | 1522 | 373.1 |
| D | 8 | 195 | 1334208 | 3572.04 | 1555 | 1522 | 373.1 |
| D | 14 | 52 | 1251208 | 3349.57 | 1555 | 1522 | 373.1 |
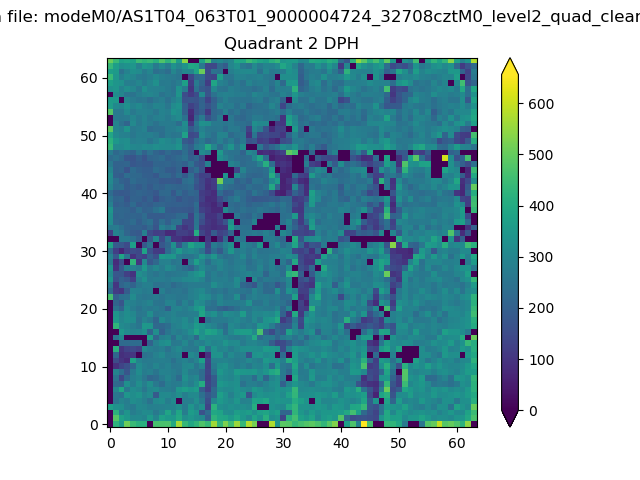
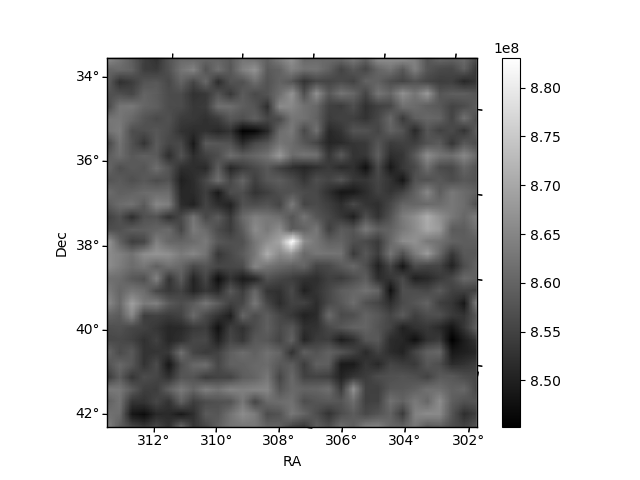
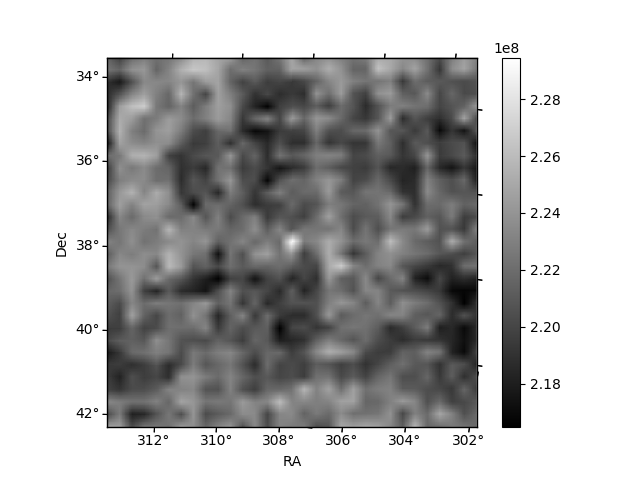
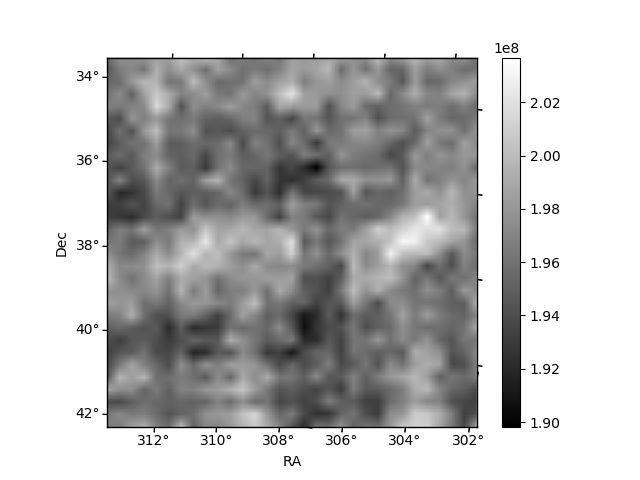
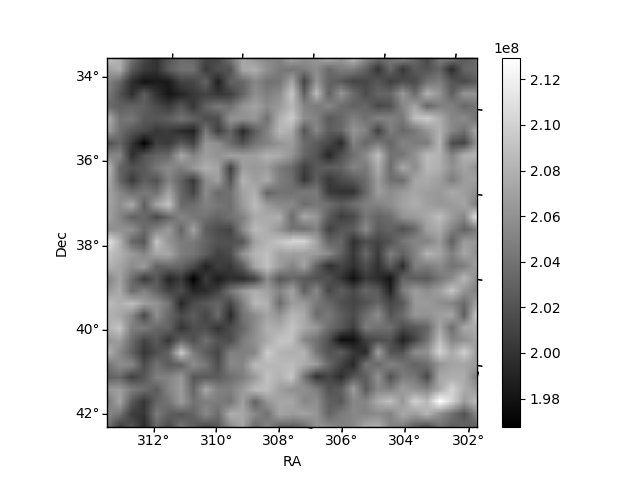
Histogram calculated using DETX and DETY for each event in the final _common_clean file
| Quadrant A | 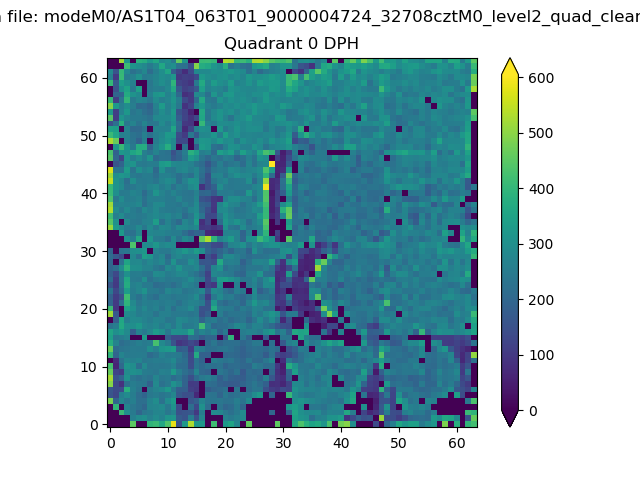 |
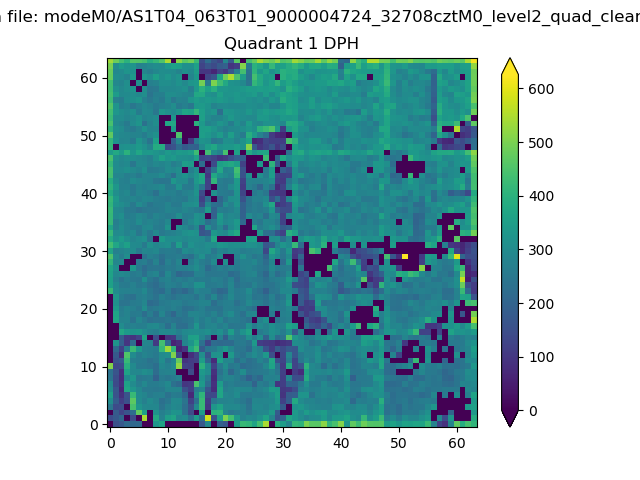 |
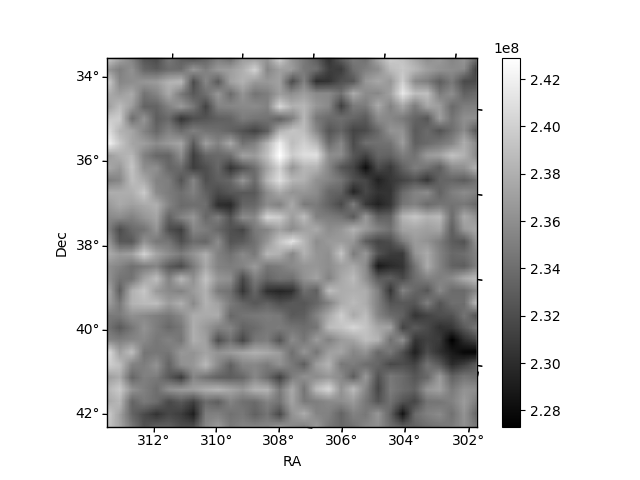
Quadrant B |
|---|---|---|---|
| Quadrant D | 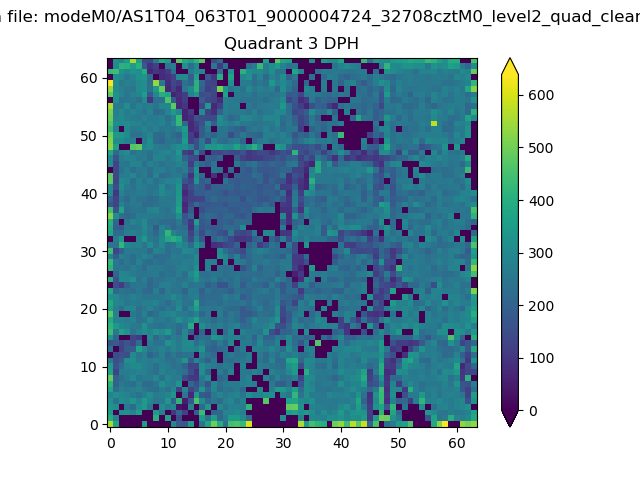 |
 |
Quadrant C |
| Plot type | Count rate plots | Images |
|---|---|---|
| Comparison with Poisson distribution Blue bars denote a histogram of data divided into 1 sec bins. Red curve is a Poisson curve with rate = median count rate of data. |
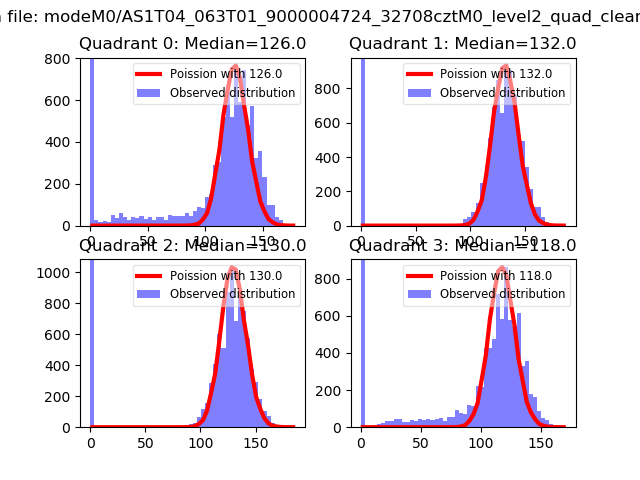 |
 |
| Quadrant-wise count rates Data is divided into 100 sec bins |
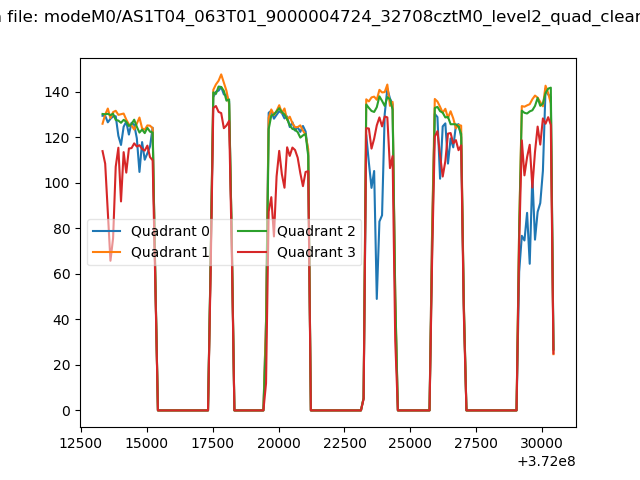 |
|
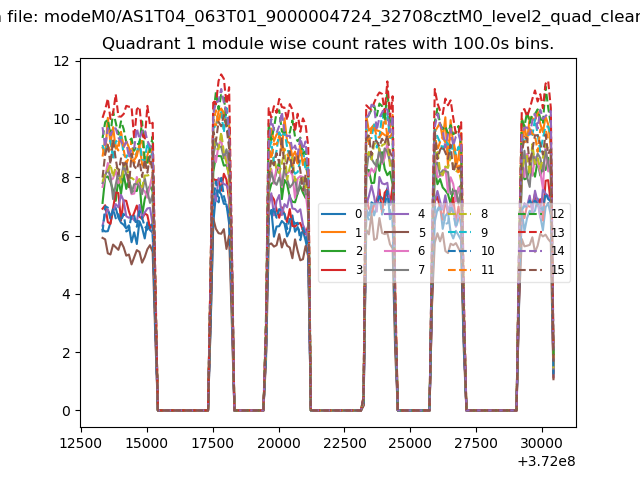
| Module-wise count rates for Quadrant A Data is divided into 100 sec bins |
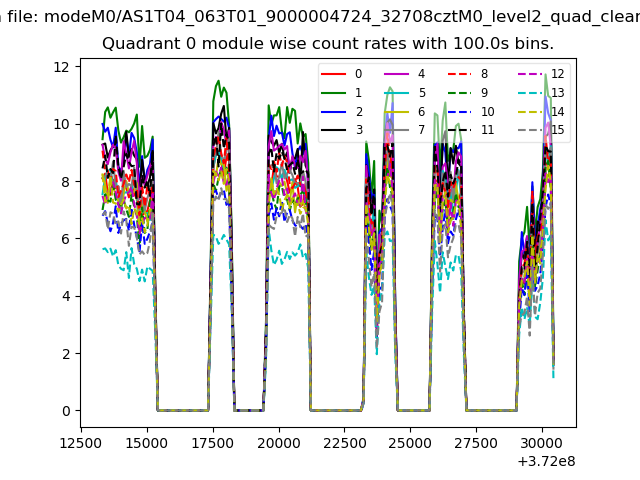 |
 |
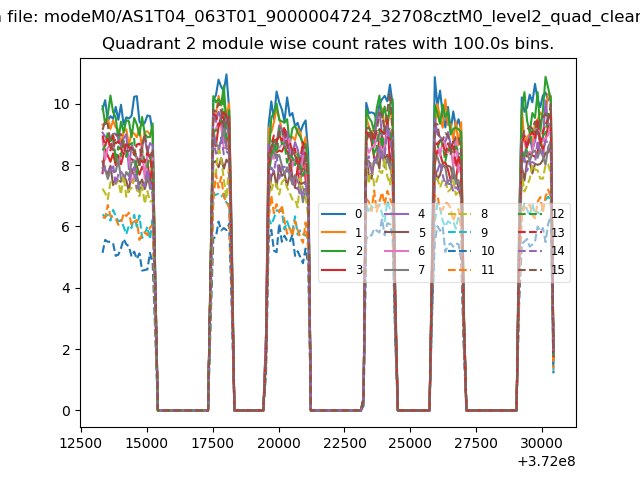
| Module-wise count rates for Quadrant B Data is divided into 100 sec bins |
 |
 |
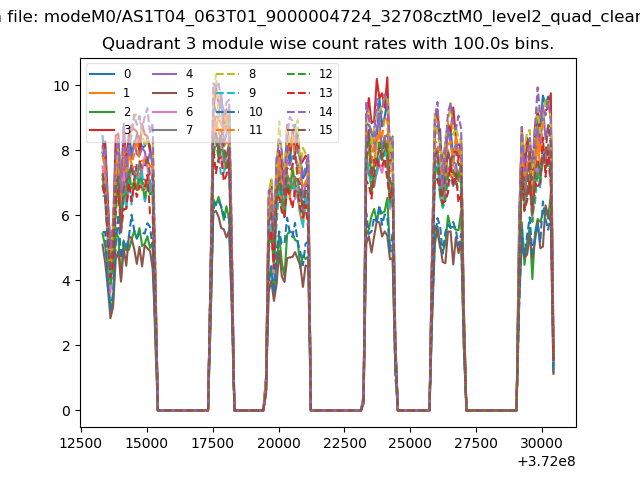
| Module-wise count rates for Quadrant C Data is divided into 100 sec bins |
 |
 |
| Module-wise count rates for Quadrant D Data is divided into 100 sec bins |
 |
 |
| Parameter | Plot |
|---|---|
| CZT HV Monitor | 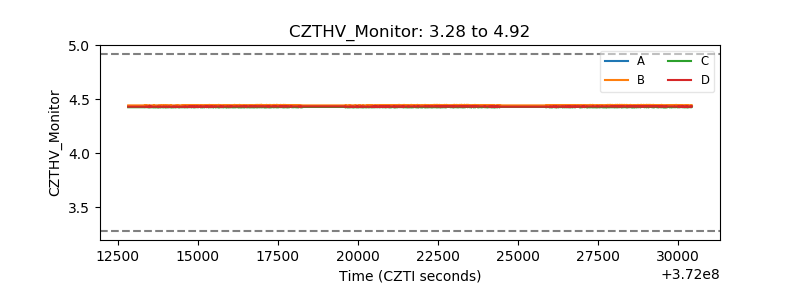 |
| D_VDD | 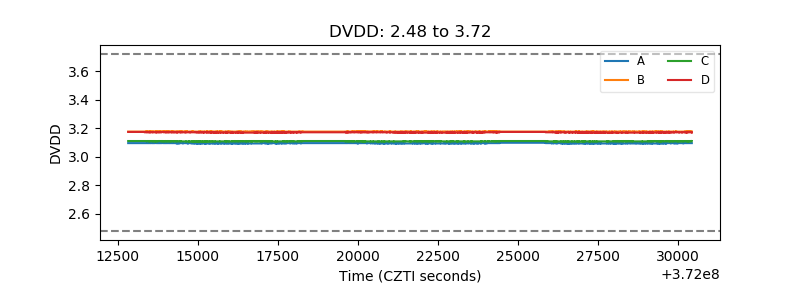 |
| Temperature 1 | 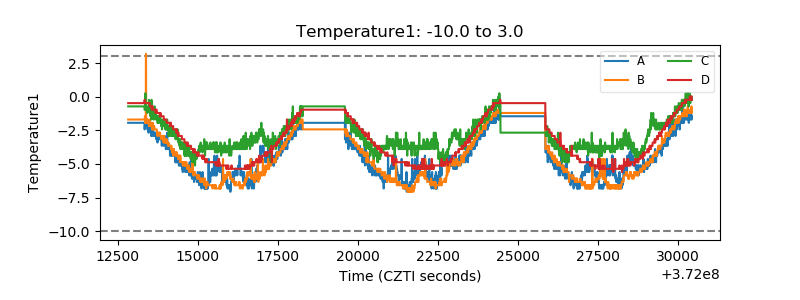 |
| Veto HV Monitor |  |
| Veto LLD | 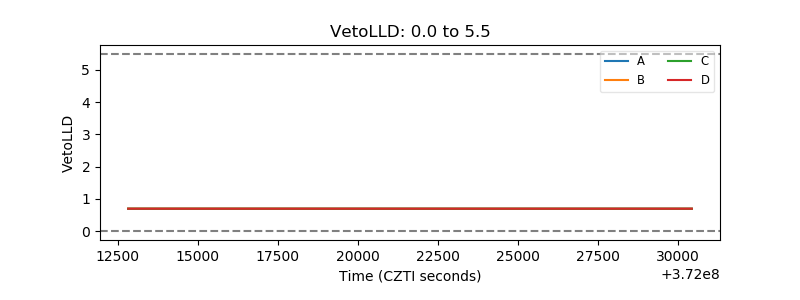 |
| Alpha Counter | 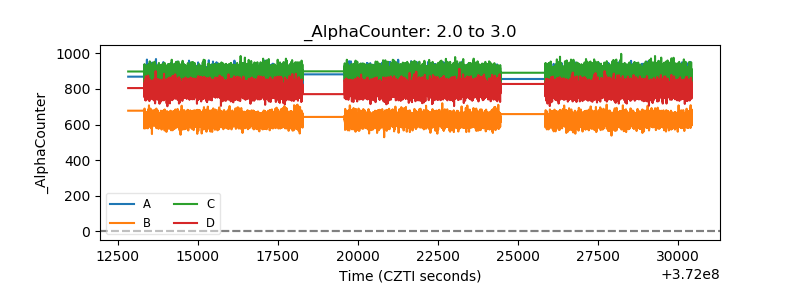 |
| _CPM_Rate | 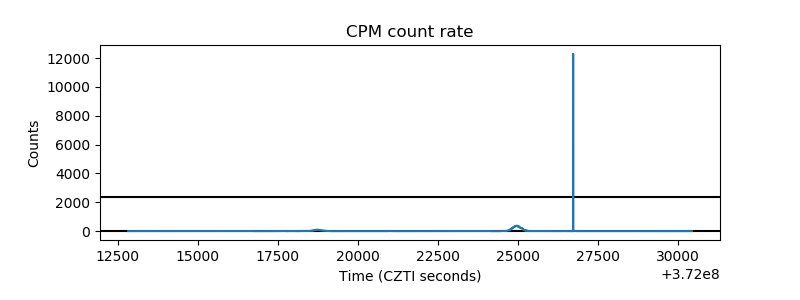 |
| CZT Counter | 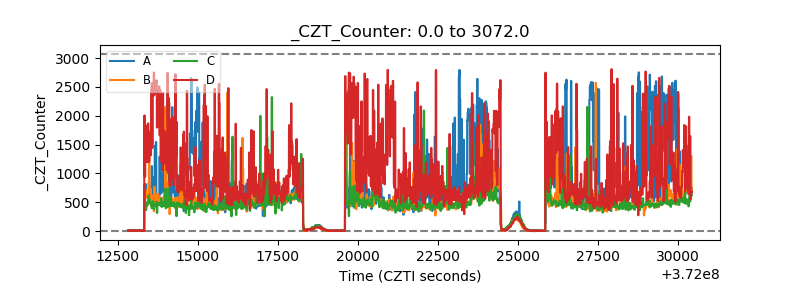 |
| +2.5 Volts monitor |  |
| +5 Volts monitor |  |
| _ROLL_ROT | 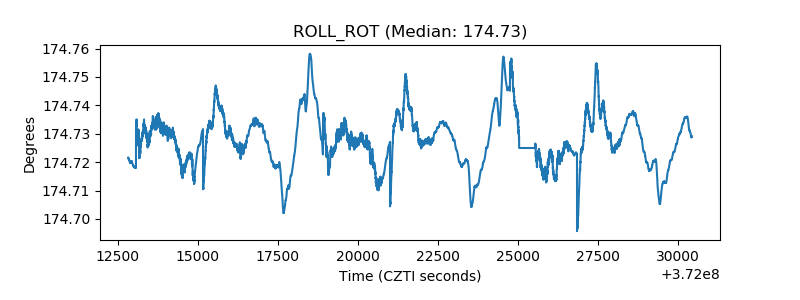 |
| _Roll_DEC | 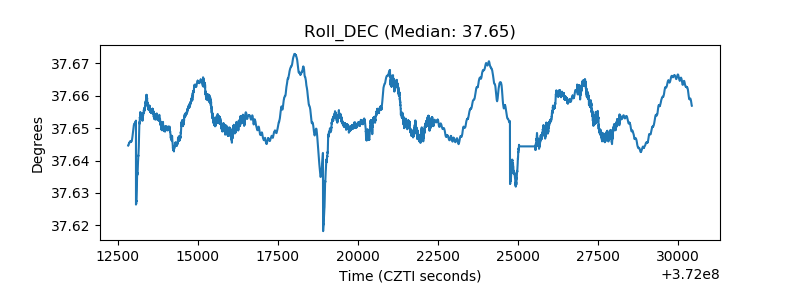 |
| _Roll_RA | 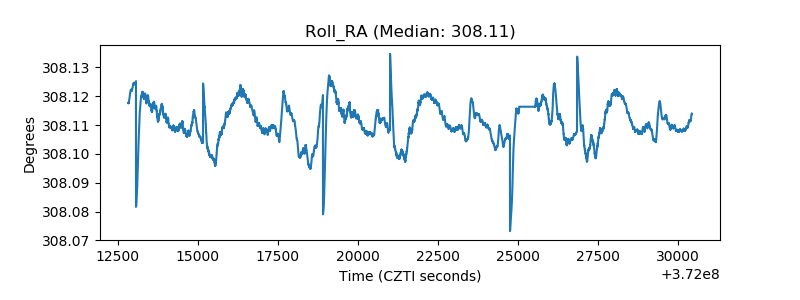 |
| Veto Counter | 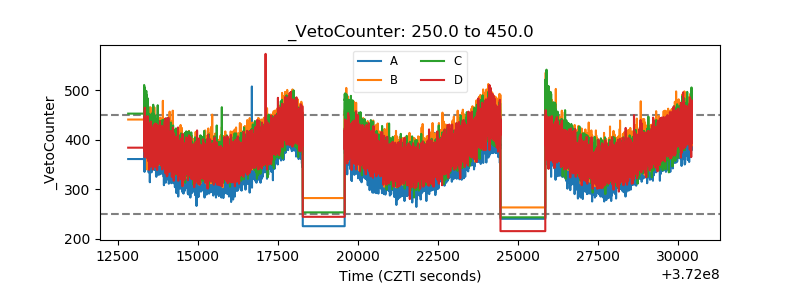 |