| Param | Original file | Final file |
|---|---|---|
| Filename | modeM0/AS1A10_123T04_9000004726_32708cztM0_level2.evt | modeM0/AS1A10_123T04_9000004726_32708cztM0_level2_quad_clean.evt |
| Size (bytes) | 101,188,800 | 16,680,960 |
| Size | 96.5 MB | 15.9 MB |
| Events in quadrant A | 641,565 | 105,443 |
| Events in quadrant B | 639,637 | 107,120 |
| Events in quadrant C | 614,221 | 106,982 |
| Events in quadrant D | 1,091,306 | 100,929 |
| Mode M0 | |||
|---|---|---|---|
| Quadrant | BADHDUFLAG | Total packets | Discarded packets |
| A | 0 | 2622 | 2 |
| B | 0 | 2566 | 1 |
| C | 0 | 2509 | 1 |
| D | 0 | 4031 | 1 |
| Mode M9 | |||
|---|---|---|---|
| Quadrant | BADHDUFLAG | Total packets | Discarded packets |
| A | 0 | 7 | 0 |
| B | 0 | 7 | 0 |
| C | 0 | 7 | 0 |
| D | 0 | 7 | 0 |
| Mode SS | |||
|---|---|---|---|
| Quadrant | BADHDUFLAG | Total packets | Discarded packets |
| A | 0 | 22 | 0 |
| B | 0 | 22 | 0 |
| C | 0 | 22 | 0 |
| D | 0 | 22 | 0 |
| Quadrant | Total seconds | Saturated seconds | Saturation percentage |
|---|---|---|---|
| A | 1103 | 5 | 0.453309% |
| B | 1103 | 10 | 0.906618% |
| C | 1103 | 23 | 2.085222% |
| D | 1103 | 86 | 7.796917% |
Noise dominated data is calculated using 1-second bins in cleaned event files. If a bin has >2000 counts, and if more than 50% of those come from <1% of pixels, then it is considered to be noise-dominated and hence unusable.
| Quadrant | # 1 sec bins | Bins with >0 counts | Bins with >2000 counts | High rate bins dominated by noise | Noise dominated (total time) | Noise dominated (detector-on time) | Marked lightcurve |
|---|---|---|---|---|---|---|---|
| A | 1103 | 1103 | 2 | 2 | 0.18% | 0.18% |  |
| B | 1103 | 1103 | 5 | 5 | 0.45% | 0.45% |  |
| C | 1103 | 1103 | 3 | 3 | 0.27% | 0.27% | 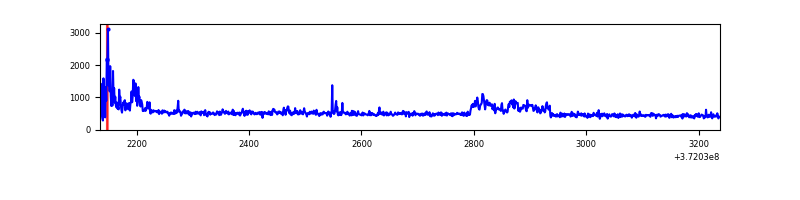 |
| D | 1103 | 1103 | 57 | 57 | 5.17% | 5.17% |  |
Top three noisy pixels from each quadrant. If the there are fewer than three noisy pixels in the level2.evt file, extra rows are filled as -1
| Pixel properties | Quadrant properties | ||||||
|---|---|---|---|---|---|---|---|
| Quadrant | DetID | PixID | Counts | Sigma | Mean | Median | Sigma |
| A | 15 | 249 | 81591 | 2777.16 | 134 | 132 | 29.3 |
| A | 15 | 237 | 24794 | 840.8 | 134 | 132 | 29.3 |
| A | 12 | 189 | 7038 | 235.44 | 134 | 132 | 29.3 |
| B | 4 | 251 | 40443 | 1418.88 | 137 | 134 | 28.4 |
| B | 0 | 199 | 23261 | 814.07 | 137 | 134 | 28.4 |
| B | 0 | 219 | 15759 | 550.0 | 137 | 134 | 28.4 |
| C | 0 | 10 | 85509 | 2607.76 | 132 | 133 | 32.7 |
| C | 6 | 96 | 6559 | 196.28 | 132 | 133 | 32.7 |
| C | 3 | 233 | 2515 | 72.76 | 132 | 133 | 32.7 |
| D | 2 | 249 | 125883 | 3917.77 | 128 | 125 | 32.1 |
| D | 8 | 195 | 118633 | 3691.91 | 128 | 125 | 32.1 |
| D | 12 | 218 | 69986 | 2176.4 | 128 | 125 | 32.1 |
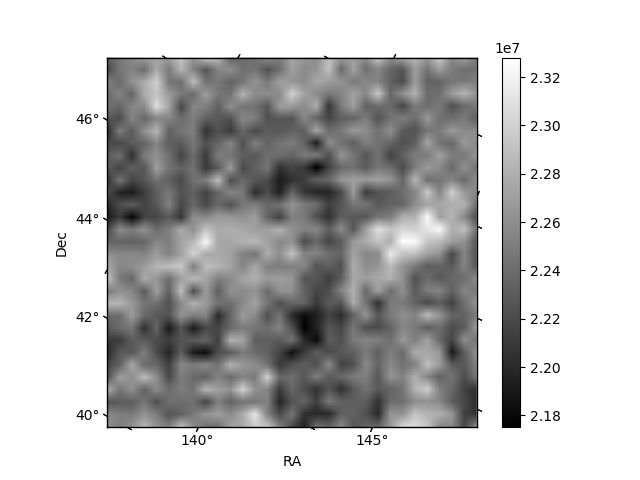
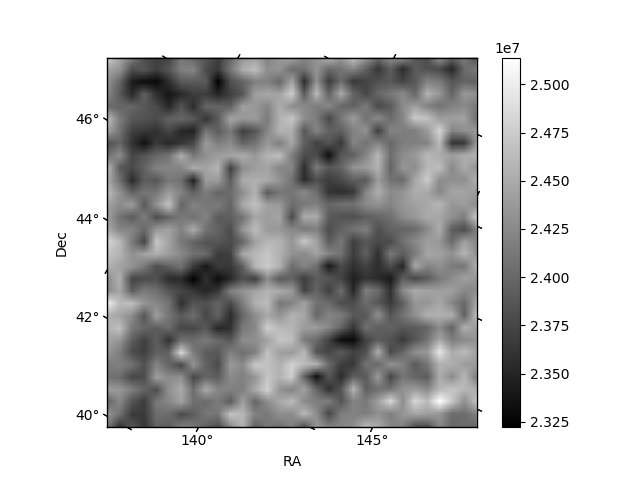
Histogram calculated using DETX and DETY for each event in the final _common_clean file
| Quadrant A | 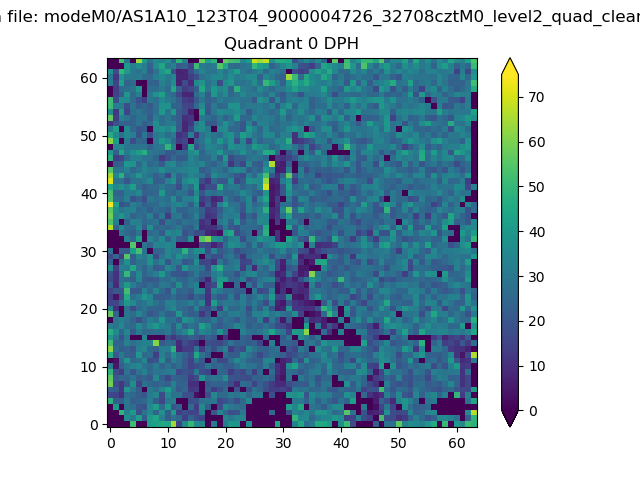 |
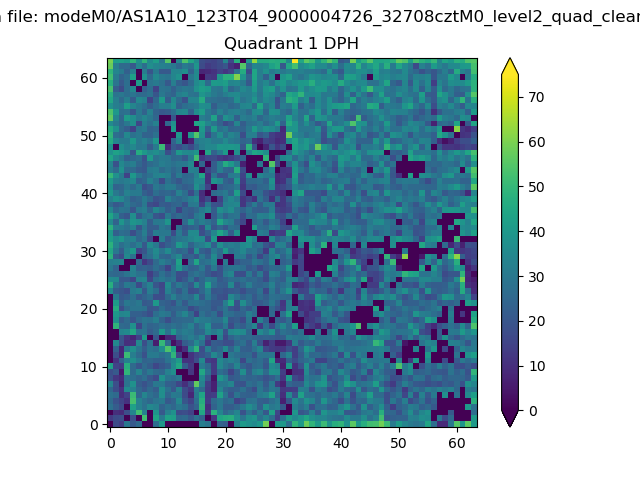 |
Quadrant B |
|---|---|---|---|
| Quadrant D | 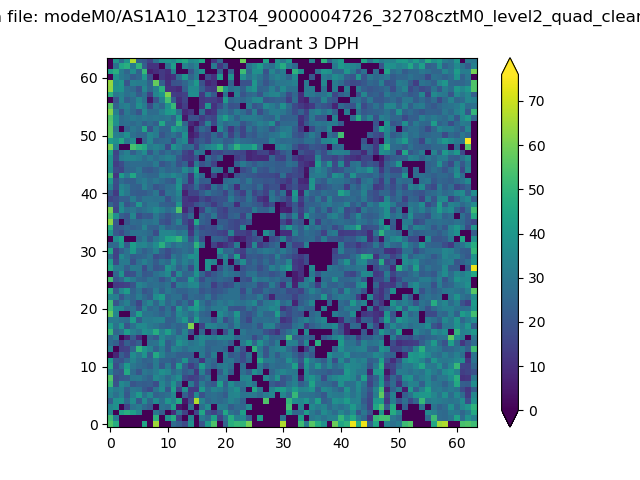 |
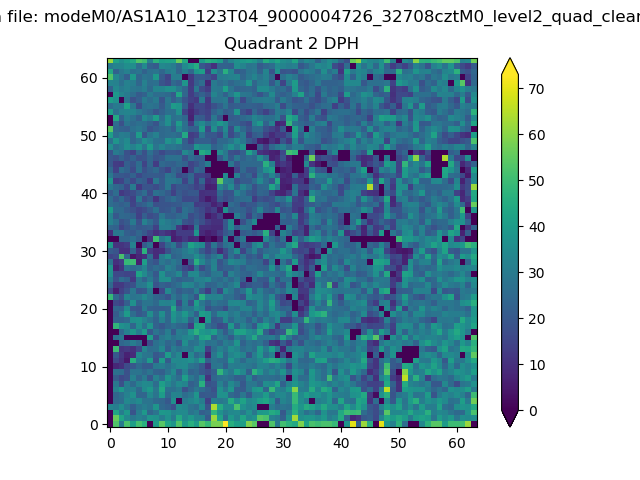 |
Quadrant C |
| Plot type | Count rate plots | Images |
|---|---|---|
| Comparison with Poisson distribution Blue bars denote a histogram of data divided into 1 sec bins. Red curve is a Poisson curve with rate = median count rate of data. |
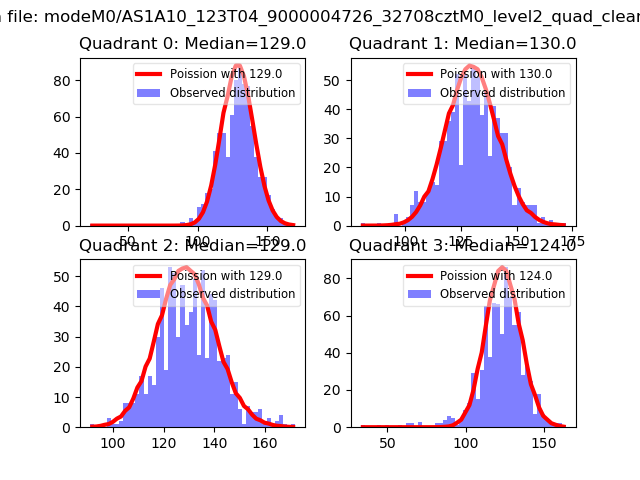 |
 |
| Quadrant-wise count rates Data is divided into 100 sec bins |
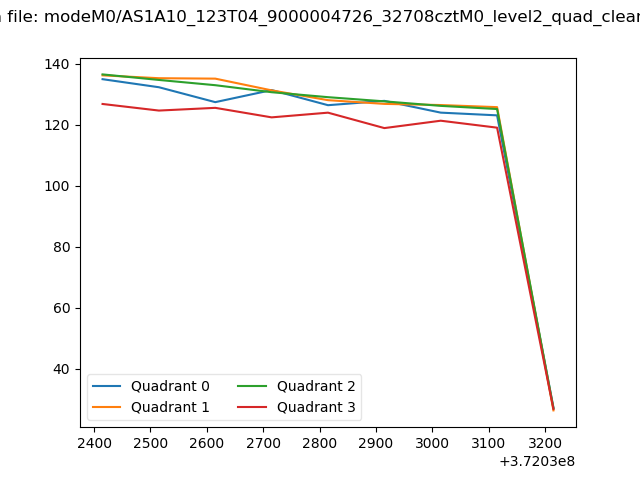 |
|
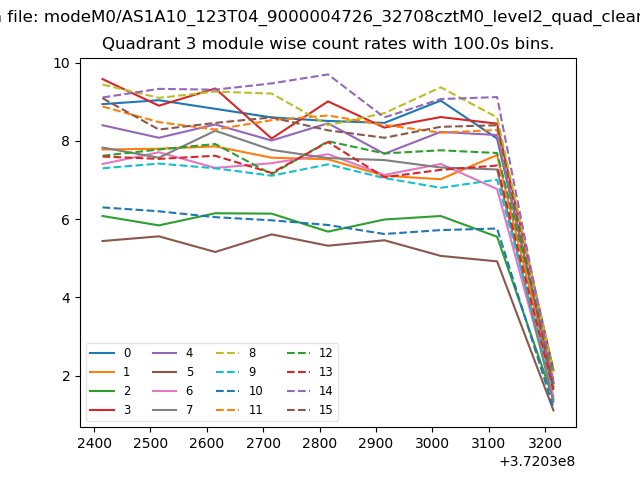
| Module-wise count rates for Quadrant A Data is divided into 100 sec bins |
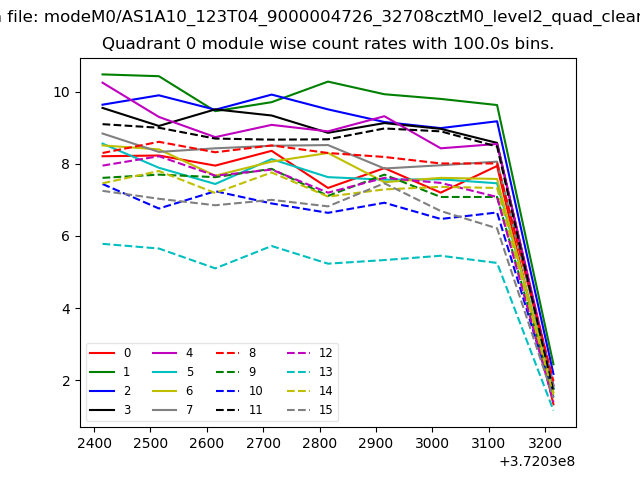 |
 |
| Module-wise count rates for Quadrant B Data is divided into 100 sec bins |
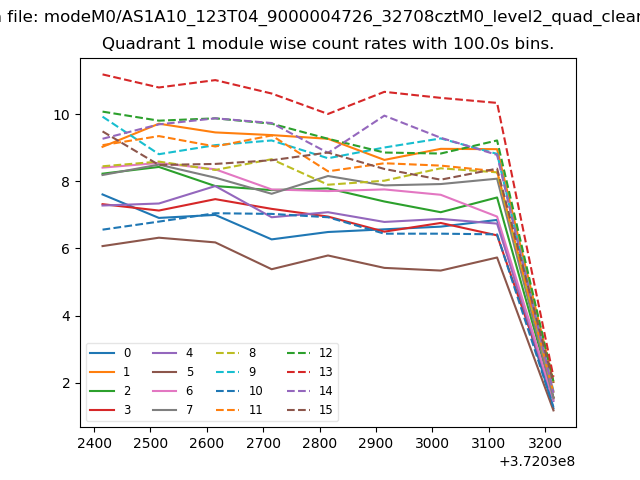 |
 |
| Module-wise count rates for Quadrant C Data is divided into 100 sec bins |
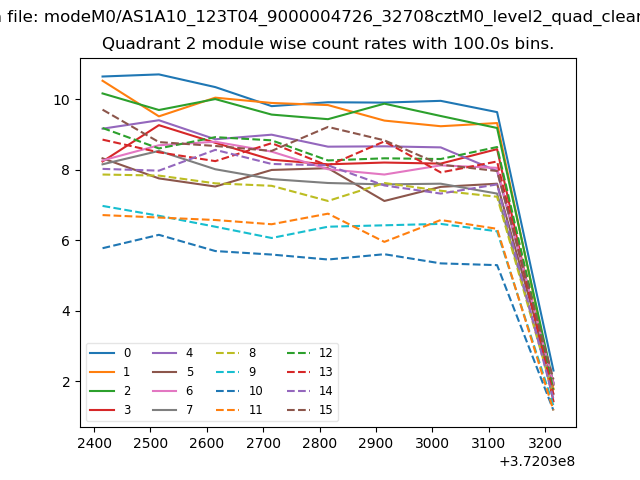 |
 |
| Module-wise count rates for Quadrant D Data is divided into 100 sec bins |
 |
 |
| Parameter | Plot |
|---|---|
| CZT HV Monitor | 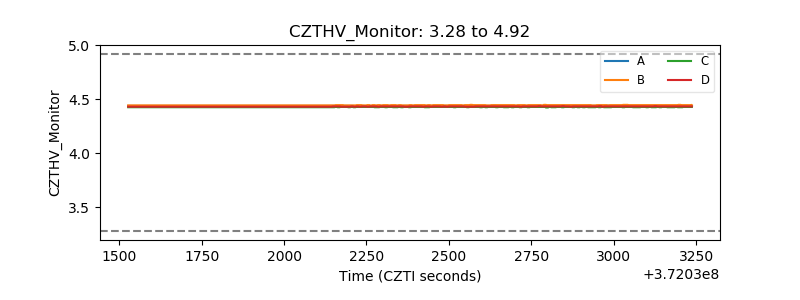 |
| D_VDD |  |
| Temperature 1 | 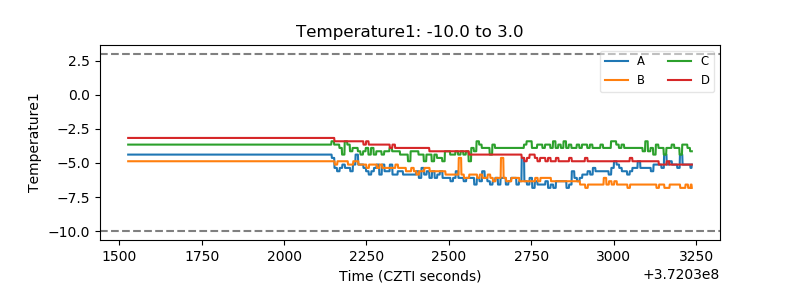 |
| Veto HV Monitor | 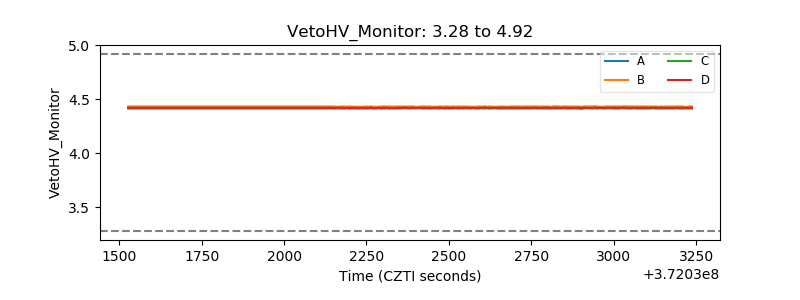 |
| Veto LLD | 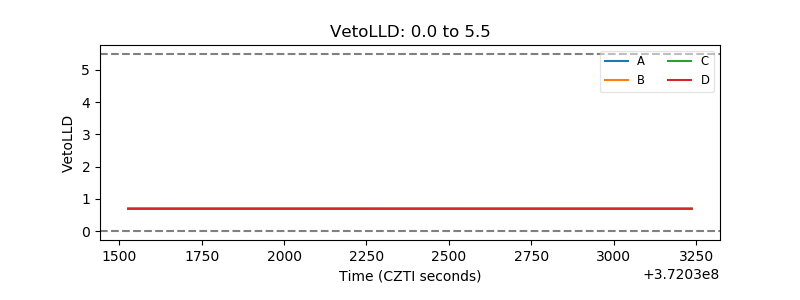 |
| Alpha Counter | 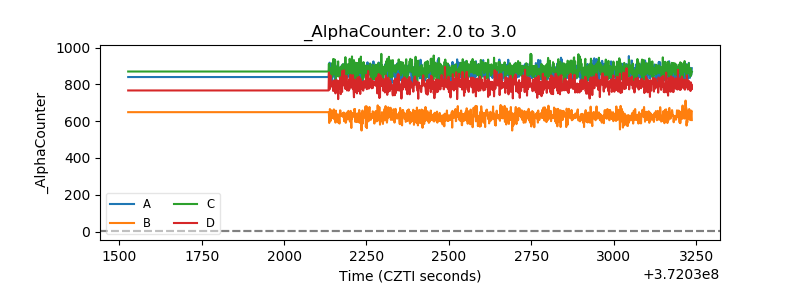 |
| _CPM_Rate | 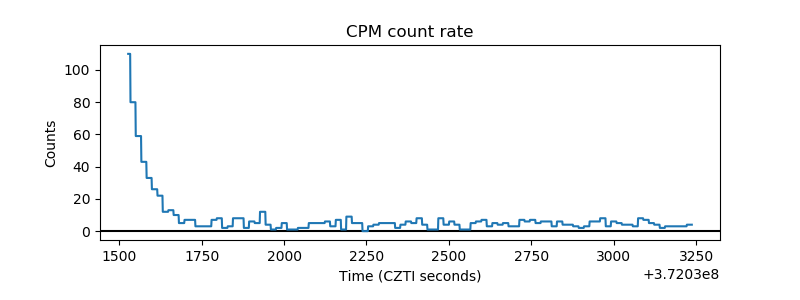 |
| CZT Counter | 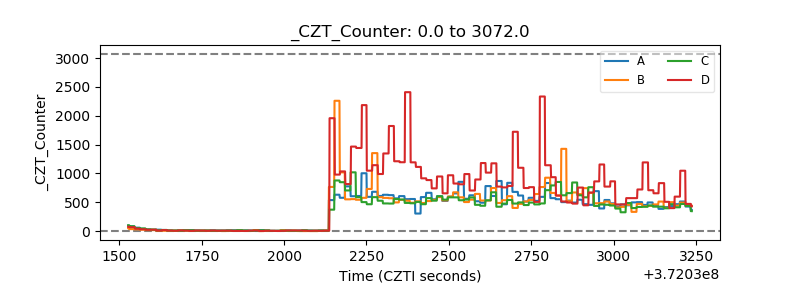 |
| +2.5 Volts monitor |  |
| +5 Volts monitor |  |
| _ROLL_ROT | 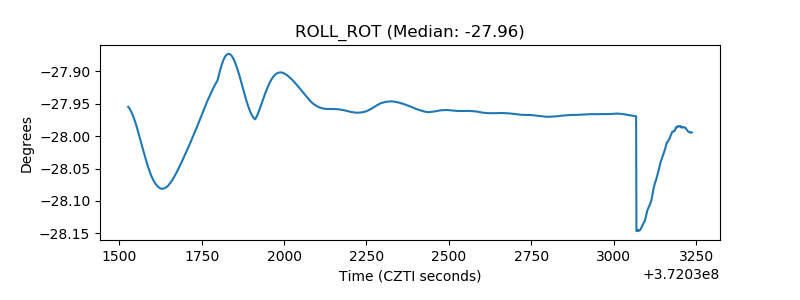 |
| _Roll_DEC | 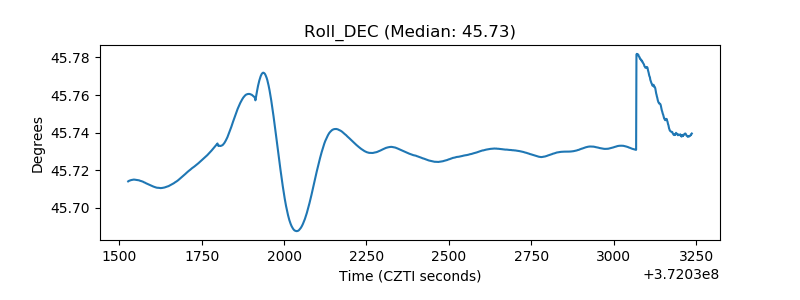 |
| _Roll_RA | 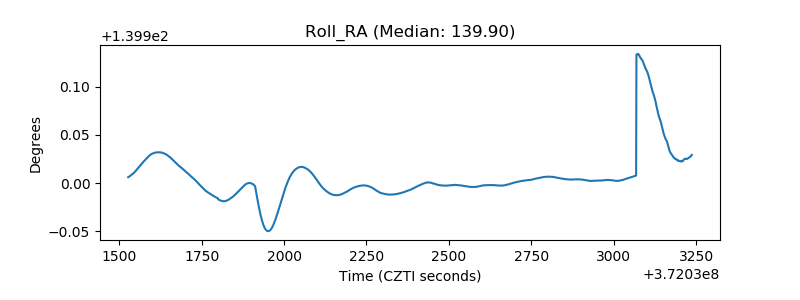 |
| Veto Counter | 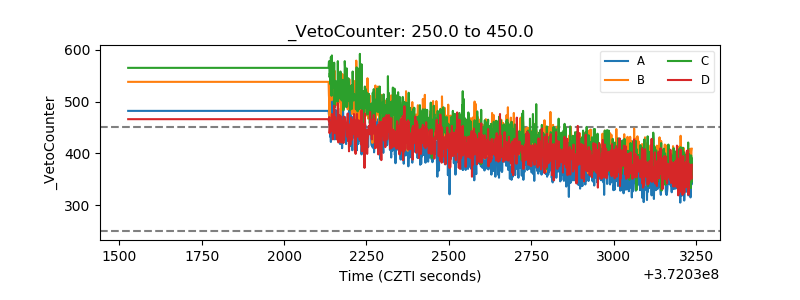 |