| Param | Original file | Final file |
|---|---|---|
| Filename | modeM0/AS1A10_123T04_9000004726_32709cztM0_level2.evt | modeM0/AS1A10_123T04_9000004726_32709cztM0_level2_quad_clean.evt |
| Size (bytes) | 468,149,760 | 90,529,920 |
| Size | 446.5 MB | 86.3 MB |
| Events in quadrant A | 3,398,947 | 589,842 |
| Events in quadrant B | 2,922,916 | 604,181 |
| Events in quadrant C | 2,826,100 | 599,773 |
| Events in quadrant D | 4,655,717 | 561,877 |
| Mode M0 | |||
|---|---|---|---|
| Quadrant | BADHDUFLAG | Total packets | Discarded packets |
| A | 0 | 13744 | 3 |
| B | 0 | 12359 | 2 |
| C | 0 | 12163 | 2 |
| D | 0 | 17779 | 2 |
| Mode M9 | |||
|---|---|---|---|
| Quadrant | BADHDUFLAG | Total packets | Discarded packets |
| A | 0 | 16 | 0 |
| B | 0 | 16 | 0 |
| C | 0 | 16 | 0 |
| D | 0 | 17 | 0 |
| Mode SS | |||
|---|---|---|---|
| Quadrant | BADHDUFLAG | Total packets | Discarded packets |
| A | 0 | 112 | 0 |
| B | 0 | 112 | 0 |
| C | 0 | 112 | 0 |
| D | 0 | 112 | 0 |
| Quadrant | Total seconds | Saturated seconds | Saturation percentage |
|---|---|---|---|
| A | 5516 | 125 | 2.266135% |
| B | 5516 | 49 | 0.888325% |
| C | 5516 | 68 | 1.232777% |
| D | 5516 | 342 | 6.200145% |
Noise dominated data is calculated using 1-second bins in cleaned event files. If a bin has >2000 counts, and if more than 50% of those come from <1% of pixels, then it is considered to be noise-dominated and hence unusable.
| Quadrant | # 1 sec bins | Bins with >0 counts | Bins with >2000 counts | High rate bins dominated by noise | Noise dominated (total time) | Noise dominated (detector-on time) | Marked lightcurve |
|---|---|---|---|---|---|---|---|
| A | 7159 | 5517 | 87 | 87 | 1.22% | 1.58% | 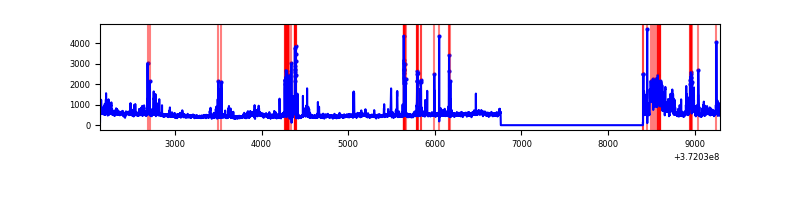 |
| B | 7159 | 5517 | 23 | 23 | 0.32% | 0.42% | 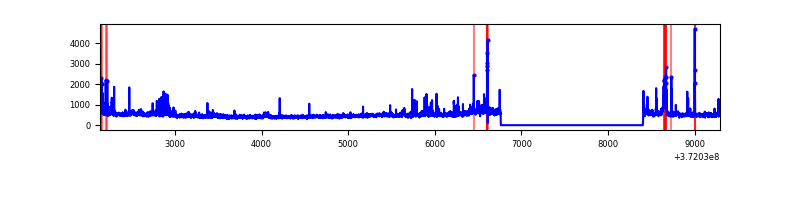 |
| C | 7159 | 5517 | 30 | 30 | 0.42% | 0.54% | 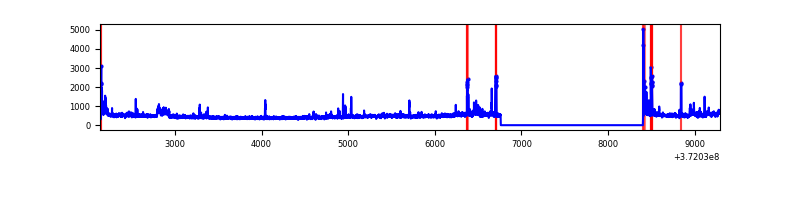 |
| D | 7159 | 5517 | 244 | 244 | 3.41% | 4.42% | 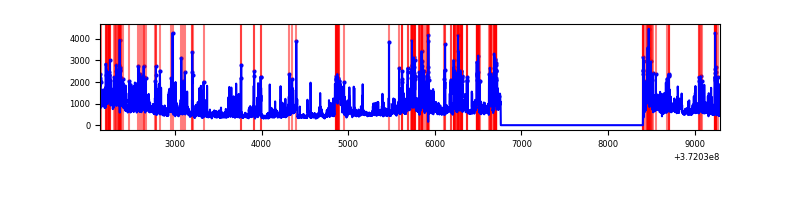 |
Top three noisy pixels from each quadrant. If the there are fewer than three noisy pixels in the level2.evt file, extra rows are filled as -1
| Pixel properties | Quadrant properties | ||||||
|---|---|---|---|---|---|---|---|
| Quadrant | DetID | PixID | Counts | Sigma | Mean | Median | Sigma |
| A | 15 | 249 | 537307 | 4145.63 | 641 | 628 | 129.5 |
| A | 15 | 237 | 355184 | 2738.8 | 641 | 628 | 129.5 |
| A | 12 | 189 | 10239 | 74.24 | 641 | 628 | 129.5 |
| B | 4 | 251 | 132399 | 1062.57 | 651 | 638 | 124.0 |
| B | 0 | 219 | 64323 | 513.58 | 651 | 638 | 124.0 |
| B | 0 | 199 | 60883 | 485.84 | 651 | 638 | 124.0 |
| C | 0 | 10 | 241756 | 1653.62 | 625 | 629 | 145.8 |
| C | 6 | 96 | 44799 | 302.91 | 625 | 629 | 145.8 |
| C | 3 | 233 | 41052 | 277.22 | 625 | 629 | 145.8 |
| D | 2 | 249 | 517936 | 3496.8 | 611 | 596 | 147.9 |
| D | 2 | 250 | 390060 | 2632.46 | 611 | 596 | 147.9 |
| D | 8 | 195 | 342882 | 2313.57 | 611 | 596 | 147.9 |
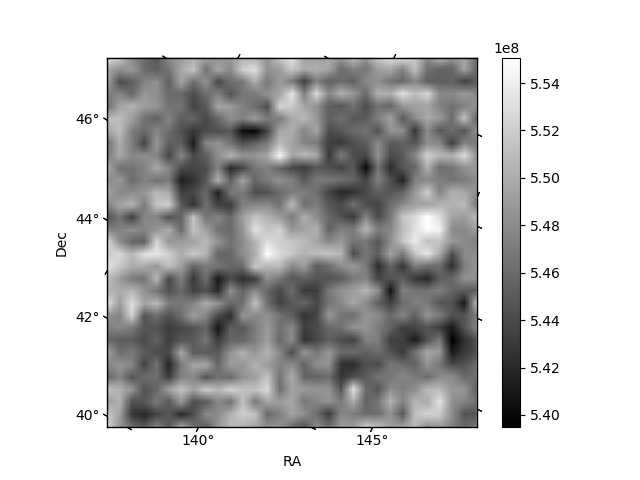
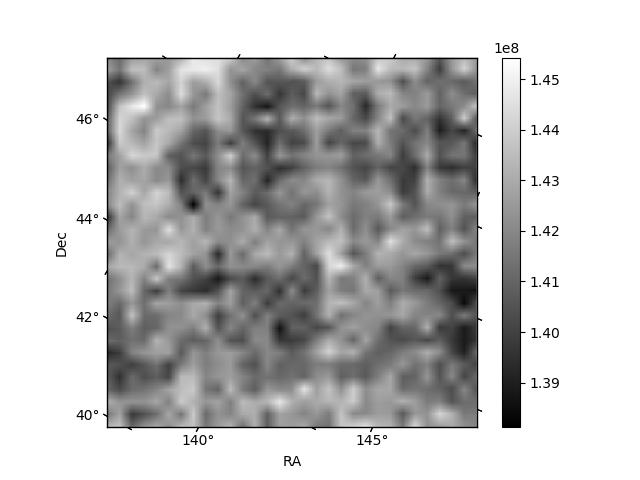
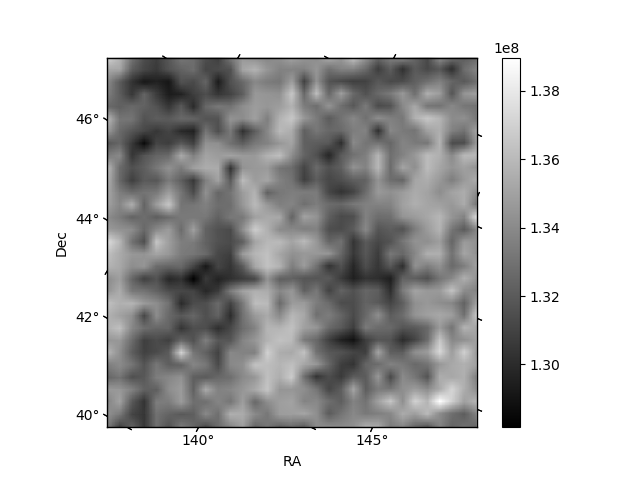
Histogram calculated using DETX and DETY for each event in the final _common_clean file
| Quadrant A | 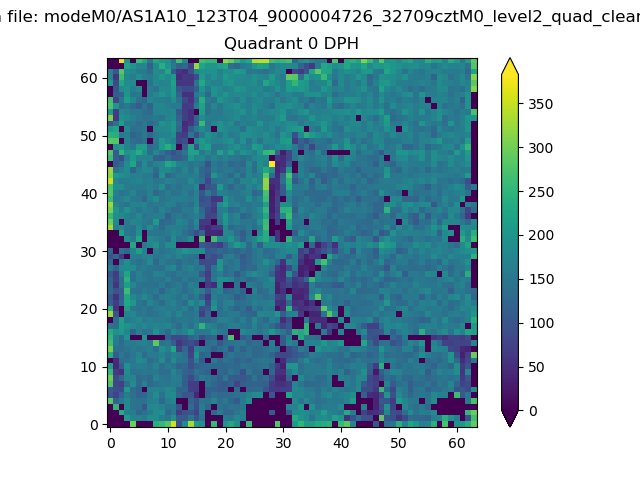 |
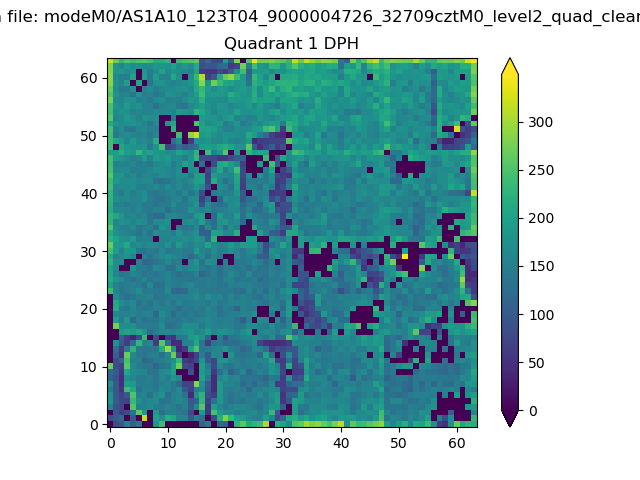 |
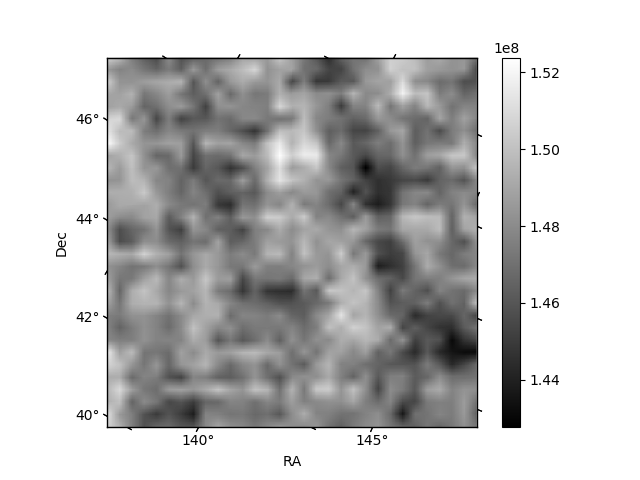
Quadrant B |
|---|---|---|---|
| Quadrant D | 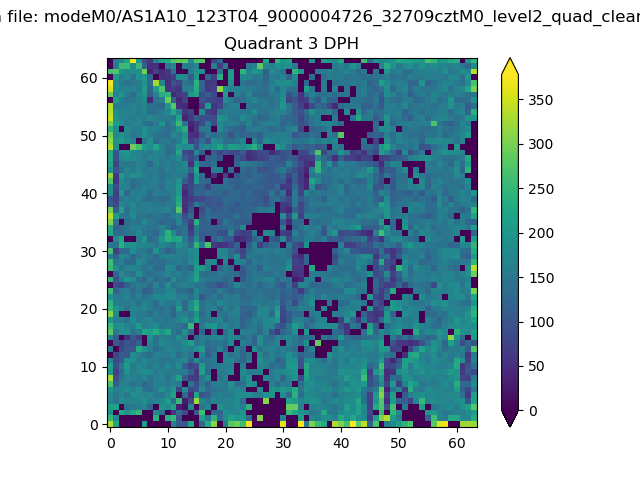 |
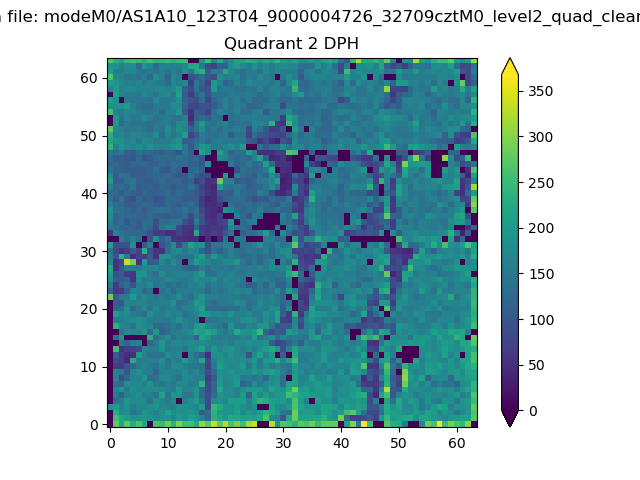 |
Quadrant C |
| Plot type | Count rate plots | Images |
|---|---|---|
| Comparison with Poisson distribution Blue bars denote a histogram of data divided into 1 sec bins. Red curve is a Poisson curve with rate = median count rate of data. |
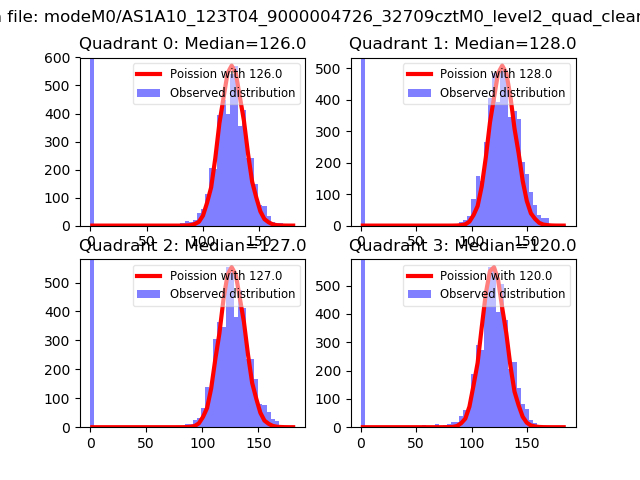 |
 |
| Quadrant-wise count rates Data is divided into 100 sec bins |
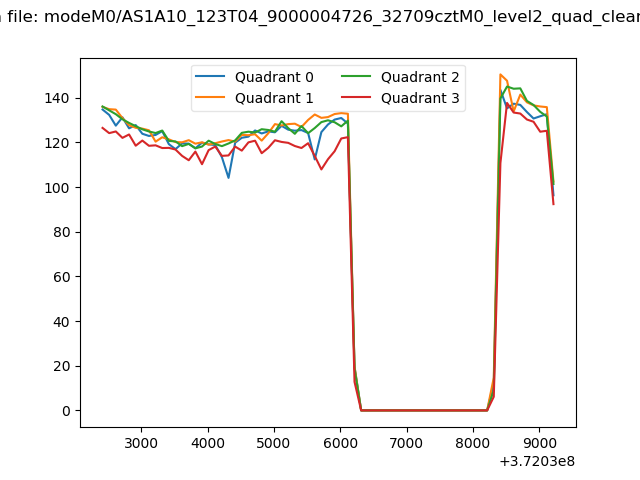 |
|
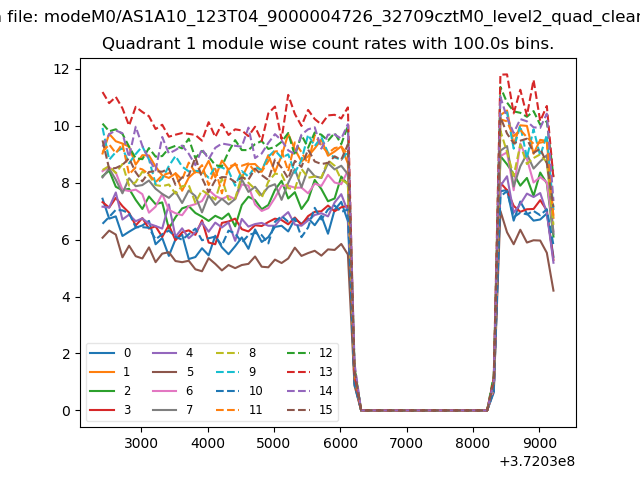
| Module-wise count rates for Quadrant A Data is divided into 100 sec bins |
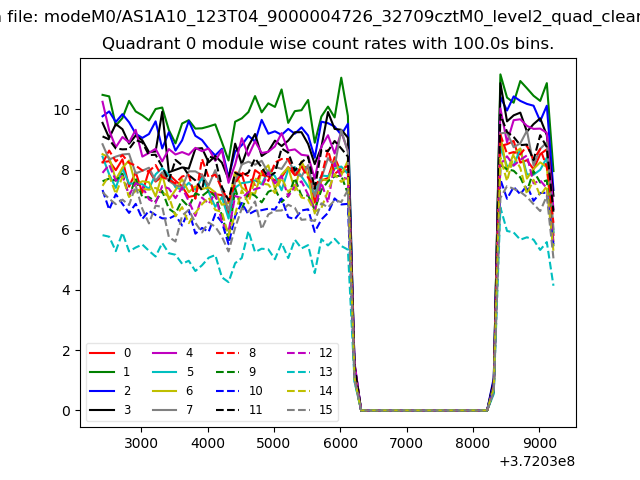 |
 |
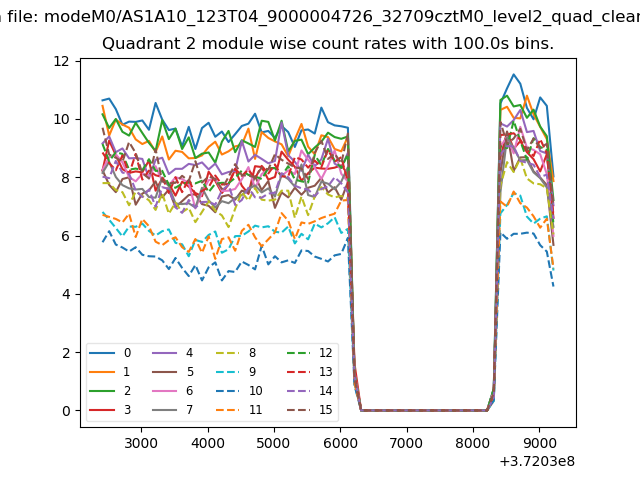
| Module-wise count rates for Quadrant B Data is divided into 100 sec bins |
 |
 |
| Module-wise count rates for Quadrant C Data is divided into 100 sec bins |
 |
 |
| Module-wise count rates for Quadrant D Data is divided into 100 sec bins |
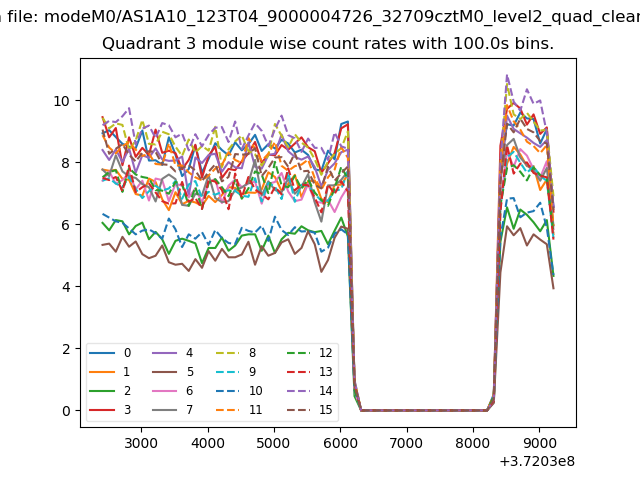 |
 |
| Parameter | Plot |
|---|---|
| CZT HV Monitor | 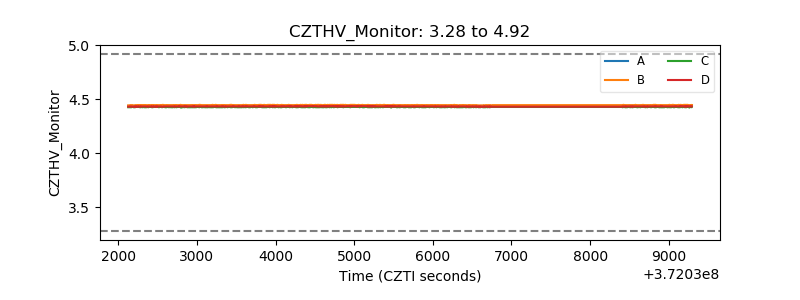 |
| D_VDD | 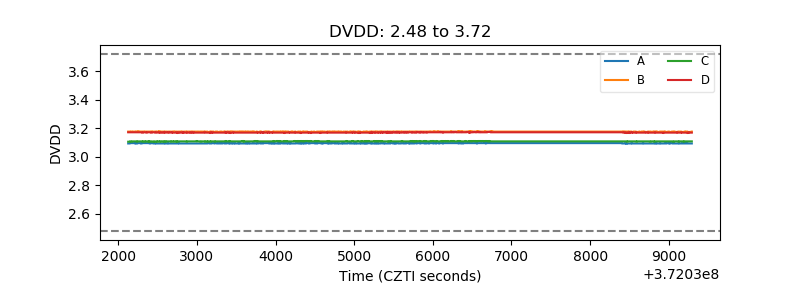 |
| Temperature 1 | 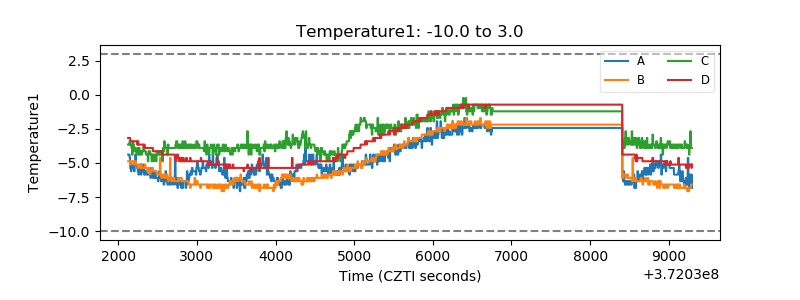 |
| Veto HV Monitor | 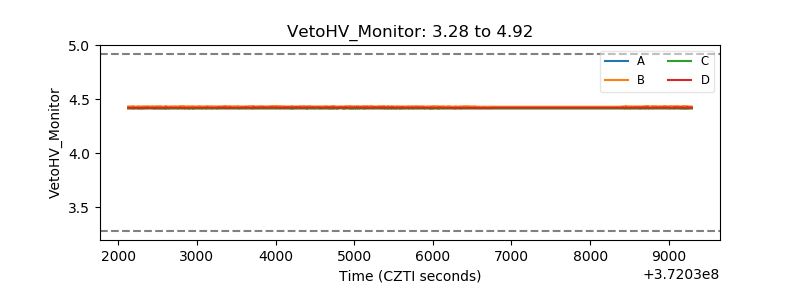 |
| Veto LLD | 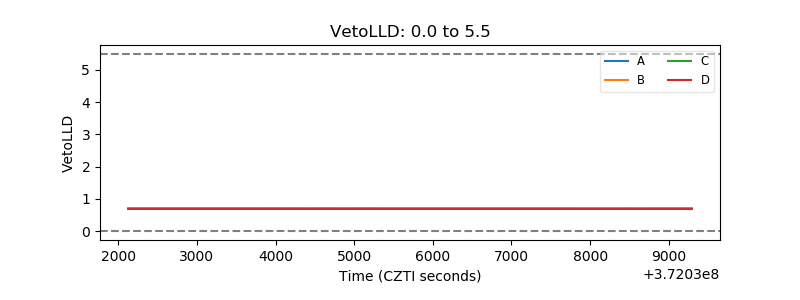 |
| Alpha Counter | 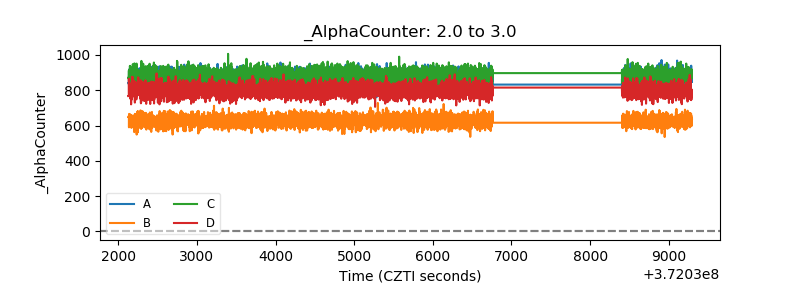 |
| _CPM_Rate | 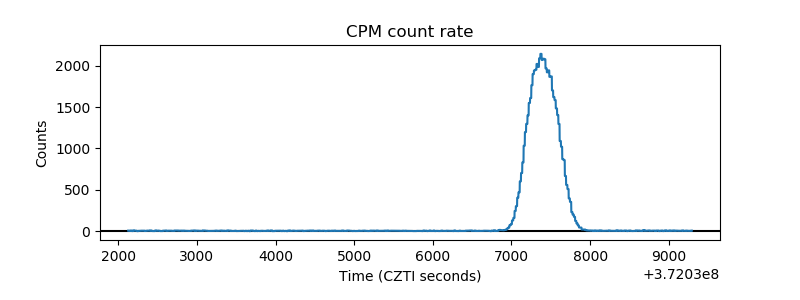 |
| CZT Counter | 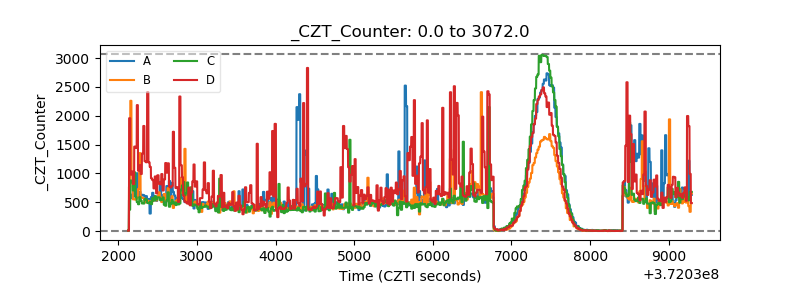 |
| +2.5 Volts monitor |  |
| +5 Volts monitor |  |
| _ROLL_ROT | 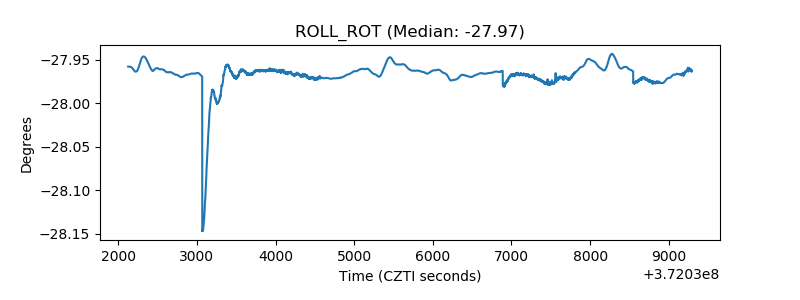 |
| _Roll_DEC | 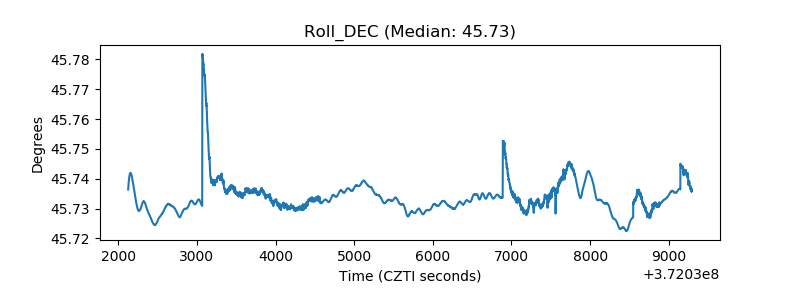 |
| _Roll_RA | 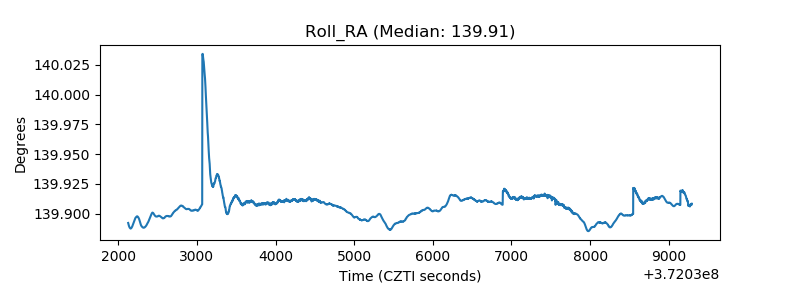 |
| Veto Counter | 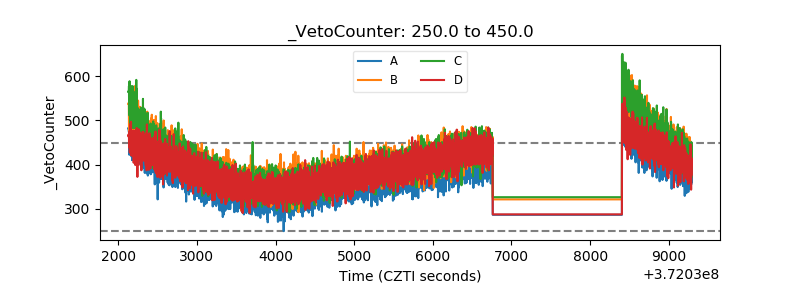 |