| Param | Original file | Final file |
|---|---|---|
| Filename | modeM0/AS1A10_123T04_9000004726_32711cztM0_level2.evt | modeM0/AS1A10_123T04_9000004726_32711cztM0_level2_quad_clean.evt |
| Size (bytes) | 541,071,360 | 88,565,760 |
| Size | 516.0 MB | 84.5 MB |
| Events in quadrant A | 4,711,449 | 573,450 |
| Events in quadrant B | 2,994,124 | 616,113 |
| Events in quadrant C | 2,817,147 | 605,777 |
| Events in quadrant D | 5,498,616 | 508,886 |
| Mode M0 | |||
|---|---|---|---|
| Quadrant | BADHDUFLAG | Total packets | Discarded packets |
| A | 0 | 17577 | 3 |
| B | 0 | 12427 | 2 |
| C | 0 | 11766 | 2 |
| D | 0 | 20144 | 2 |
| Mode M9 | |||
|---|---|---|---|
| Quadrant | BADHDUFLAG | Total packets | Discarded packets |
| A | 0 | 26 | 0 |
| B | 0 | 26 | 0 |
| C | 0 | 26 | 0 |
| D | 0 | 27 | 0 |
| Mode SS | |||
|---|---|---|---|
| Quadrant | BADHDUFLAG | Total packets | Discarded packets |
| A | 0 | 110 | 0 |
| B | 0 | 110 | 0 |
| C | 0 | 110 | 0 |
| D | 0 | 110 | 0 |
| Quadrant | Total seconds | Saturated seconds | Saturation percentage |
|---|---|---|---|
| A | 5391 | 468 | 8.681135% |
| B | 5391 | 61 | 1.131515% |
| C | 5391 | 33 | 0.612131% |
| D | 5391 | 843 | 15.637173% |
Noise dominated data is calculated using 1-second bins in cleaned event files. If a bin has >2000 counts, and if more than 50% of those come from <1% of pixels, then it is considered to be noise-dominated and hence unusable.
| Quadrant | # 1 sec bins | Bins with >0 counts | Bins with >2000 counts | High rate bins dominated by noise | Noise dominated (total time) | Noise dominated (detector-on time) | Marked lightcurve |
|---|---|---|---|---|---|---|---|
| A | 7183 | 5392 | 328 | 328 | 4.57% | 6.08% | 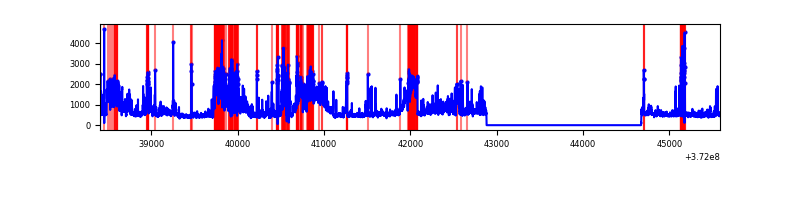 |
| B | 7183 | 5392 | 24 | 24 | 0.33% | 0.45% | 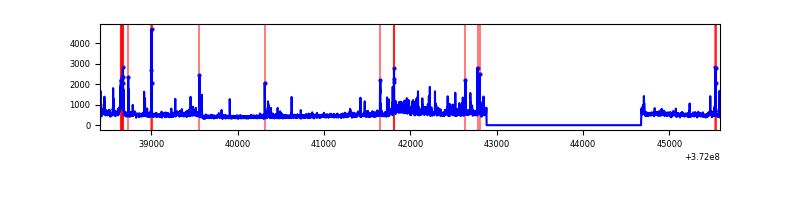 |
| C | 7183 | 5392 | 23 | 23 | 0.32% | 0.43% | 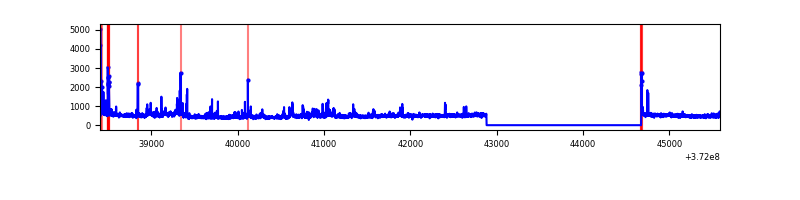 |
| D | 7183 | 5392 | 749 | 749 | 10.43% | 13.89% |  |
Top three noisy pixels from each quadrant. If the there are fewer than three noisy pixels in the level2.evt file, extra rows are filled as -1
| Pixel properties | Quadrant properties | ||||||
|---|---|---|---|---|---|---|---|
| Quadrant | DetID | PixID | Counts | Sigma | Mean | Median | Sigma |
| A | 15 | 249 | 1757090 | 14357.6 | 614 | 604 | 122.3 |
| A | 15 | 237 | 514956 | 4204.34 | 614 | 604 | 122.3 |
| A | 14 | 238 | 21263 | 168.87 | 614 | 604 | 122.3 |
| B | 4 | 251 | 131747 | 1085.22 | 642 | 629 | 120.8 |
| B | 0 | 219 | 115058 | 947.09 | 642 | 629 | 120.8 |
| B | 0 | 183 | 76361 | 626.81 | 642 | 629 | 120.8 |
| C | 0 | 10 | 167242 | 1160.42 | 617 | 622 | 143.6 |
| C | 3 | 233 | 163787 | 1136.36 | 617 | 622 | 143.6 |
| C | 6 | 96 | 60752 | 418.77 | 617 | 622 | 143.6 |
| D | 7 | 80 | 1875832 | 14000.53 | 556 | 542 | 133.9 |
| D | 2 | 250 | 421435 | 3142.3 | 556 | 542 | 133.9 |
| D | 8 | 195 | 365905 | 2727.72 | 556 | 542 | 133.9 |
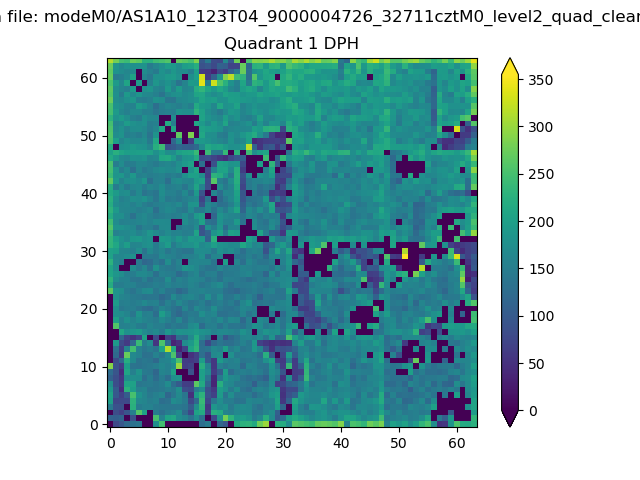
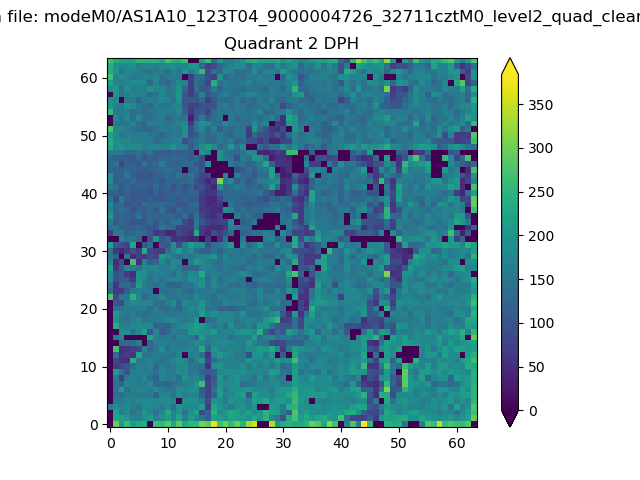
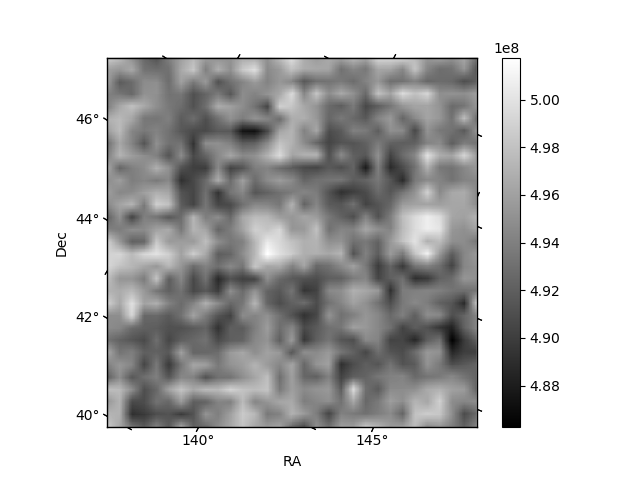
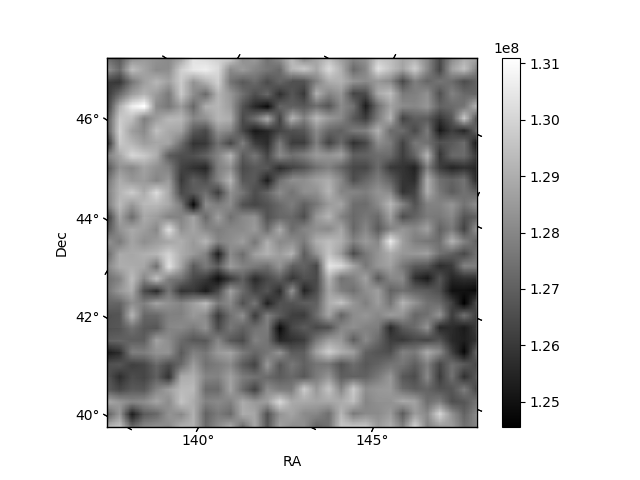
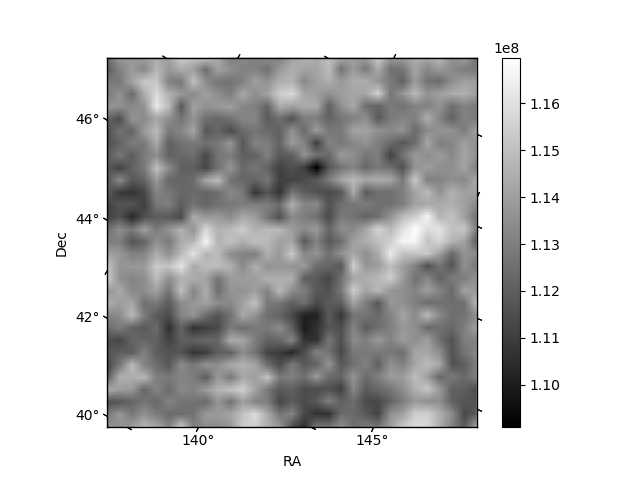
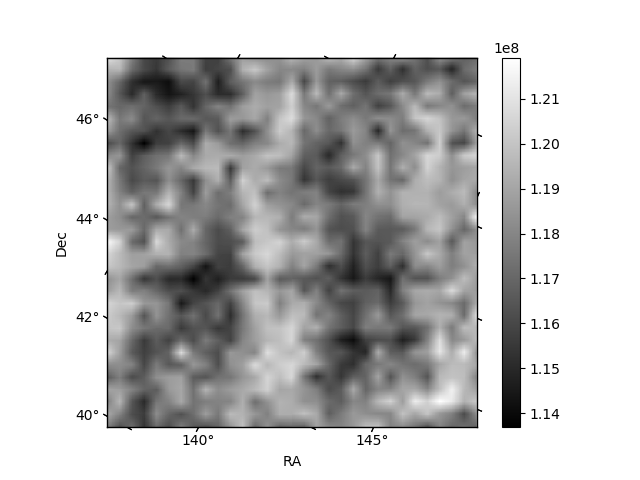
Histogram calculated using DETX and DETY for each event in the final _common_clean file
| Quadrant A | 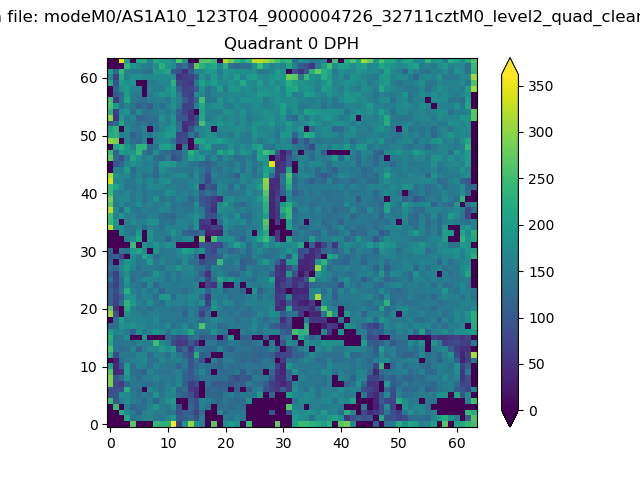 |
 |
Quadrant B |
|---|---|---|---|
| Quadrant D | 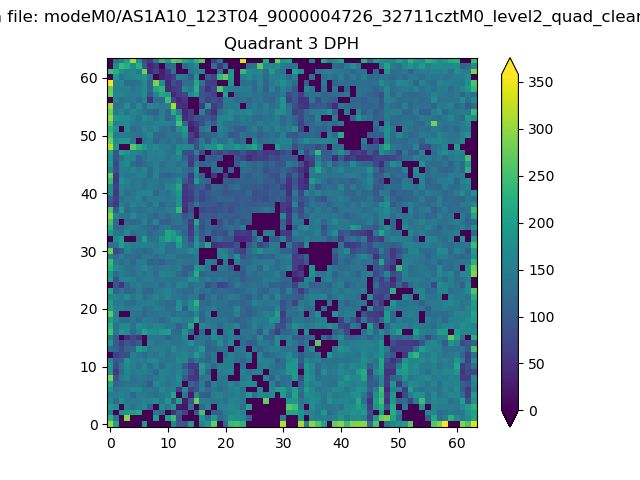 |
 |
Quadrant C |
| Plot type | Count rate plots | Images |
|---|---|---|
| Comparison with Poisson distribution Blue bars denote a histogram of data divided into 1 sec bins. Red curve is a Poisson curve with rate = median count rate of data. |
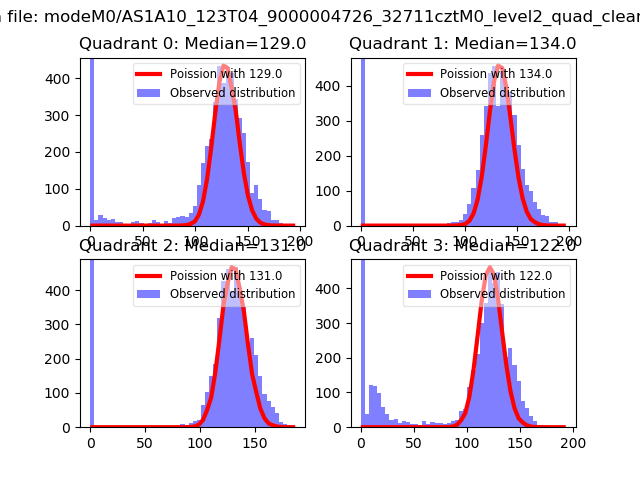 |
 |
| Quadrant-wise count rates Data is divided into 100 sec bins |
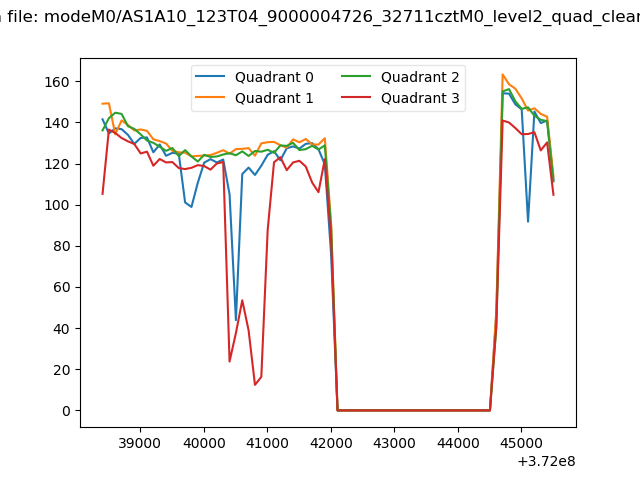 |
|
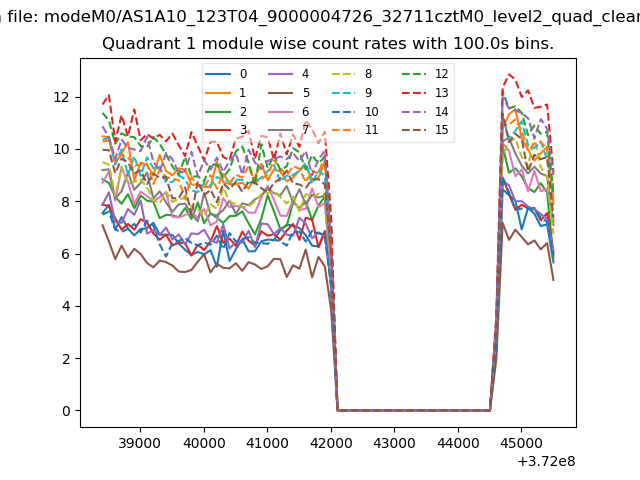
| Module-wise count rates for Quadrant A Data is divided into 100 sec bins |
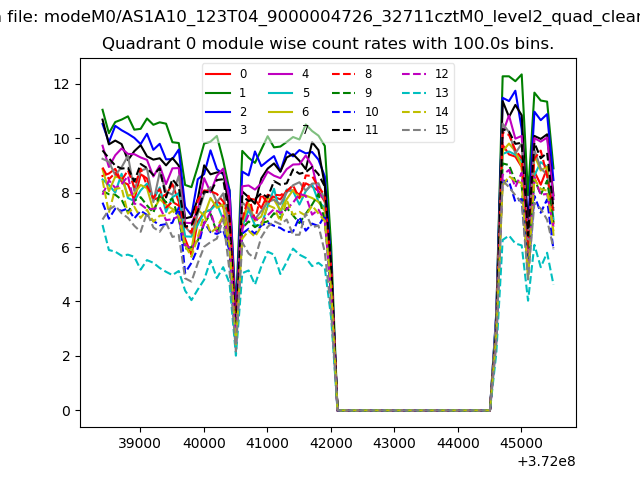 |
 |
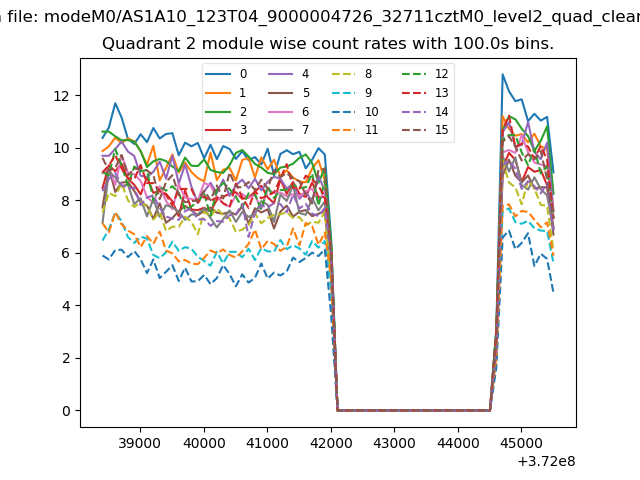
| Module-wise count rates for Quadrant B Data is divided into 100 sec bins |
 |
 |
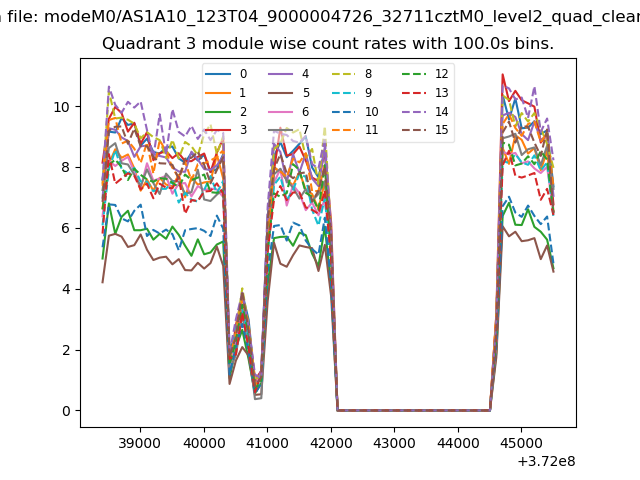
| Module-wise count rates for Quadrant C Data is divided into 100 sec bins |
 |
 |
| Module-wise count rates for Quadrant D Data is divided into 100 sec bins |
 |
 |
| Parameter | Plot |
|---|---|
| CZT HV Monitor | 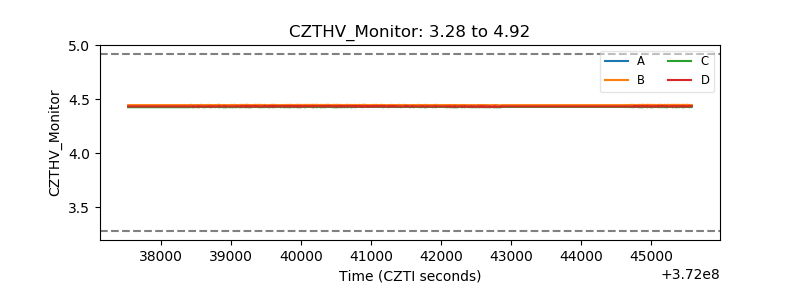 |
| D_VDD |  |
| Temperature 1 | 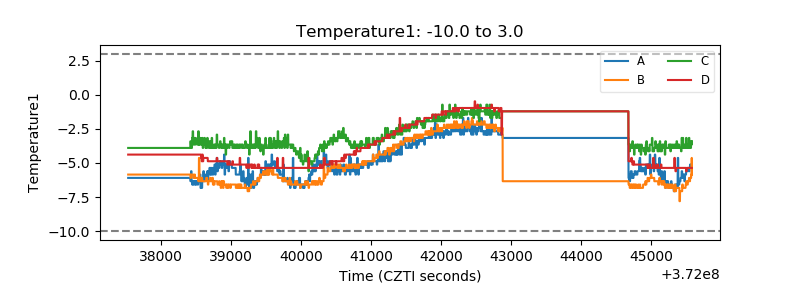 |
| Veto HV Monitor |  |
| Veto LLD | 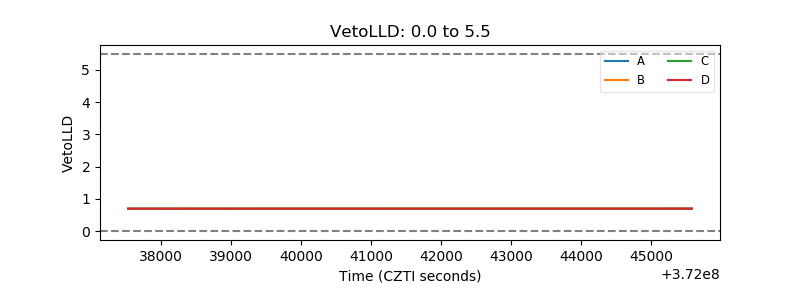 |
| Alpha Counter | 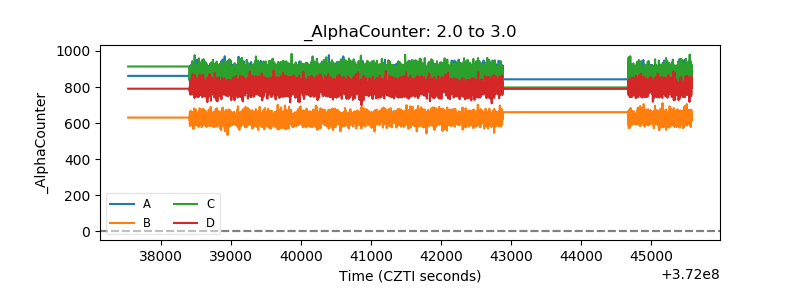 |
| _CPM_Rate | 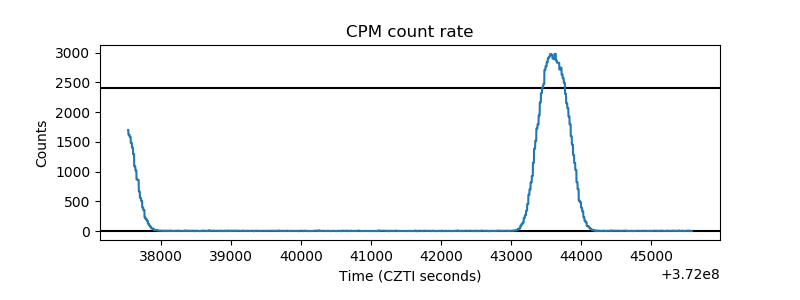 |
| CZT Counter | 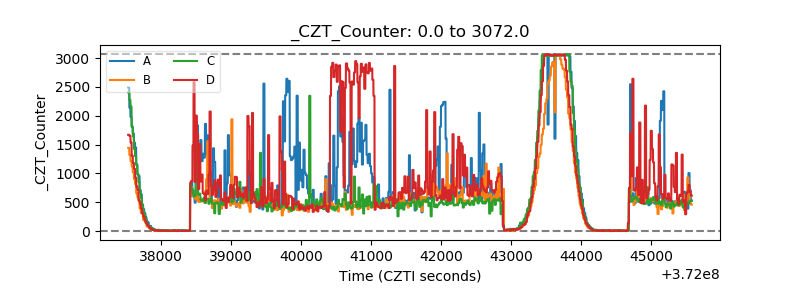 |
| +2.5 Volts monitor |  |
| +5 Volts monitor |  |
| _ROLL_ROT | 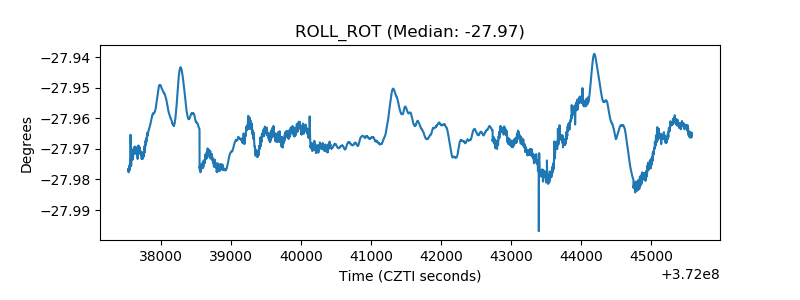 |
| _Roll_DEC | 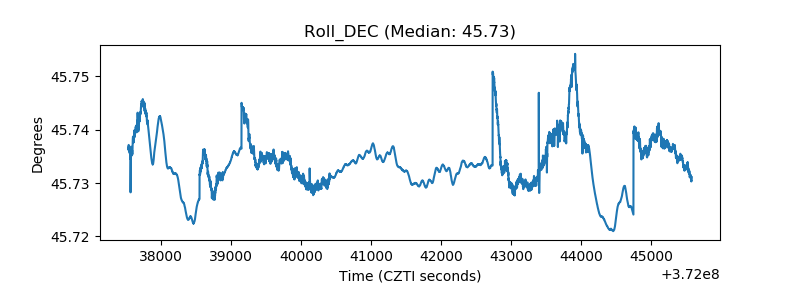 |
| _Roll_RA | 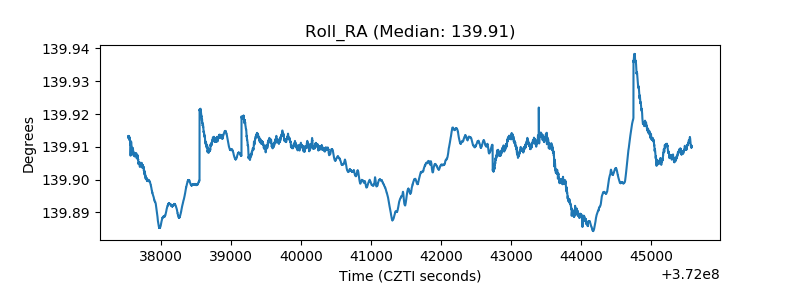 |
| Veto Counter | 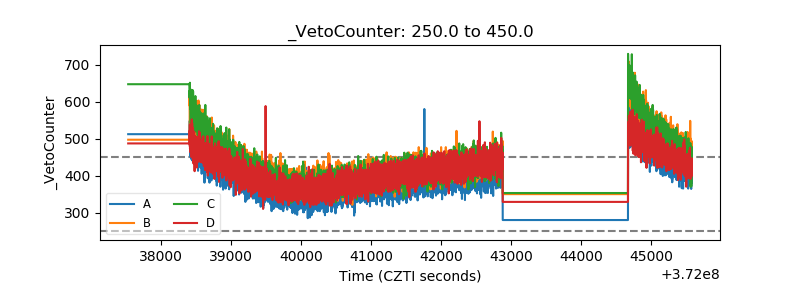 |