| Param | Original file | Final file |
|---|---|---|
| Filename | modeM0/AS1A10_123T04_9000004726_32712cztM0_level2.evt | modeM0/AS1A10_123T04_9000004726_32712cztM0_level2_quad_clean.evt |
| Size (bytes) | 498,651,840 | 84,752,640 |
| Size | 475.6 MB | 80.8 MB |
| Events in quadrant A | 4,622,520 | 537,053 |
| Events in quadrant B | 2,817,295 | 580,985 |
| Events in quadrant C | 2,838,711 | 563,389 |
| Events in quadrant D | 4,471,599 | 521,288 |
| Mode M0 | |||
|---|---|---|---|
| Quadrant | BADHDUFLAG | Total packets | Discarded packets |
| A | 0 | 17128 | 3 |
| B | 0 | 11651 | 2 |
| C | 0 | 11671 | 2 |
| D | 0 | 16862 | 2 |
| Mode M9 | |||
|---|---|---|---|
| Quadrant | BADHDUFLAG | Total packets | Discarded packets |
| A | 0 | 26 | 0 |
| B | 0 | 26 | 0 |
| C | 0 | 26 | 0 |
| D | 0 | 27 | 0 |
| Mode SS | |||
|---|---|---|---|
| Quadrant | BADHDUFLAG | Total packets | Discarded packets |
| A | 0 | 106 | 0 |
| B | 0 | 106 | 0 |
| C | 0 | 106 | 0 |
| D | 0 | 106 | 0 |
| Quadrant | Total seconds | Saturated seconds | Saturation percentage |
|---|---|---|---|
| A | 5188 | 584 | 11.256746% |
| B | 5188 | 57 | 1.098689% |
| C | 5188 | 79 | 1.522745% |
| D | 5188 | 297 | 5.724749% |
Noise dominated data is calculated using 1-second bins in cleaned event files. If a bin has >2000 counts, and if more than 50% of those come from <1% of pixels, then it is considered to be noise-dominated and hence unusable.
| Quadrant | # 1 sec bins | Bins with >0 counts | Bins with >2000 counts | High rate bins dominated by noise | Noise dominated (total time) | Noise dominated (detector-on time) | Marked lightcurve |
|---|---|---|---|---|---|---|---|
| A | 7101 | 5189 | 427 | 427 | 6.01% | 8.23% | 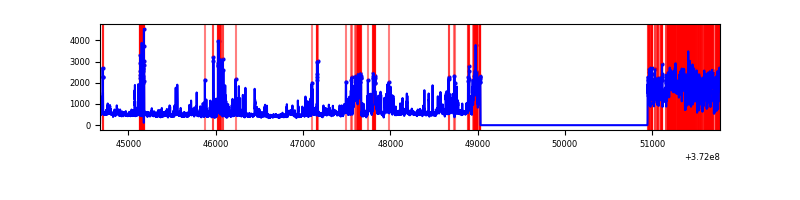 |
| B | 7101 | 5189 | 27 | 27 | 0.38% | 0.52% | 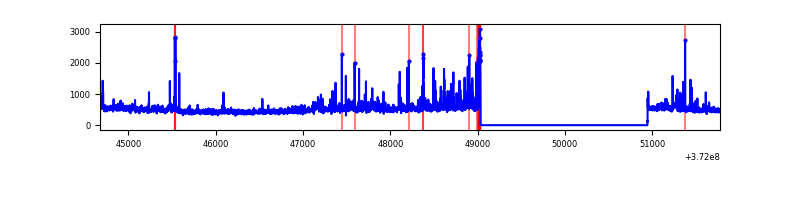 |
| C | 7101 | 5189 | 64 | 64 | 0.90% | 1.23% | 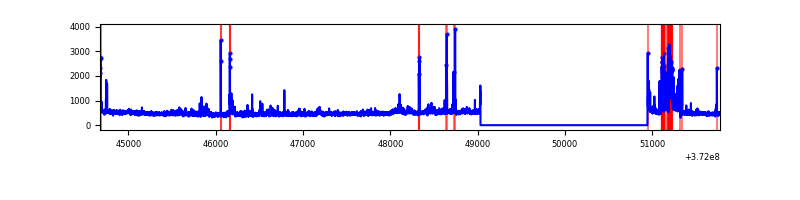 |
| D | 7101 | 5189 | 245 | 245 | 3.45% | 4.72% | 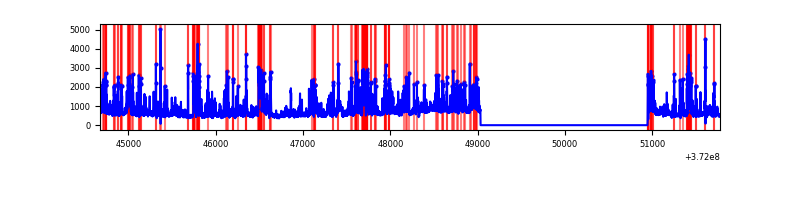 |
Top three noisy pixels from each quadrant. If the there are fewer than three noisy pixels in the level2.evt file, extra rows are filled as -1
| Pixel properties | Quadrant properties | ||||||
|---|---|---|---|---|---|---|---|
| Quadrant | DetID | PixID | Counts | Sigma | Mean | Median | Sigma |
| A | 15 | 249 | 1988971 | 16447.44 | 607 | 596 | 120.9 |
| A | 15 | 237 | 214117 | 1766.2 | 607 | 596 | 120.9 |
| A | 14 | 238 | 17383 | 138.86 | 607 | 596 | 120.9 |
| B | 4 | 251 | 156581 | 1312.85 | 634 | 622 | 118.8 |
| B | 0 | 219 | 70541 | 588.57 | 634 | 622 | 118.8 |
| B | 0 | 183 | 25950 | 213.2 | 634 | 622 | 118.8 |
| C | 9 | 236 | 215675 | 1555.84 | 604 | 612 | 138.2 |
| C | 3 | 233 | 118780 | 854.87 | 604 | 612 | 138.2 |
| C | 0 | 10 | 57738 | 413.27 | 604 | 612 | 138.2 |
| D | 7 | 80 | 569424 | 4042.49 | 588 | 574 | 140.7 |
| D | 2 | 249 | 417702 | 2964.29 | 588 | 574 | 140.7 |
| D | 8 | 195 | 406111 | 2881.92 | 588 | 574 | 140.7 |
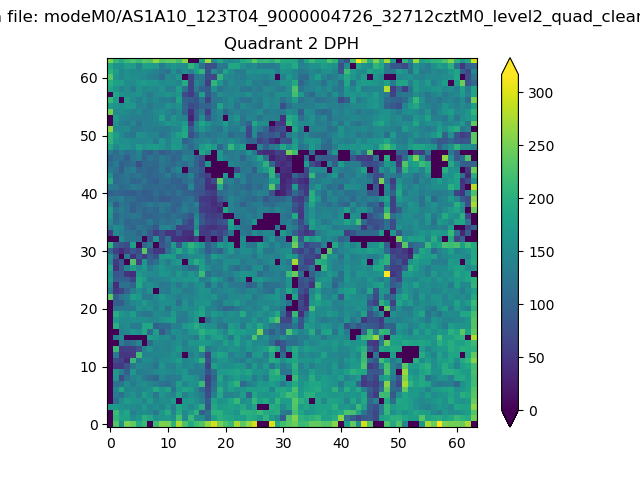
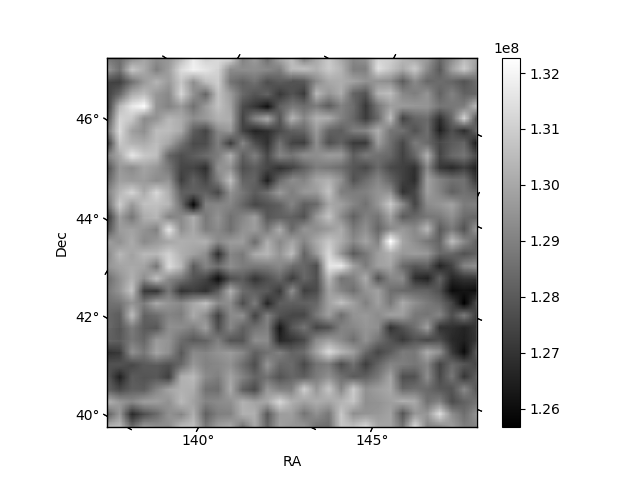
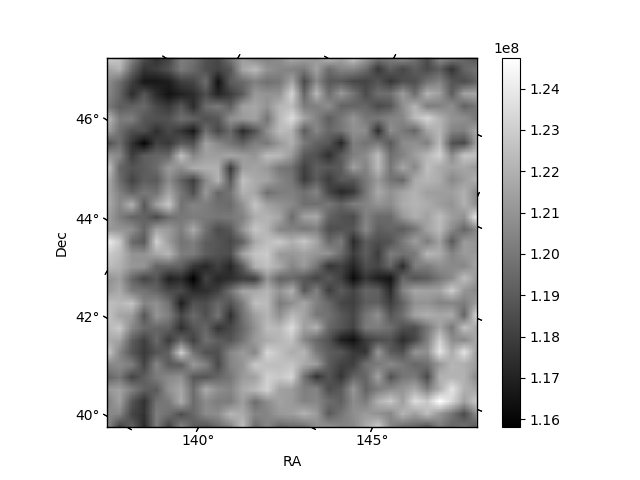
Histogram calculated using DETX and DETY for each event in the final _common_clean file
| Quadrant A | 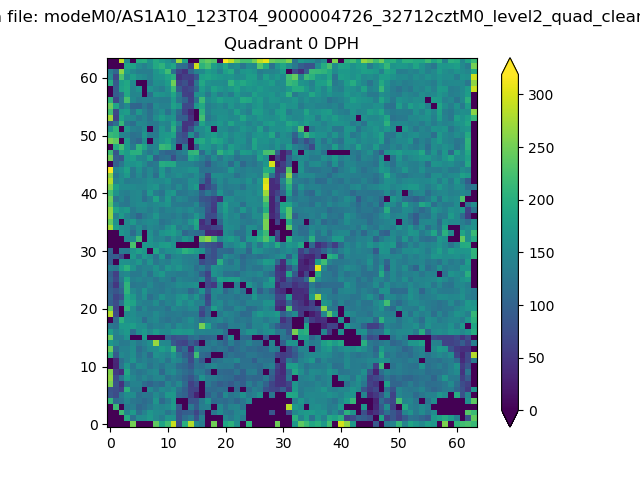 |
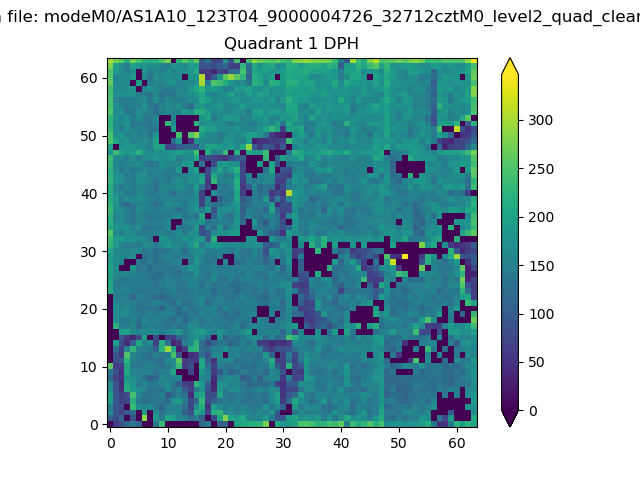 |
Quadrant B |
|---|---|---|---|
| Quadrant D | 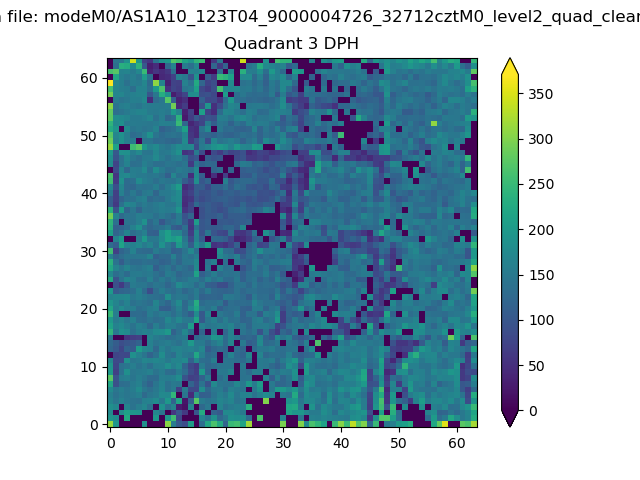 |
 |
Quadrant C |
| Plot type | Count rate plots | Images |
|---|---|---|
| Comparison with Poisson distribution Blue bars denote a histogram of data divided into 1 sec bins. Red curve is a Poisson curve with rate = median count rate of data. |
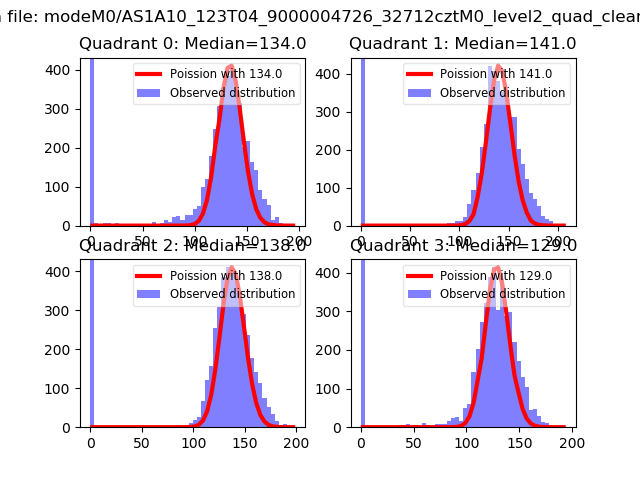 |
 |
| Quadrant-wise count rates Data is divided into 100 sec bins |
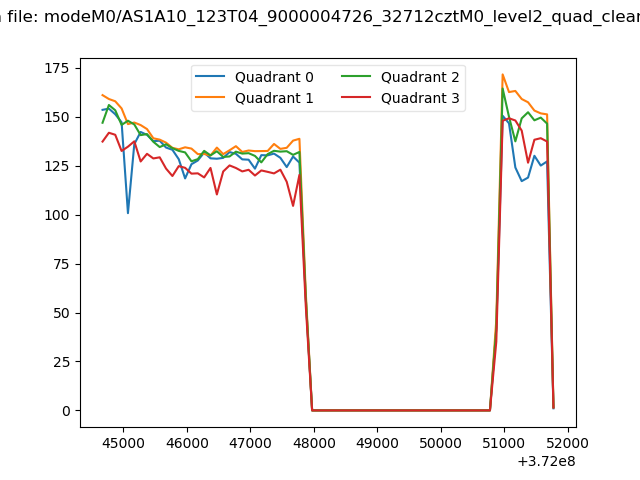 |
|
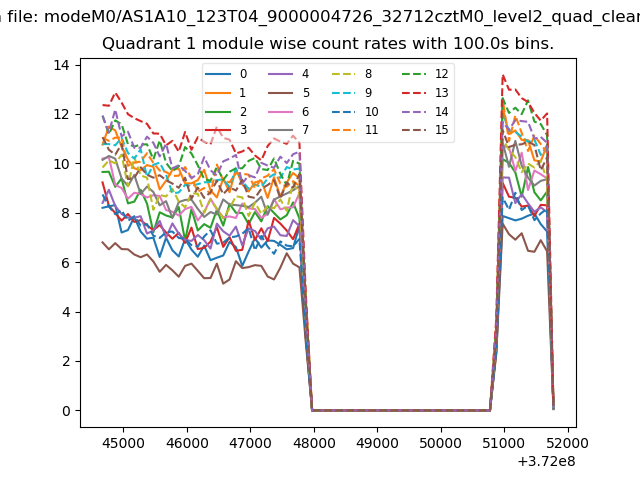
| Module-wise count rates for Quadrant A Data is divided into 100 sec bins |
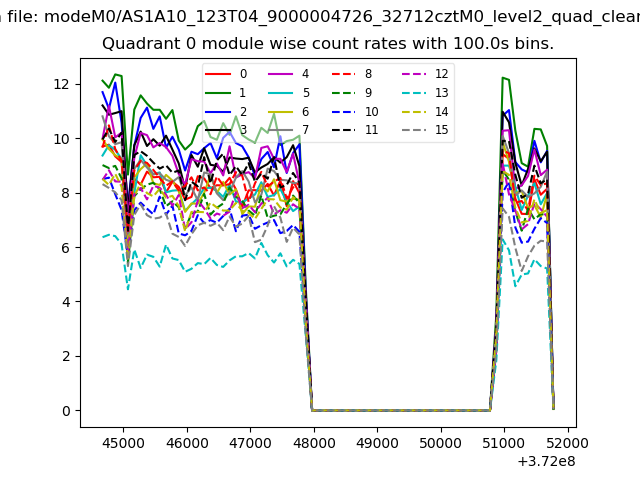 |
 |
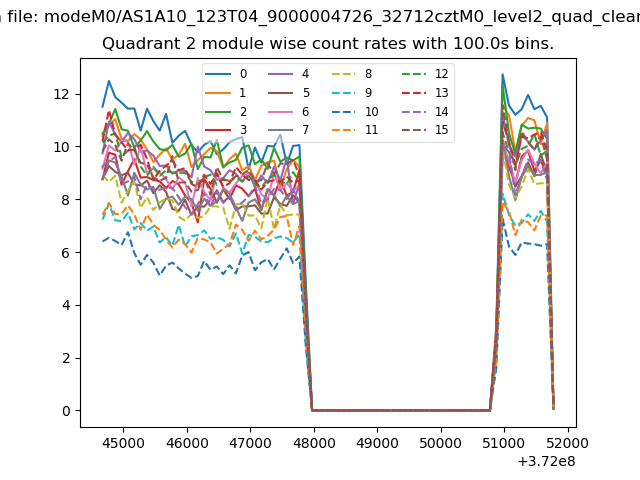
| Module-wise count rates for Quadrant B Data is divided into 100 sec bins |
 |
 |
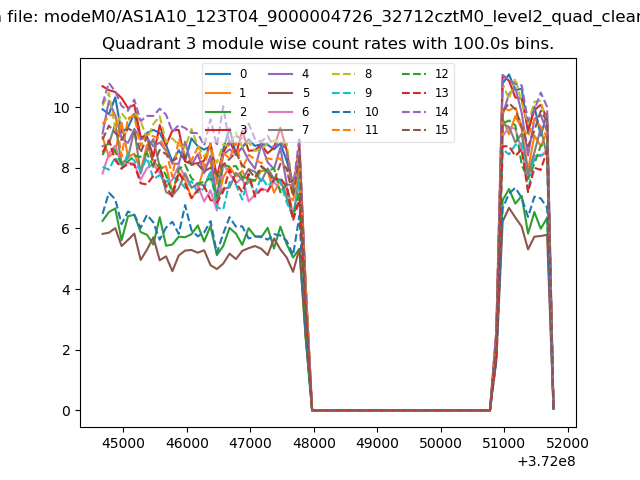
| Module-wise count rates for Quadrant C Data is divided into 100 sec bins |
 |
 |
| Module-wise count rates for Quadrant D Data is divided into 100 sec bins |
 |
 |
| Parameter | Plot |
|---|---|
| CZT HV Monitor | 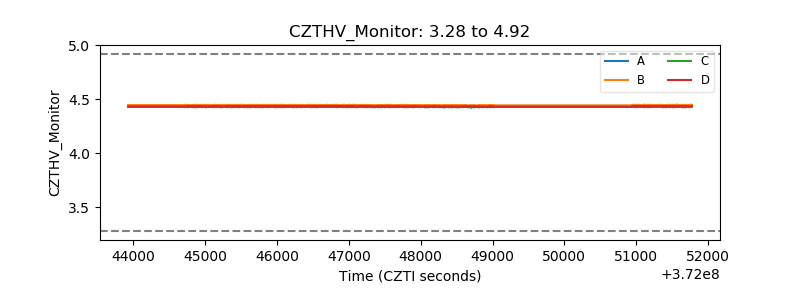 |
| D_VDD |  |
| Temperature 1 | 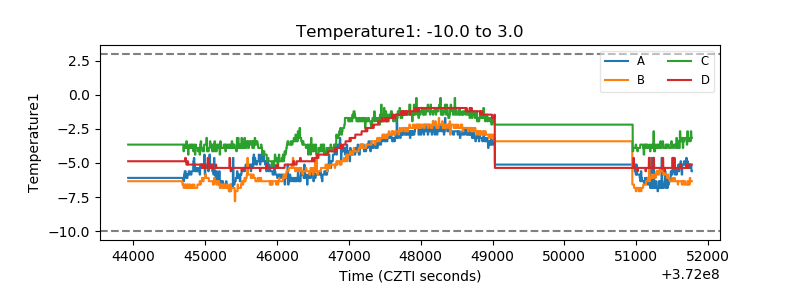 |
| Veto HV Monitor | 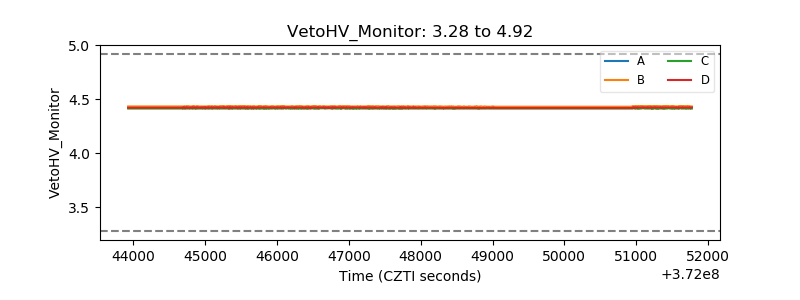 |
| Veto LLD | 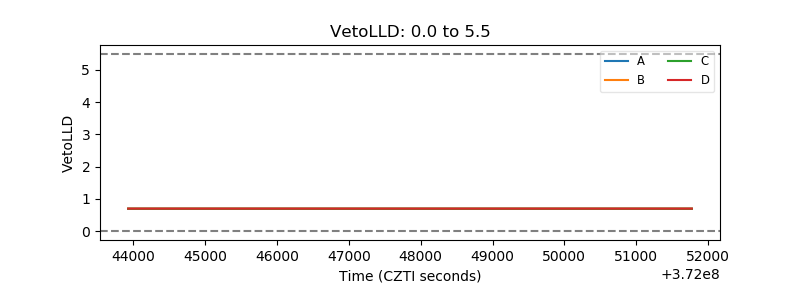 |
| Alpha Counter | 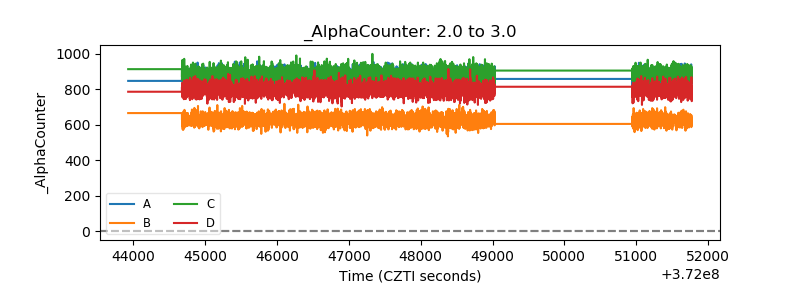 |
| _CPM_Rate | 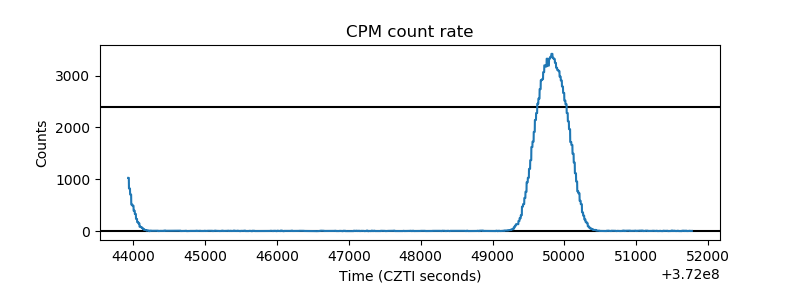 |
| CZT Counter | 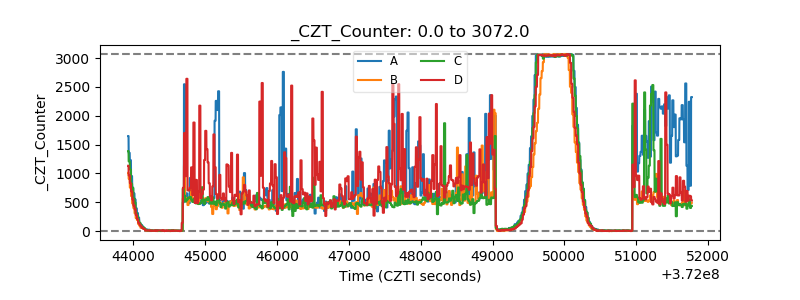 |
| +2.5 Volts monitor |  |
| +5 Volts monitor | 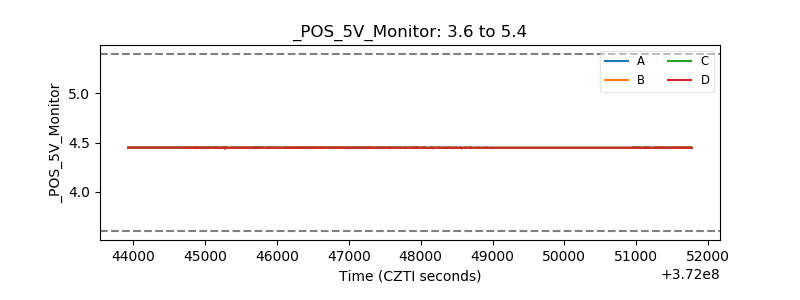 |
| _ROLL_ROT | 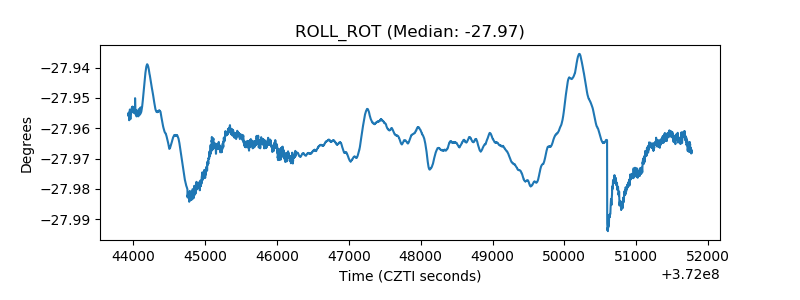 |
| _Roll_DEC | 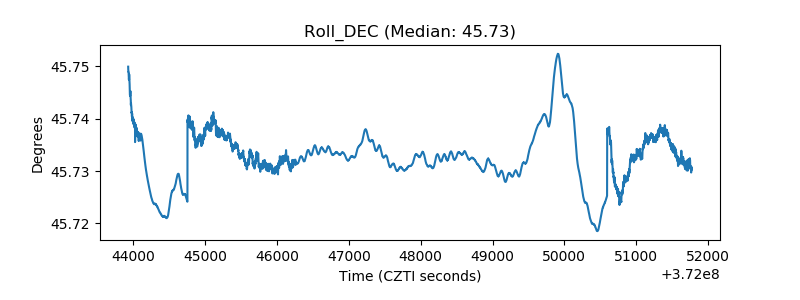 |
| _Roll_RA |  |
| Veto Counter | 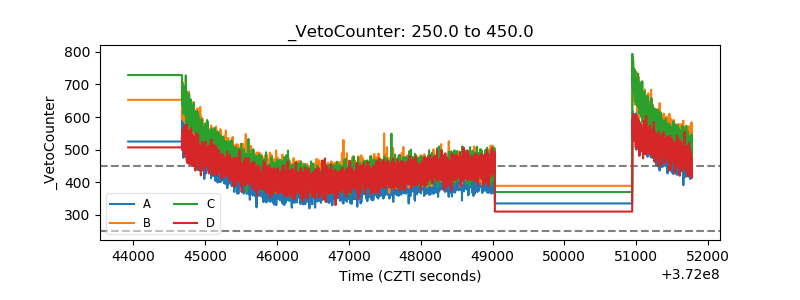 |