| Param | Original file | Final file |
|---|---|---|
| Filename | modeM0/AS1A10_123T04_9000004726_32714cztM0_level2.evt | modeM0/AS1A10_123T04_9000004726_32714cztM0_level2_quad_clean.evt |
| Size (bytes) | 535,337,280 | 73,612,800 |
| Size | 510.5 MB | 70.2 MB |
| Events in quadrant A | 5,896,874 | 453,084 |
| Events in quadrant B | 3,131,615 | 496,812 |
| Events in quadrant C | 2,634,960 | 479,776 |
| Events in quadrant D | 4,203,724 | 441,245 |
| Mode M0 | |||
|---|---|---|---|
| Quadrant | BADHDUFLAG | Total packets | Discarded packets |
| A | 0 | 21034 | 3 |
| B | 0 | 12442 | 2 |
| C | 0 | 10965 | 2 |
| D | 0 | 15927 | 2 |
| Mode M9 | |||
|---|---|---|---|
| Quadrant | BADHDUFLAG | Total packets | Discarded packets |
| A | 0 | 22 | 0 |
| B | 0 | 22 | 0 |
| C | 0 | 22 | 0 |
| D | 0 | 23 | 0 |
| Mode SS | |||
|---|---|---|---|
| Quadrant | BADHDUFLAG | Total packets | Discarded packets |
| A | 0 | 104 | 0 |
| B | 0 | 104 | 0 |
| C | 0 | 104 | 0 |
| D | 0 | 104 | 0 |
| Quadrant | Total seconds | Saturated seconds | Saturation percentage |
|---|---|---|---|
| A | 5108 | 805 | 15.759593% |
| B | 5108 | 128 | 2.505873% |
| C | 5108 | 28 | 0.548160% |
| D | 5108 | 286 | 5.599060% |
Noise dominated data is calculated using 1-second bins in cleaned event files. If a bin has >2000 counts, and if more than 50% of those come from <1% of pixels, then it is considered to be noise-dominated and hence unusable.
| Quadrant | # 1 sec bins | Bins with >0 counts | Bins with >2000 counts | High rate bins dominated by noise | Noise dominated (total time) | Noise dominated (detector-on time) | Marked lightcurve |
|---|---|---|---|---|---|---|---|
| A | 7201 | 5108 | 520 | 520 | 7.22% | 10.18% | 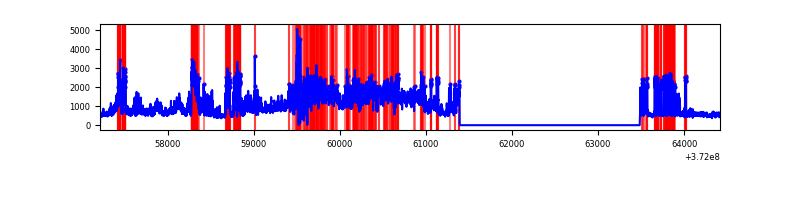 |
| B | 7201 | 5109 | 71 | 71 | 0.99% | 1.39% | 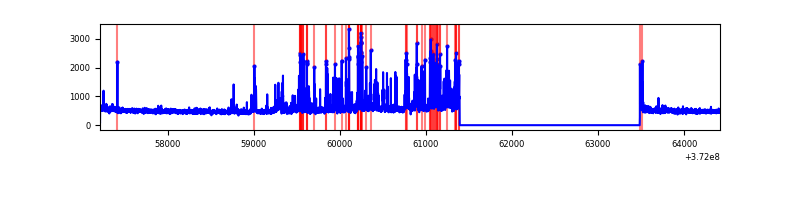 |
| C | 7201 | 5109 | 32 | 32 | 0.44% | 0.63% | 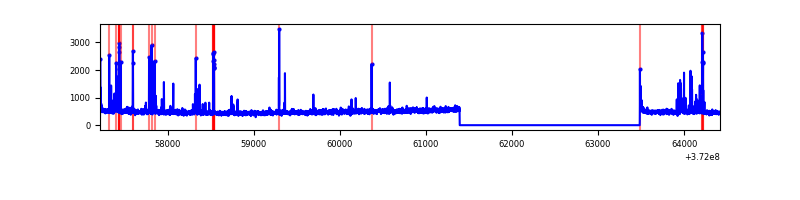 |
| D | 7201 | 5109 | 244 | 244 | 3.39% | 4.78% | 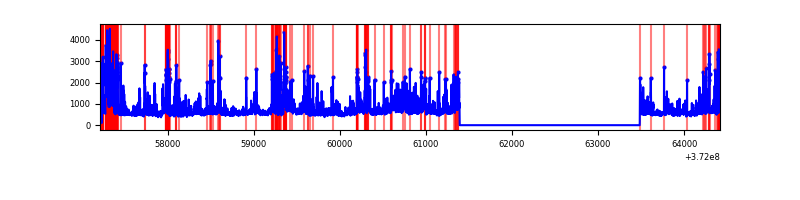 |
Top three noisy pixels from each quadrant. If the there are fewer than three noisy pixels in the level2.evt file, extra rows are filled as -1
| Pixel properties | Quadrant properties | ||||||
|---|---|---|---|---|---|---|---|
| Quadrant | DetID | PixID | Counts | Sigma | Mean | Median | Sigma |
| A | 15 | 249 | 3074752 | 25692.05 | 600 | 589 | 119.7 |
| A | 15 | 237 | 283530 | 2364.65 | 600 | 589 | 119.7 |
| A | 7 | 16 | 199334 | 1660.99 | 600 | 589 | 119.7 |
| B | 4 | 251 | 441868 | 3755.76 | 635 | 625 | 117.5 |
| B | 3 | 26 | 52972 | 445.57 | 635 | 625 | 117.5 |
| B | 4 | 206 | 35910 | 300.34 | 635 | 625 | 117.5 |
| C | 9 | 236 | 199758 | 1427.12 | 613 | 620 | 139.5 |
| C | 0 | 10 | 15224 | 104.66 | 613 | 620 | 139.5 |
| C | 7 | 247 | 7005 | 45.76 | 613 | 620 | 139.5 |
| D | 7 | 80 | 407131 | 2821.55 | 600 | 587 | 144.1 |
| D | 12 | 218 | 326520 | 2262.08 | 600 | 587 | 144.1 |
| D | 2 | 249 | 290347 | 2011.03 | 600 | 587 | 144.1 |
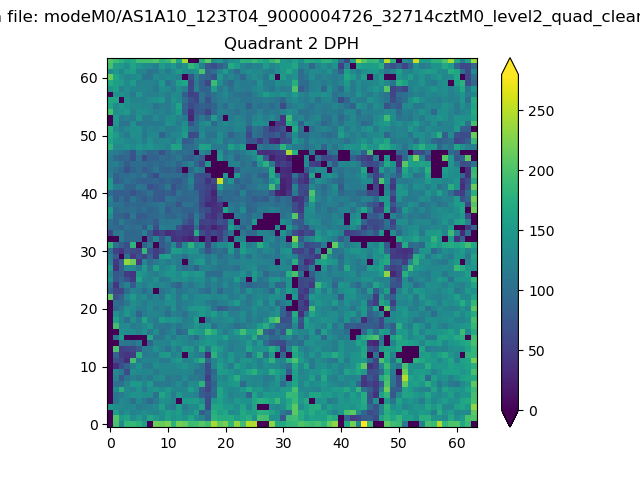
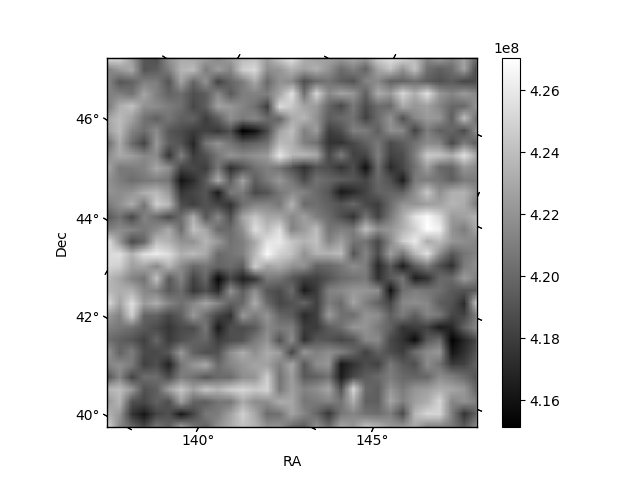
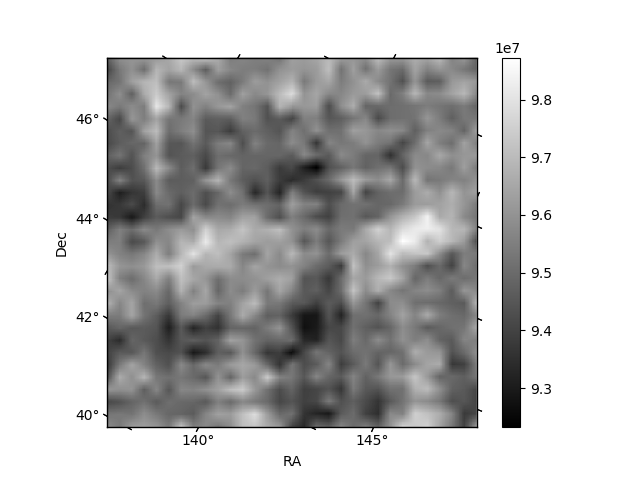
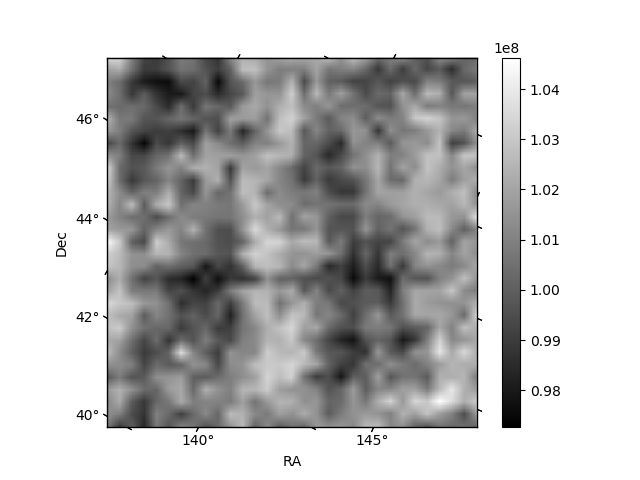
Histogram calculated using DETX and DETY for each event in the final _common_clean file
| Quadrant A | 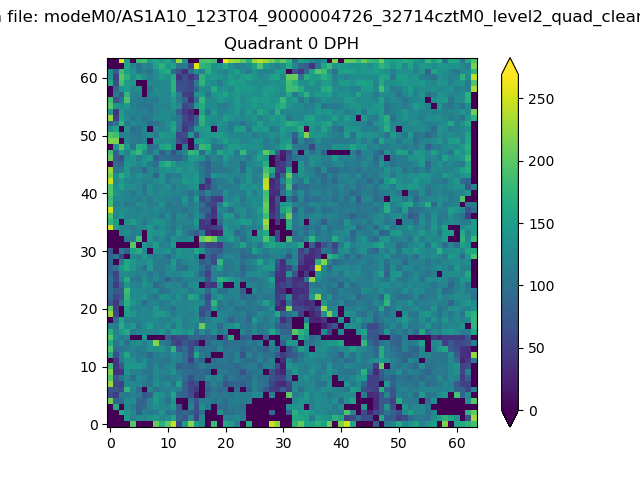 |
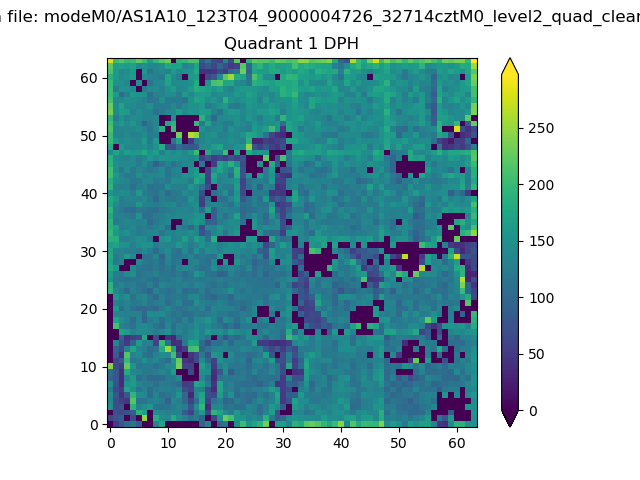 |
Quadrant B |
|---|---|---|---|
| Quadrant D | 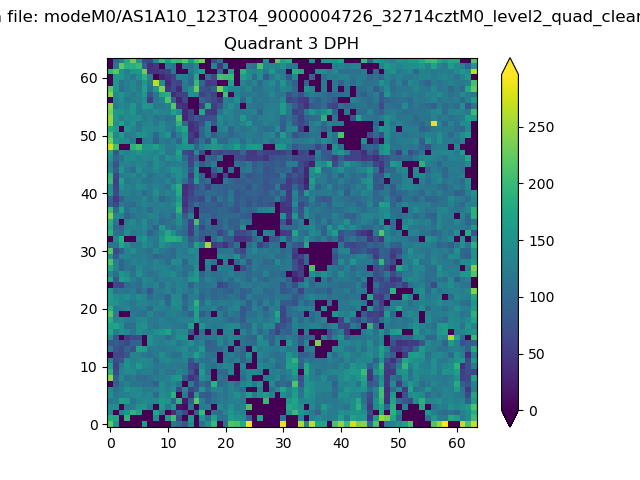 |
 |
Quadrant C |
| Plot type | Count rate plots | Images |
|---|---|---|
| Comparison with Poisson distribution Blue bars denote a histogram of data divided into 1 sec bins. Red curve is a Poisson curve with rate = median count rate of data. |
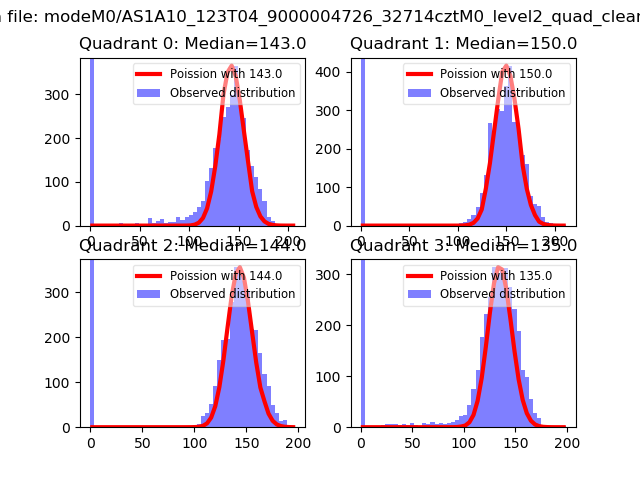 |
 |
| Quadrant-wise count rates Data is divided into 100 sec bins |
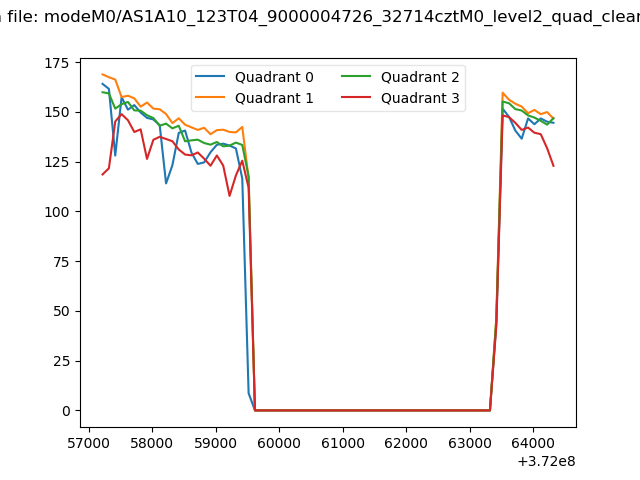 |
|
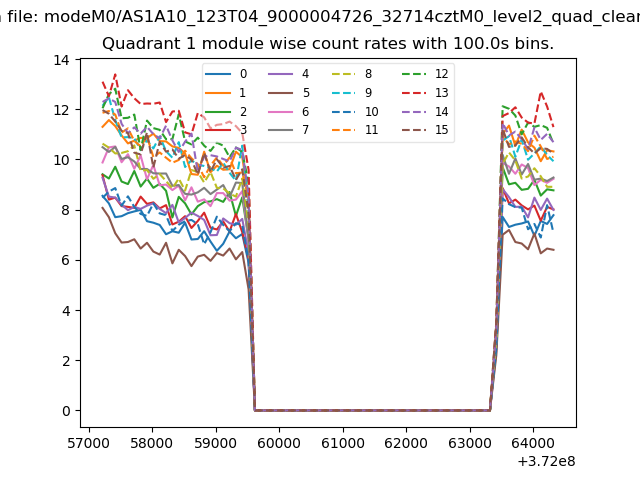
| Module-wise count rates for Quadrant A Data is divided into 100 sec bins |
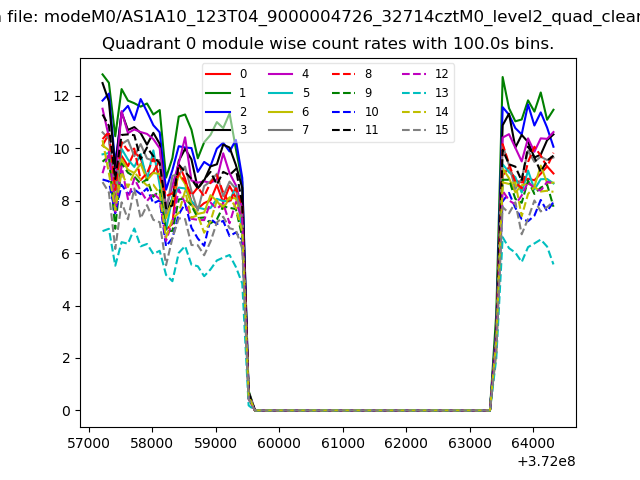 |
 |
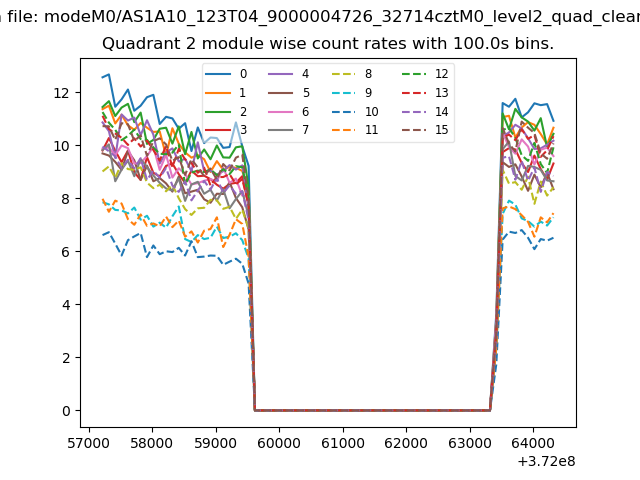
| Module-wise count rates for Quadrant B Data is divided into 100 sec bins |
 |
 |
| Module-wise count rates for Quadrant C Data is divided into 100 sec bins |
 |
 |
| Module-wise count rates for Quadrant D Data is divided into 100 sec bins |
 |
 |
| Parameter | Plot |
|---|---|
| CZT HV Monitor | 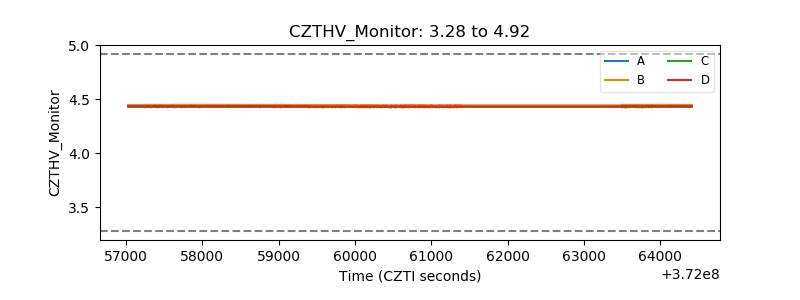 |
| D_VDD | 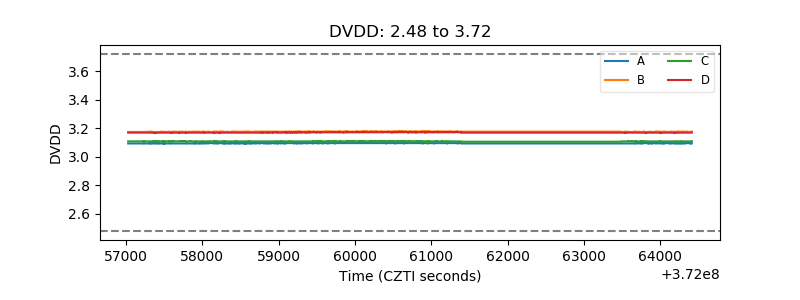 |
| Temperature 1 | 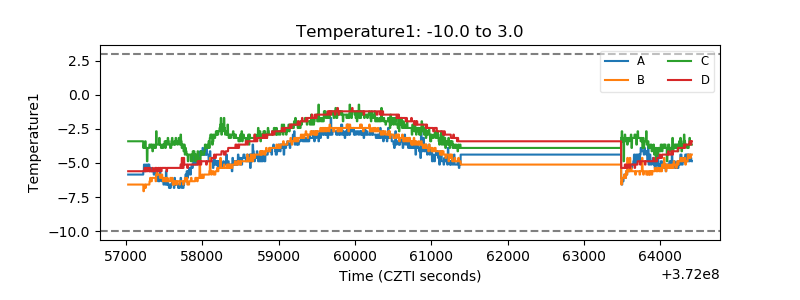 |
| Veto HV Monitor | 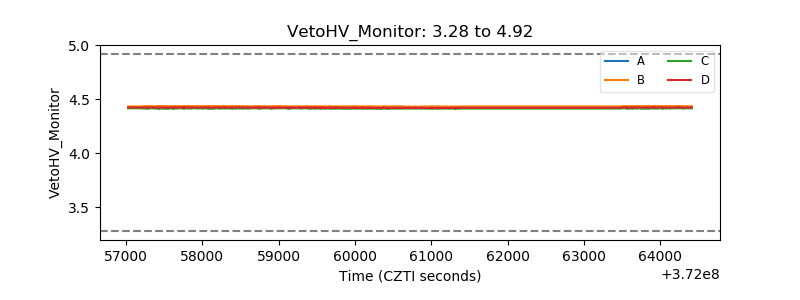 |
| Veto LLD | 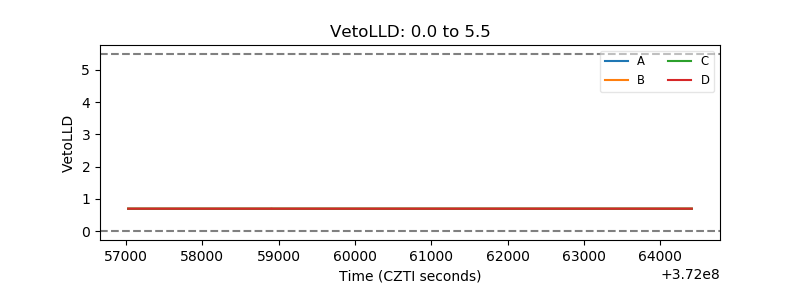 |
| Alpha Counter | 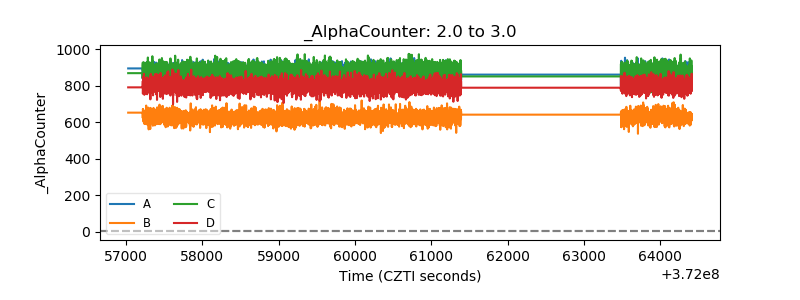 |
| _CPM_Rate | 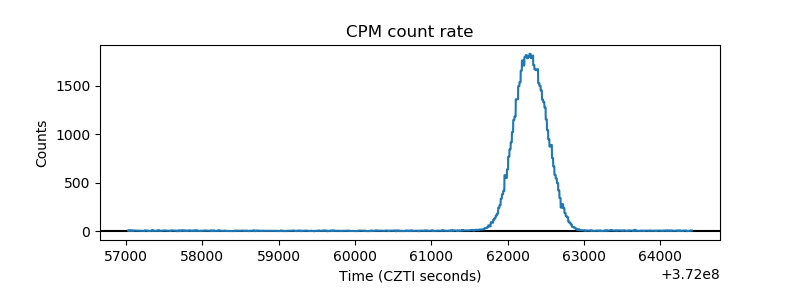 |
| CZT Counter | 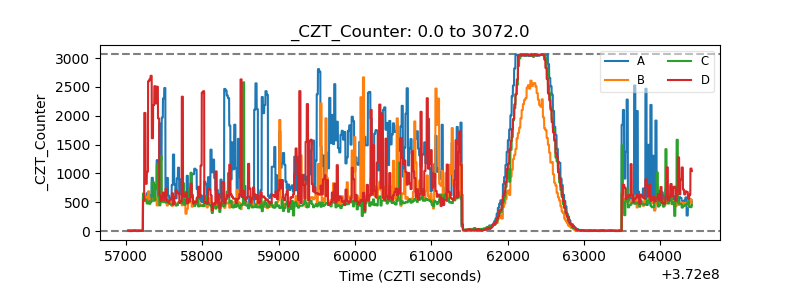 |
| +2.5 Volts monitor | 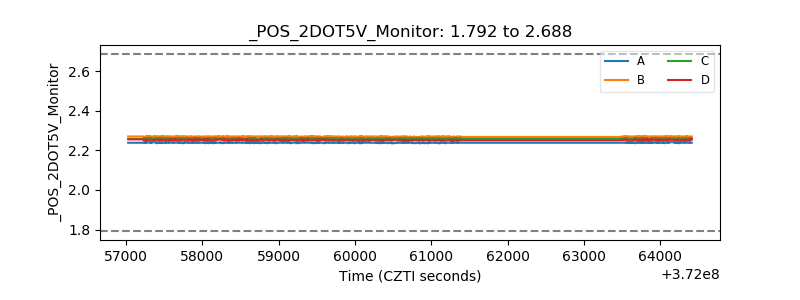 |
| +5 Volts monitor |  |
| _ROLL_ROT | 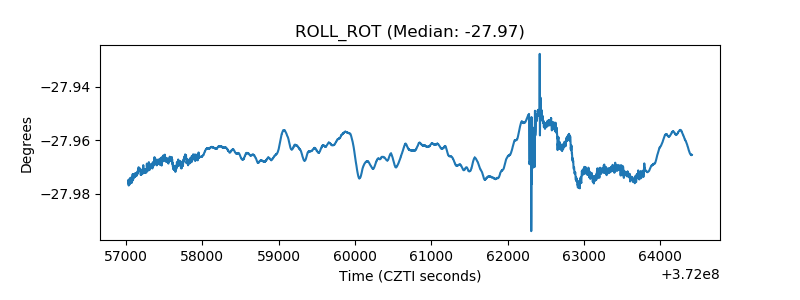 |
| _Roll_DEC | 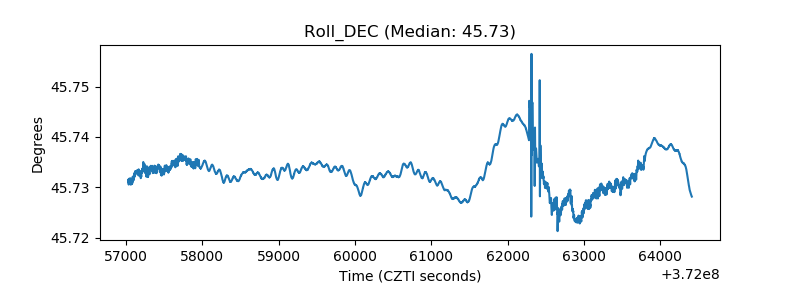 |
| _Roll_RA | 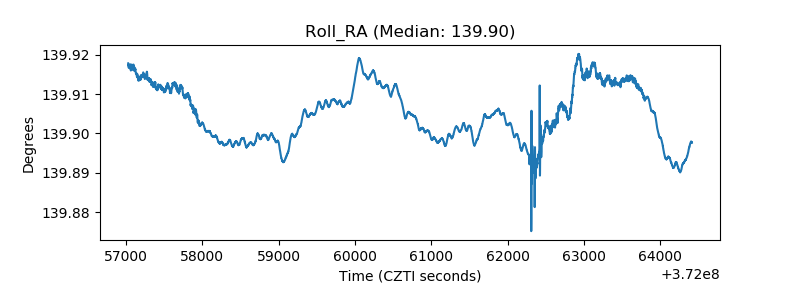 |
| Veto Counter | 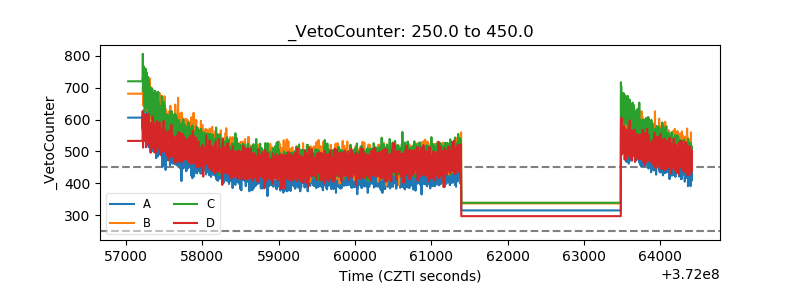 |