| Param | Original file | Final file |
|---|---|---|
| Filename | modeM0/AS1A10_123T04_9000004726_32715cztM0_level2.evt | modeM0/AS1A10_123T04_9000004726_32715cztM0_level2_quad_clean.evt |
| Size (bytes) | 479,712,960 | 64,719,360 |
| Size | 457.5 MB | 61.7 MB |
| Events in quadrant A | 4,591,154 | 398,282 |
| Events in quadrant B | 3,340,651 | 420,383 |
| Events in quadrant C | 2,421,008 | 411,490 |
| Events in quadrant D | 3,839,443 | 381,861 |
| Mode M0 | |||
|---|---|---|---|
| Quadrant | BADHDUFLAG | Total packets | Discarded packets |
| A | 0 | 16812 | 3 |
| B | 0 | 12961 | 2 |
| C | 0 | 10244 | 2 |
| D | 0 | 14730 | 2 |
| Mode M9 | |||
|---|---|---|---|
| Quadrant | BADHDUFLAG | Total packets | Discarded packets |
| A | 0 | 21 | 0 |
| B | 0 | 21 | 0 |
| C | 0 | 21 | 0 |
| D | 0 | 22 | 0 |
| Mode SS | |||
|---|---|---|---|
| Quadrant | BADHDUFLAG | Total packets | Discarded packets |
| A | 0 | 102 | 0 |
| B | 0 | 102 | 0 |
| C | 0 | 102 | 0 |
| D | 0 | 102 | 0 |
| Quadrant | Total seconds | Saturated seconds | Saturation percentage |
|---|---|---|---|
| A | 4951 | 502 | 10.139366% |
| B | 4951 | 199 | 4.019390% |
| C | 4951 | 13 | 0.262573% |
| D | 4951 | 230 | 4.645526% |
Noise dominated data is calculated using 1-second bins in cleaned event files. If a bin has >2000 counts, and if more than 50% of those come from <1% of pixels, then it is considered to be noise-dominated and hence unusable.
| Quadrant | # 1 sec bins | Bins with >0 counts | Bins with >2000 counts | High rate bins dominated by noise | Noise dominated (total time) | Noise dominated (detector-on time) | Marked lightcurve |
|---|---|---|---|---|---|---|---|
| A | 7074 | 4952 | 345 | 345 | 4.88% | 6.97% | 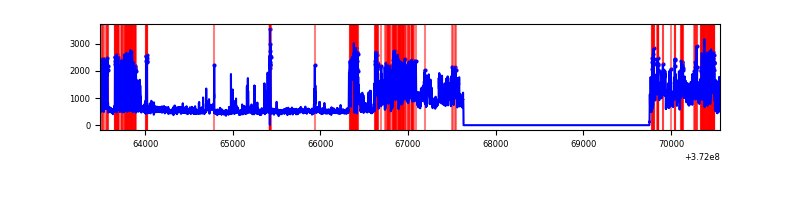 |
| B | 7074 | 4952 | 153 | 153 | 2.16% | 3.09% | 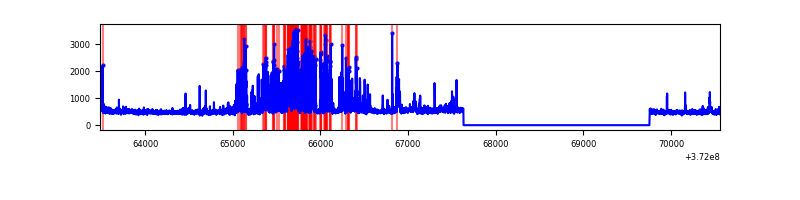 |
| C | 7074 | 4952 | 8 | 8 | 0.11% | 0.16% | 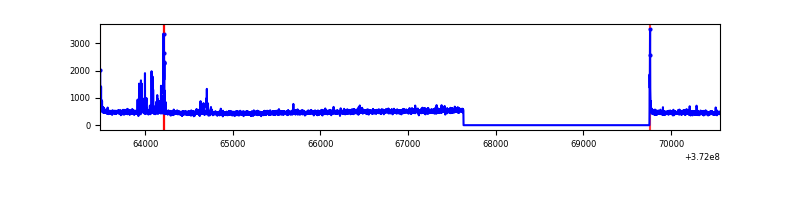 |
| D | 7074 | 4952 | 194 | 194 | 2.74% | 3.92% | 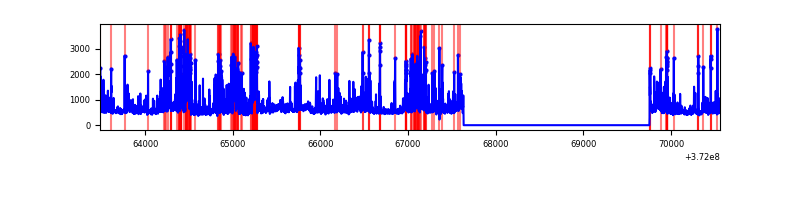 |
Top three noisy pixels from each quadrant. If the there are fewer than three noisy pixels in the level2.evt file, extra rows are filled as -1
| Pixel properties | Quadrant properties | ||||||
|---|---|---|---|---|---|---|---|
| Quadrant | DetID | PixID | Counts | Sigma | Mean | Median | Sigma |
| A | 15 | 249 | 2196179 | 18546.02 | 597 | 588 | 118.4 |
| A | 15 | 237 | 49422 | 412.5 | 597 | 588 | 118.4 |
| A | 7 | 16 | 20668 | 169.61 | 597 | 588 | 118.4 |
| B | 4 | 251 | 792024 | 7025.32 | 604 | 592 | 112.7 |
| B | 0 | 197 | 49537 | 434.47 | 604 | 592 | 112.7 |
| B | 3 | 26 | 40086 | 350.58 | 604 | 592 | 112.7 |
| C | 9 | 236 | 58201 | 428.67 | 588 | 593 | 134.4 |
| C | 0 | 10 | 26908 | 195.81 | 588 | 593 | 134.4 |
| C | 3 | 233 | 15439 | 110.47 | 588 | 593 | 134.4 |
| D | 2 | 250 | 446711 | 3205.56 | 582 | 570 | 139.2 |
| D | 2 | 249 | 304025 | 2180.35 | 582 | 570 | 139.2 |
| D | 8 | 195 | 226953 | 1626.58 | 582 | 570 | 139.2 |
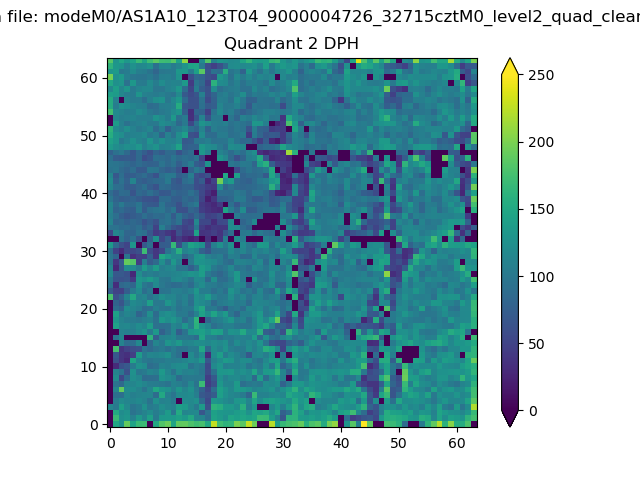
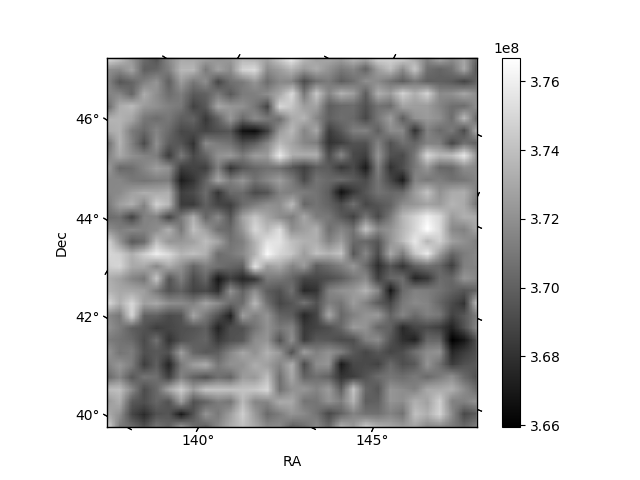
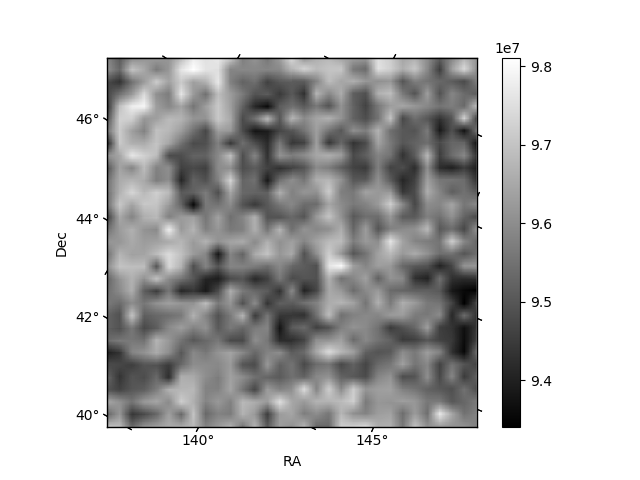
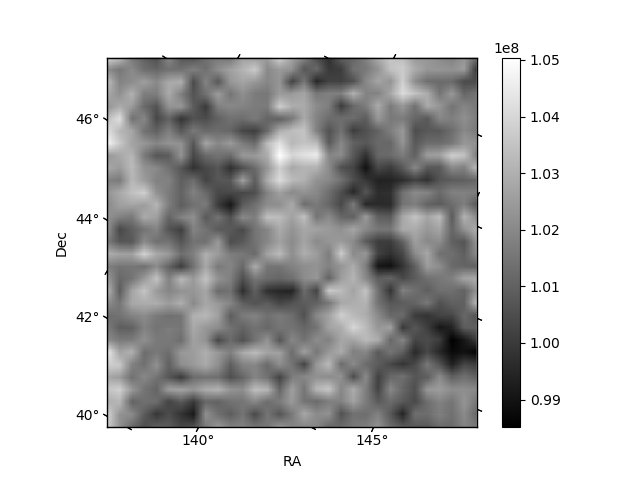
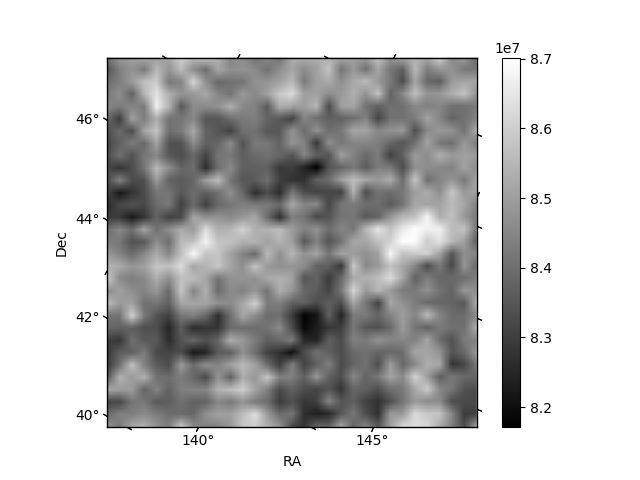
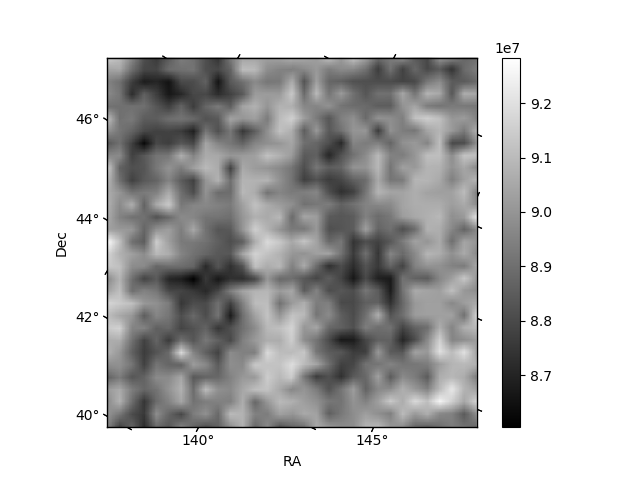
Histogram calculated using DETX and DETY for each event in the final _common_clean file
| Quadrant A | 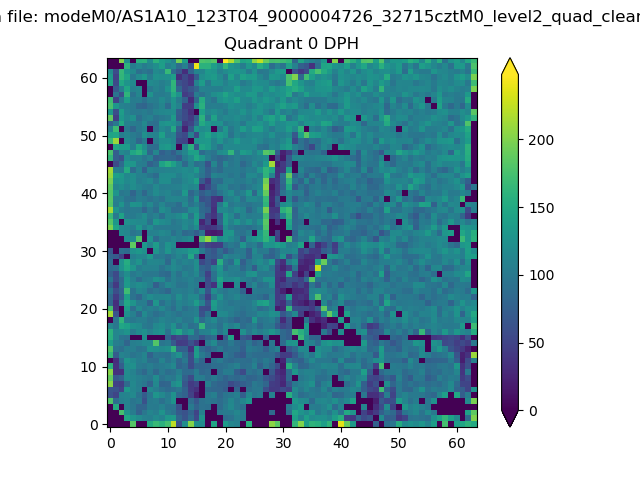 |
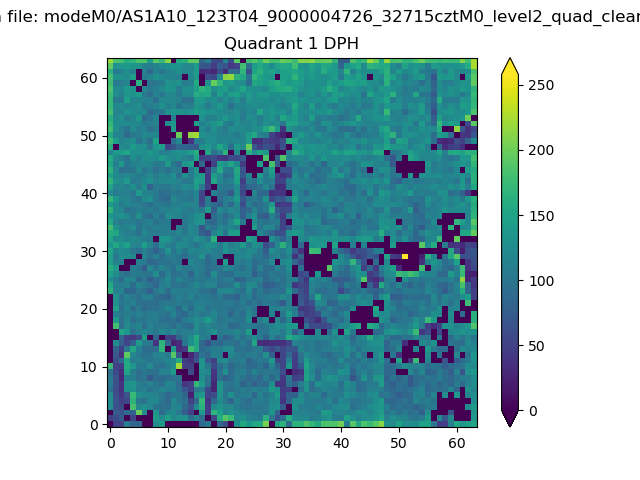 |
Quadrant B |
|---|---|---|---|
| Quadrant D | 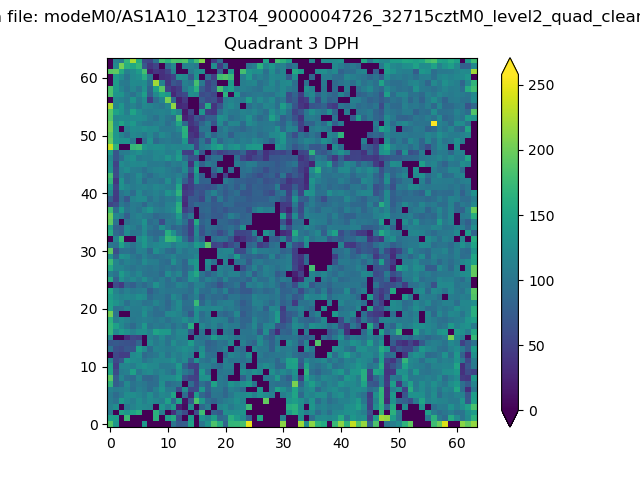 |
 |
Quadrant C |
| Plot type | Count rate plots | Images |
|---|---|---|
| Comparison with Poisson distribution Blue bars denote a histogram of data divided into 1 sec bins. Red curve is a Poisson curve with rate = median count rate of data. |
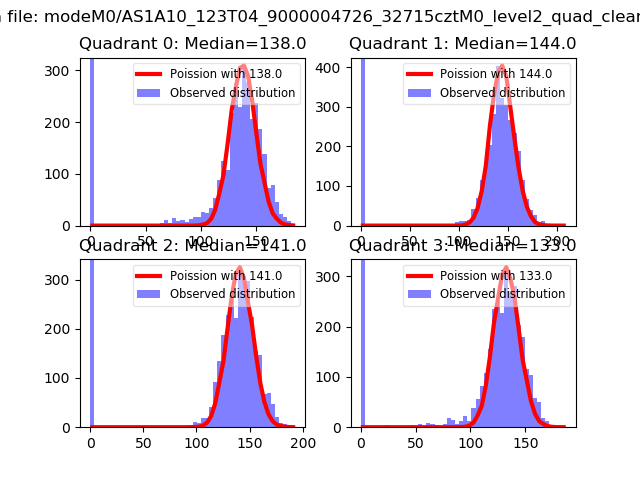 |
 |
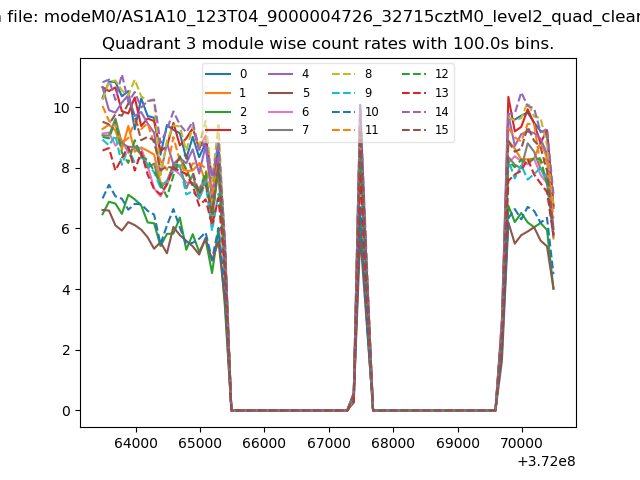
| Quadrant-wise count rates Data is divided into 100 sec bins |
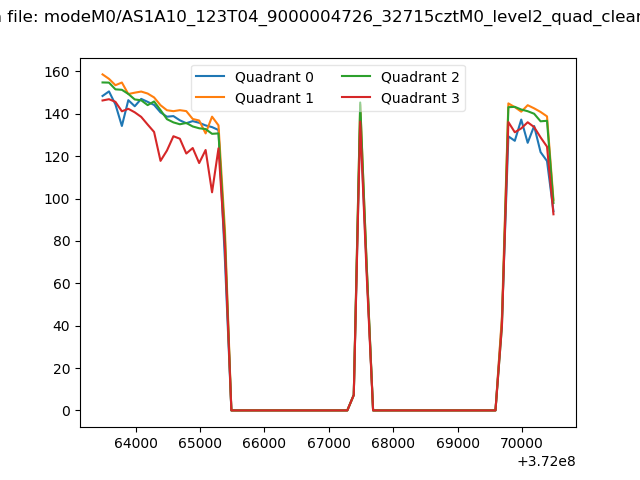 |
|
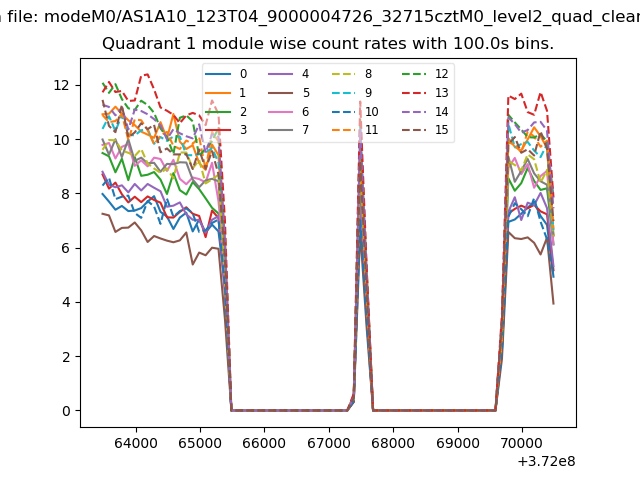
| Module-wise count rates for Quadrant A Data is divided into 100 sec bins |
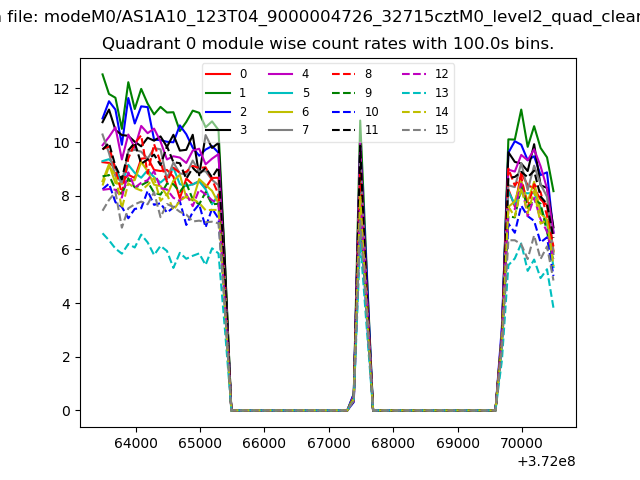 |
 |
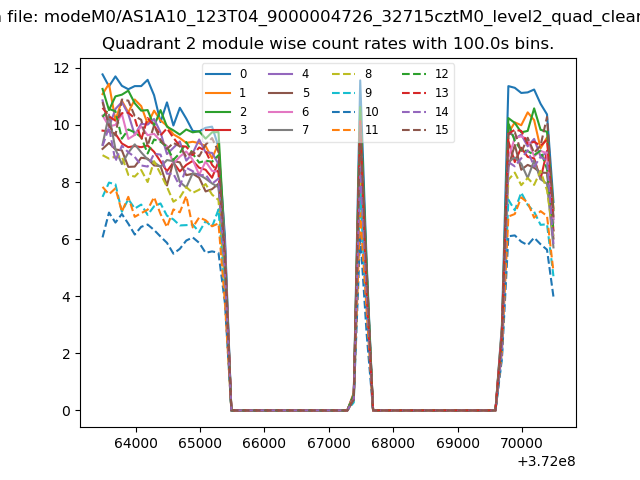
| Module-wise count rates for Quadrant B Data is divided into 100 sec bins |
 |
 |
| Module-wise count rates for Quadrant C Data is divided into 100 sec bins |
 |
 |
| Module-wise count rates for Quadrant D Data is divided into 100 sec bins |
 |
 |
| Parameter | Plot |
|---|---|
| CZT HV Monitor | 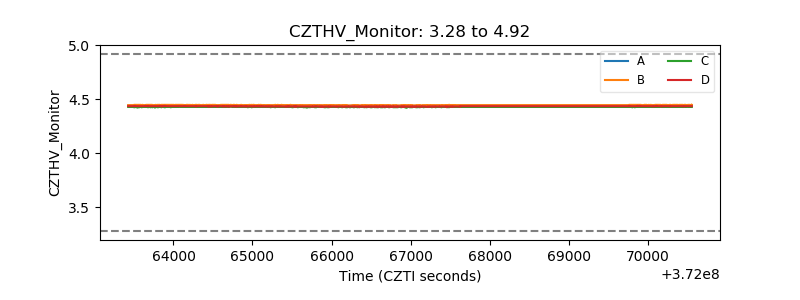 |
| D_VDD | 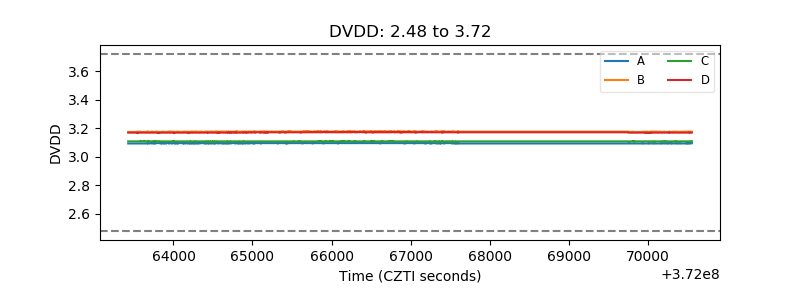 |
| Temperature 1 | 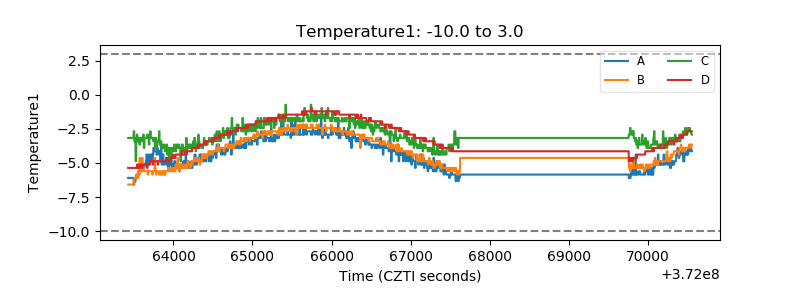 |
| Veto HV Monitor | 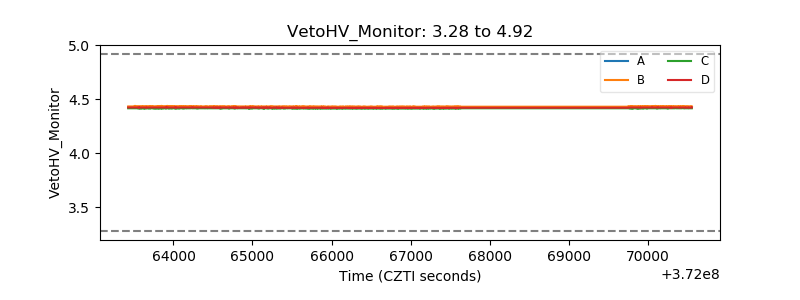 |
| Veto LLD |  |
| Alpha Counter | 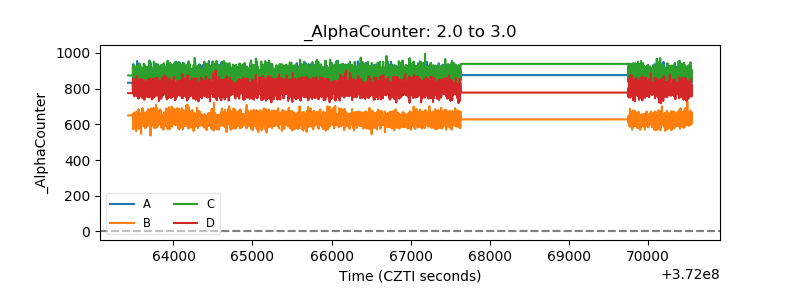 |
| _CPM_Rate | 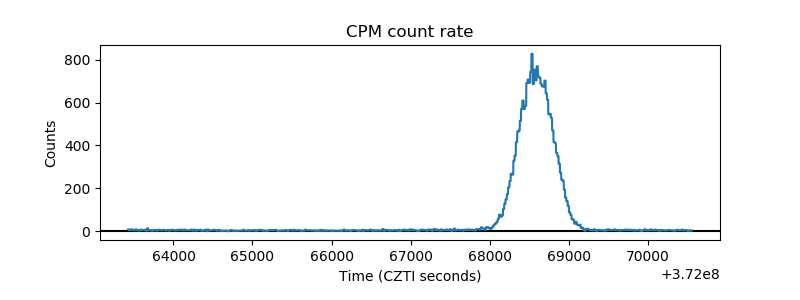 |
| CZT Counter | 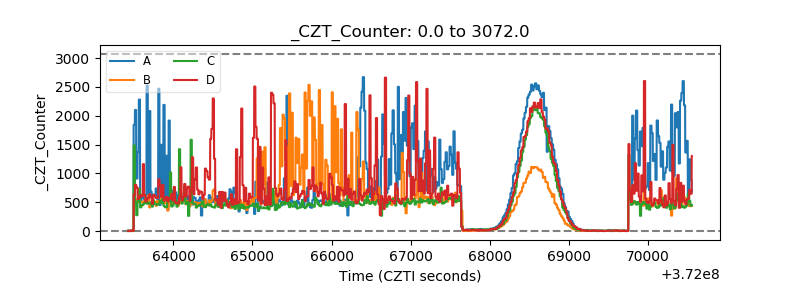 |
| +2.5 Volts monitor |  |
| +5 Volts monitor |  |
| _ROLL_ROT | 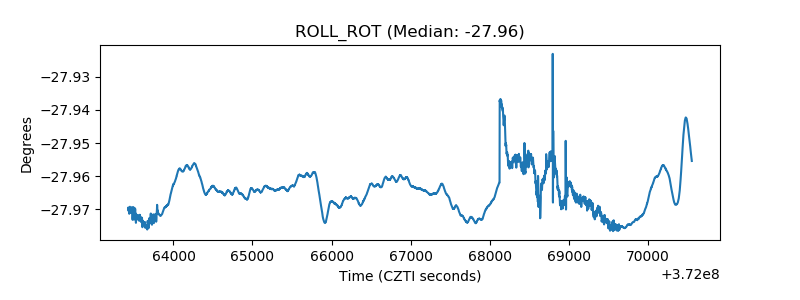 |
| _Roll_DEC | 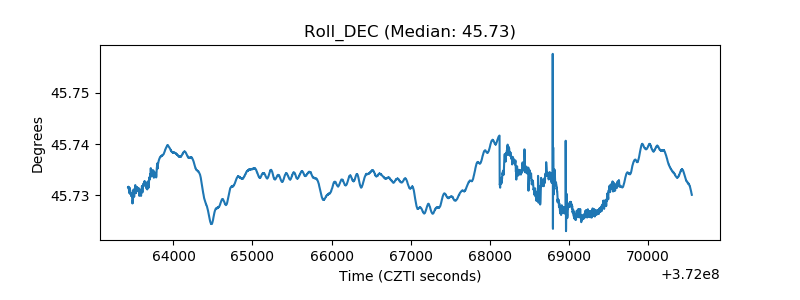 |
| _Roll_RA | 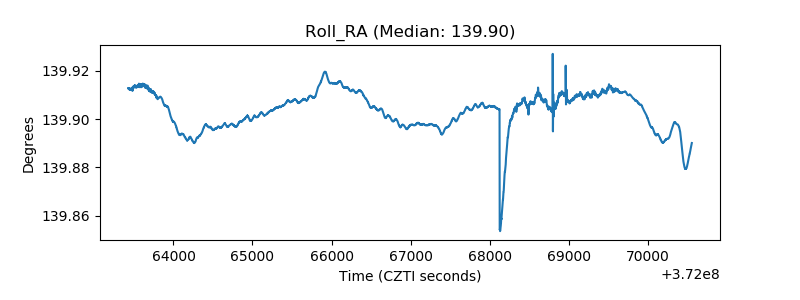 |
| Veto Counter | 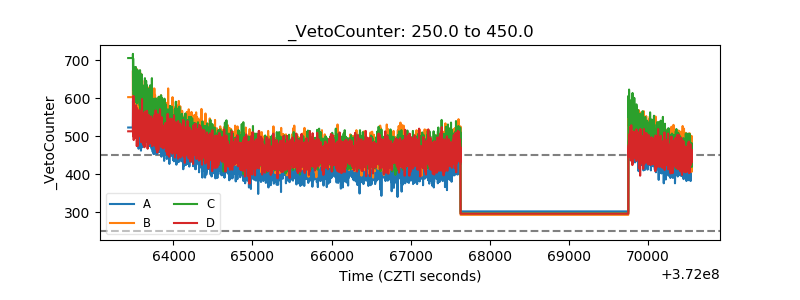 |