| Param | Original file | Final file |
|---|---|---|
| Filename | modeM0/AS1A10_123T04_9000004726_32716cztM0_level2.evt | modeM0/AS1A10_123T04_9000004726_32716cztM0_level2_quad_clean.evt |
| Size (bytes) | 529,773,120 | 63,244,800 |
| Size | 505.2 MB | 60.3 MB |
| Events in quadrant A | 6,450,269 | 379,319 |
| Events in quadrant B | 2,955,114 | 404,874 |
| Events in quadrant C | 2,370,452 | 401,696 |
| Events in quadrant D | 3,928,524 | 377,025 |
| Mode M0 | |||
|---|---|---|---|
| Quadrant | BADHDUFLAG | Total packets | Discarded packets |
| A | 0 | 22597 | 2 |
| B | 0 | 11826 | 1 |
| C | 0 | 10256 | 1 |
| D | 0 | 15211 | 1 |
| Mode M9 | |||
|---|---|---|---|
| Quadrant | BADHDUFLAG | Total packets | Discarded packets |
| A | 0 | 24 | 0 |
| B | 0 | 24 | 0 |
| C | 0 | 24 | 0 |
| D | 0 | 25 | 0 |
| Mode SS | |||
|---|---|---|---|
| Quadrant | BADHDUFLAG | Total packets | Discarded packets |
| A | 0 | 100 | 0 |
| B | 0 | 100 | 0 |
| C | 0 | 100 | 0 |
| D | 0 | 100 | 0 |
| Quadrant | Total seconds | Saturated seconds | Saturation percentage |
|---|---|---|---|
| A | 5025 | 1231 | 24.497512% |
| B | 5025 | 126 | 2.507463% |
| C | 5025 | 14 | 0.278607% |
| D | 5025 | 165 | 3.283582% |
Noise dominated data is calculated using 1-second bins in cleaned event files. If a bin has >2000 counts, and if more than 50% of those come from <1% of pixels, then it is considered to be noise-dominated and hence unusable.
| Quadrant | # 1 sec bins | Bins with >0 counts | Bins with >2000 counts | High rate bins dominated by noise | Noise dominated (total time) | Noise dominated (detector-on time) | Marked lightcurve |
|---|---|---|---|---|---|---|---|
| A | 7059 | 5026 | 1082 | 1082 | 15.33% | 21.53% | 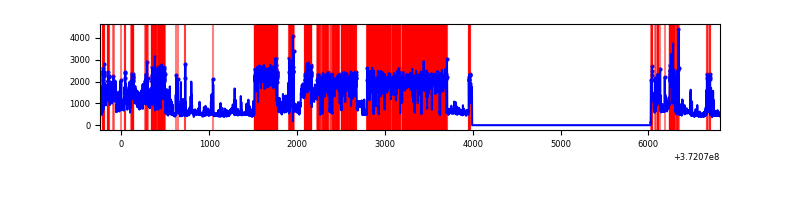 |
| B | 7059 | 5026 | 93 | 93 | 1.32% | 1.85% | 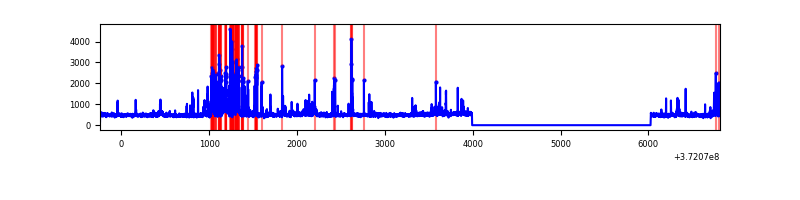 |
| C | 7059 | 5026 | 9 | 9 | 0.13% | 0.18% | 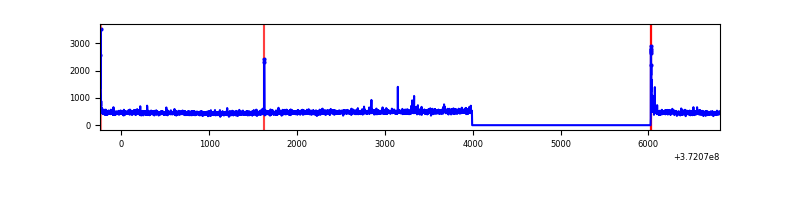 |
| D | 7059 | 5026 | 128 | 128 | 1.81% | 2.55% | 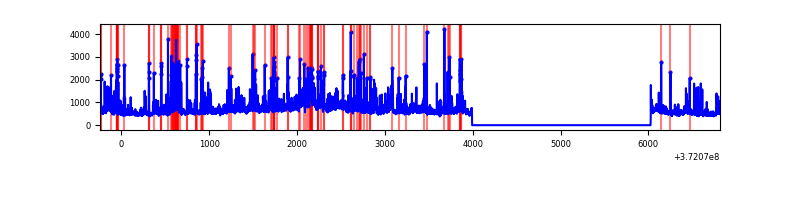 |
Top three noisy pixels from each quadrant. If the there are fewer than three noisy pixels in the level2.evt file, extra rows are filled as -1
| Pixel properties | Quadrant properties | ||||||
|---|---|---|---|---|---|---|---|
| Quadrant | DetID | PixID | Counts | Sigma | Mean | Median | Sigma |
| A | 15 | 249 | 4156600 | 36347.9 | 577 | 566 | 114.3 |
| A | 15 | 237 | 18315 | 155.23 | 577 | 566 | 114.3 |
| A | 12 | 189 | 14090 | 118.28 | 577 | 566 | 114.3 |
| B | 4 | 251 | 408527 | 3622.21 | 600 | 589 | 112.6 |
| B | 5 | 32 | 46738 | 409.77 | 600 | 589 | 112.6 |
| B | 0 | 199 | 35805 | 312.69 | 600 | 589 | 112.6 |
| C | 0 | 10 | 39607 | 287.59 | 585 | 588 | 135.7 |
| C | 3 | 233 | 20375 | 145.84 | 585 | 588 | 135.7 |
| C | 0 | 239 | 11247 | 78.56 | 585 | 588 | 135.7 |
| D | 8 | 195 | 380566 | 2687.16 | 582 | 569 | 141.4 |
| D | 2 | 250 | 327125 | 2309.25 | 582 | 569 | 141.4 |
| D | 2 | 249 | 322034 | 2273.25 | 582 | 569 | 141.4 |
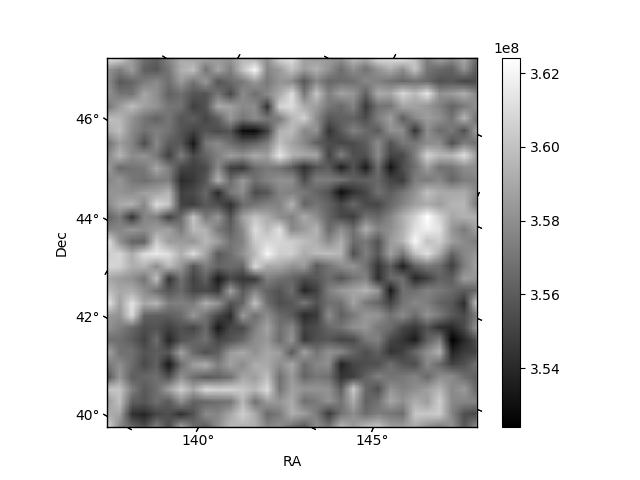
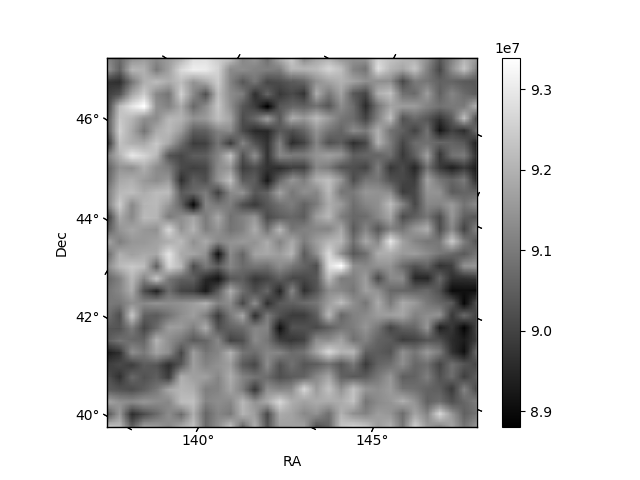
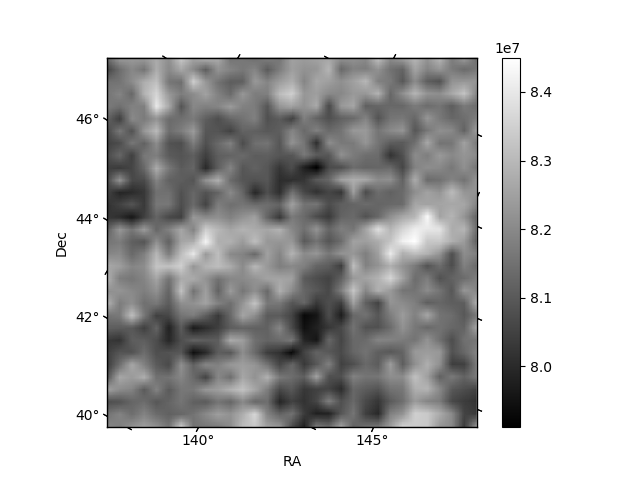
Histogram calculated using DETX and DETY for each event in the final _common_clean file
| Quadrant A | 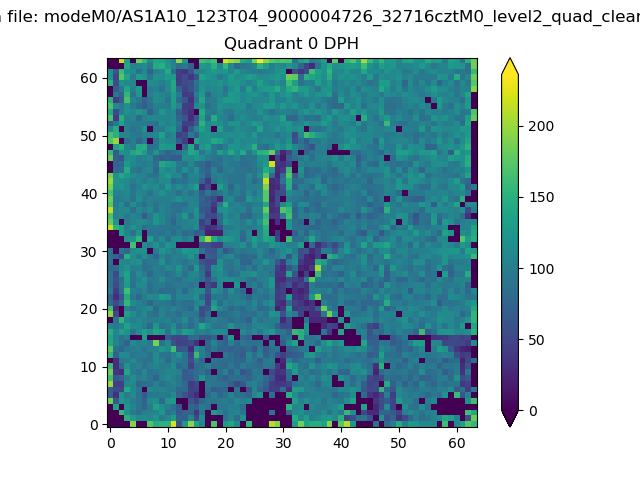 |
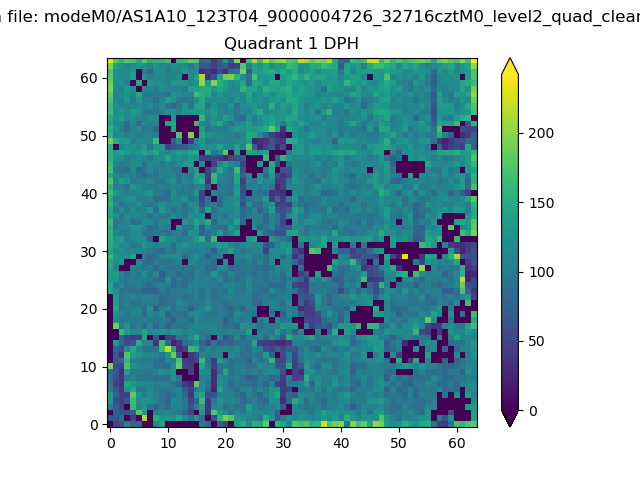 |
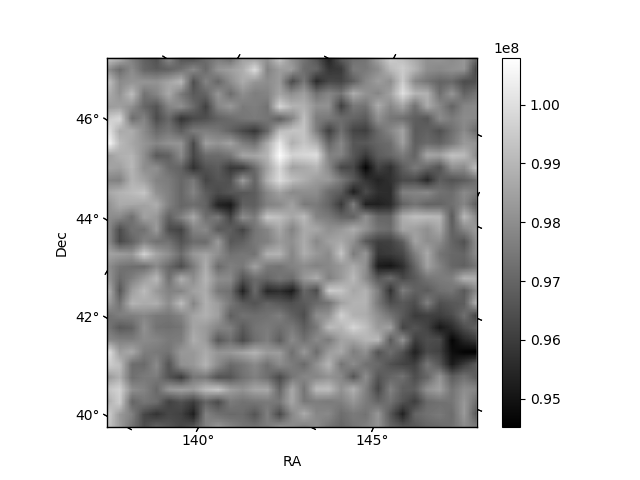
Quadrant B |
|---|---|---|---|
| Quadrant D | 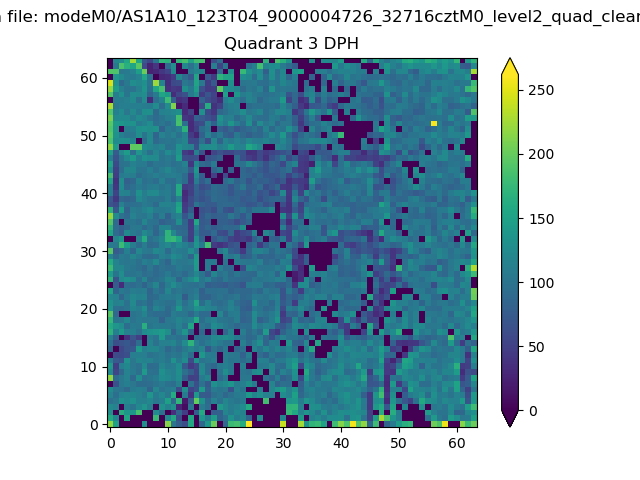 |
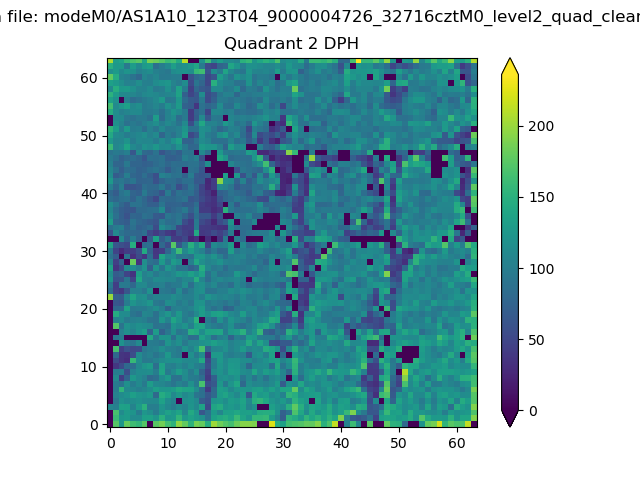 |
Quadrant C |
| Plot type | Count rate plots | Images |
|---|---|---|
| Comparison with Poisson distribution Blue bars denote a histogram of data divided into 1 sec bins. Red curve is a Poisson curve with rate = median count rate of data. |
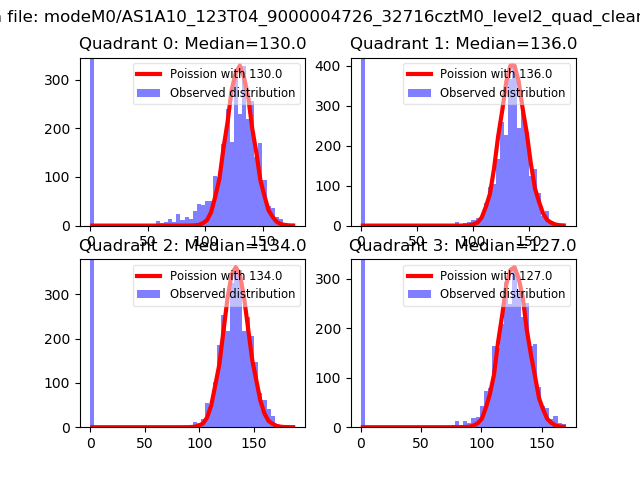 |
 |
| Quadrant-wise count rates Data is divided into 100 sec bins |
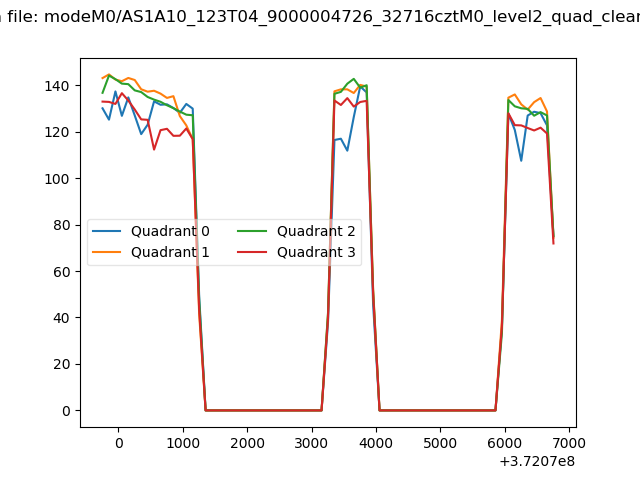 |
|
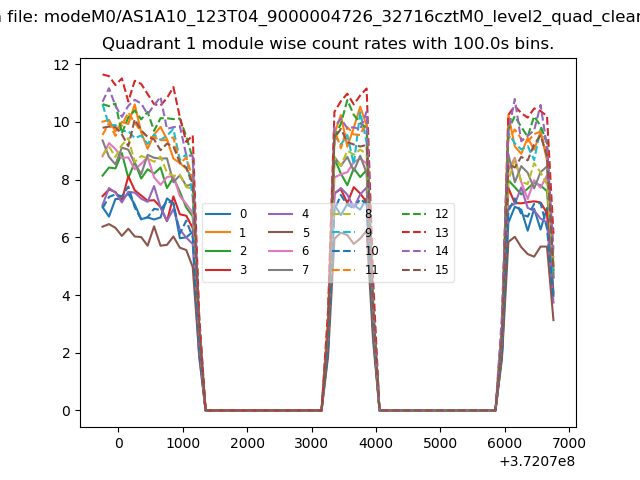
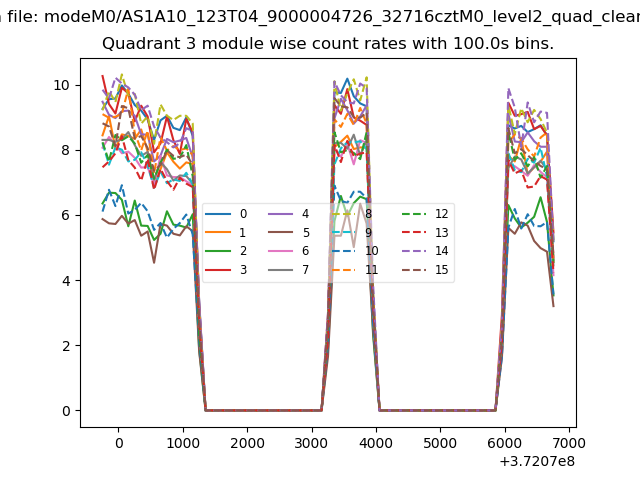
| Module-wise count rates for Quadrant A Data is divided into 100 sec bins |
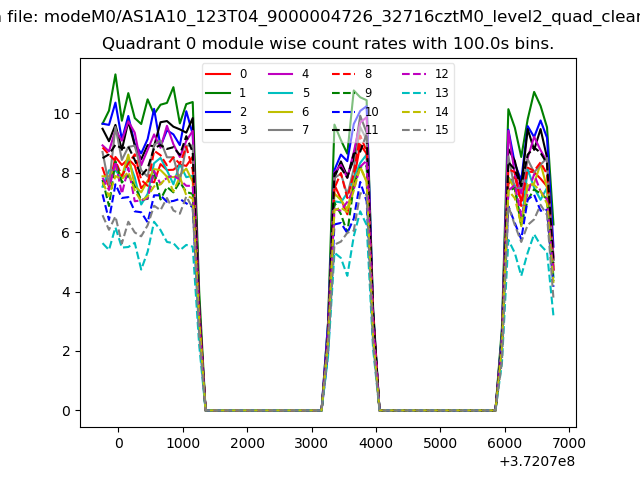 |
 |
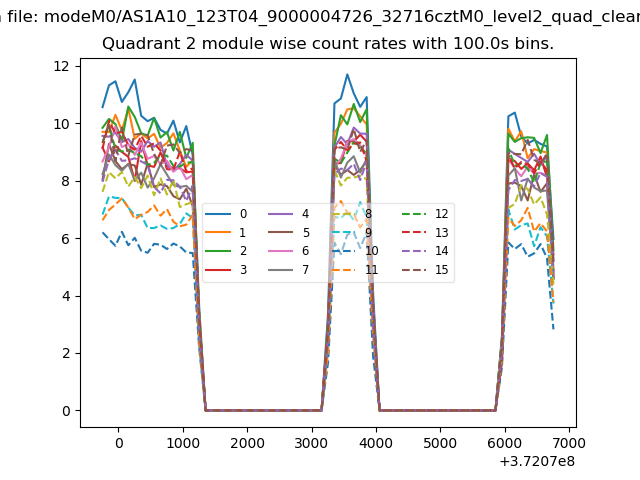
| Module-wise count rates for Quadrant B Data is divided into 100 sec bins |
 |
 |
| Module-wise count rates for Quadrant C Data is divided into 100 sec bins |
 |
 |
| Module-wise count rates for Quadrant D Data is divided into 100 sec bins |
 |
 |
| Parameter | Plot |
|---|---|
| CZT HV Monitor | 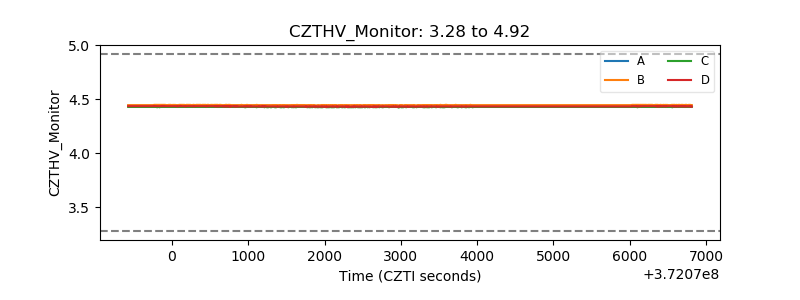 |
| D_VDD | 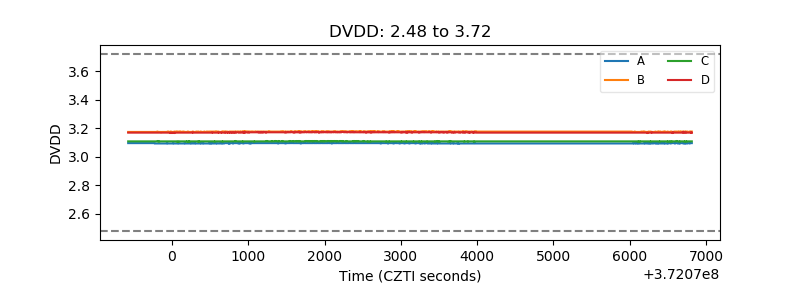 |
| Temperature 1 |  |
| Veto HV Monitor | 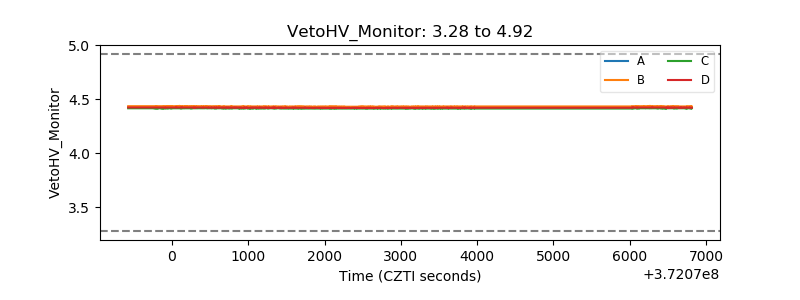 |
| Veto LLD | 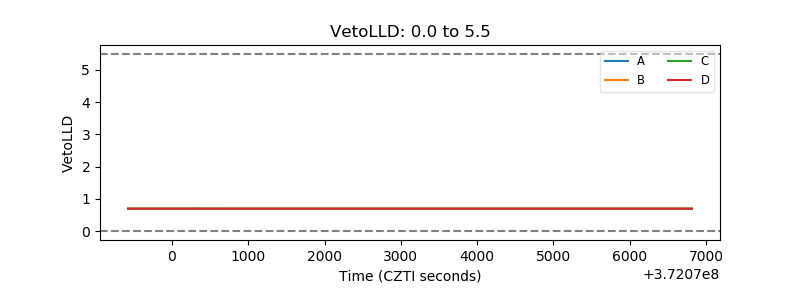 |
| Alpha Counter | 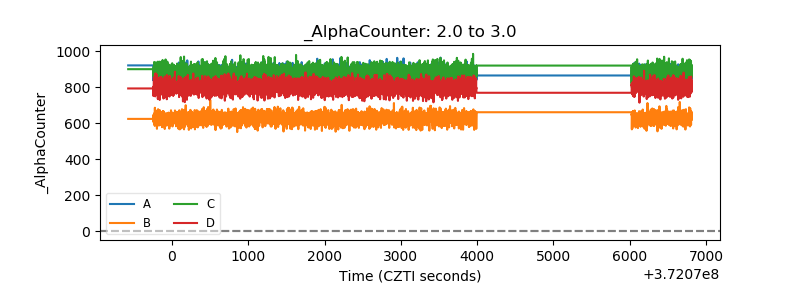 |
| _CPM_Rate | 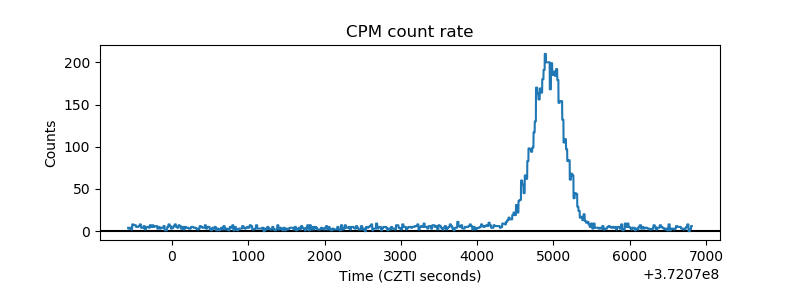 |
| CZT Counter | 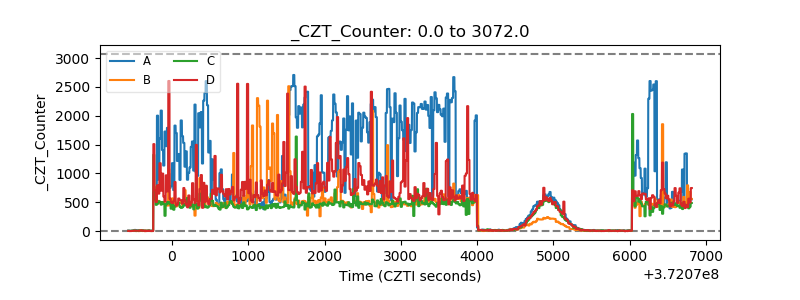 |
| +2.5 Volts monitor |  |
| +5 Volts monitor |  |
| _ROLL_ROT |  |
| _Roll_DEC | 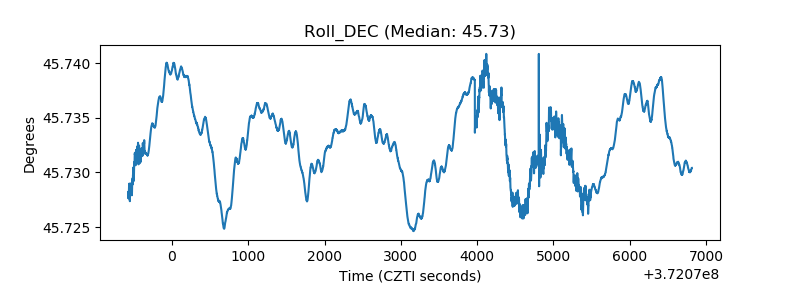 |
| _Roll_RA | 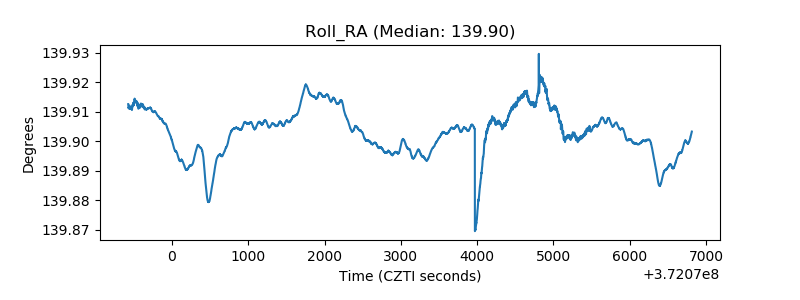 |
| Veto Counter | 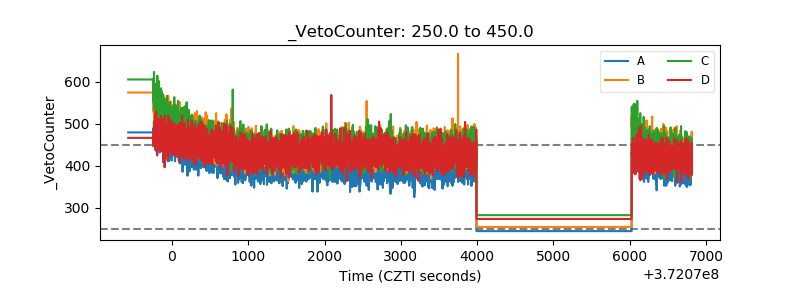 |