| Param | Original file | Final file |
|---|---|---|
| Filename | modeM0/AS1A10_123T04_9000004726_32717cztM0_level2.evt | modeM0/AS1A10_123T04_9000004726_32717cztM0_level2_quad_clean.evt |
| Size (bytes) | 499,812,480 | 64,520,640 |
| Size | 476.7 MB | 61.5 MB |
| Events in quadrant A | 4,689,179 | 391,455 |
| Events in quadrant B | 3,286,642 | 407,730 |
| Events in quadrant C | 2,982,753 | 400,280 |
| Events in quadrant D | 3,818,267 | 381,940 |
| Mode M0 | |||
|---|---|---|---|
| Quadrant | BADHDUFLAG | Total packets | Discarded packets |
| A | 0 | 17588 | 198 |
| B | 0 | 13162 | 80 |
| C | 0 | 12454 | 97 |
| D | 0 | 15032 | 143 |
| Mode M9 | |||
|---|---|---|---|
| Quadrant | BADHDUFLAG | Total packets | Discarded packets |
| A | 0 | 24 | 0 |
| B | 0 | 24 | 0 |
| C | 0 | 24 | 1 |
| D | 0 | 25 | 0 |
| Mode SS | |||
|---|---|---|---|
| Quadrant | BADHDUFLAG | Total packets | Discarded packets |
| A | 0 | 110 | 0 |
| B | 0 | 110 | 0 |
| C | 0 | 110 | 2 |
| D | 0 | 110 | 0 |
| Quadrant | Total seconds | Saturated seconds | Saturation percentage |
|---|---|---|---|
| A | 5300 | 438 | 8.264151% |
| B | 5316 | 61 | 1.147479% |
| C | 5313 | 138 | 2.597403% |
| D | 5305 | 148 | 2.789821% |
Noise dominated data is calculated using 1-second bins in cleaned event files. If a bin has >2000 counts, and if more than 50% of those come from <1% of pixels, then it is considered to be noise-dominated and hence unusable.
| Quadrant | # 1 sec bins | Bins with >0 counts | Bins with >2000 counts | High rate bins dominated by noise | Noise dominated (total time) | Noise dominated (detector-on time) | Marked lightcurve |
|---|---|---|---|---|---|---|---|
| A | 7111 | 5346 | 336 | 336 | 4.73% | 6.29% | 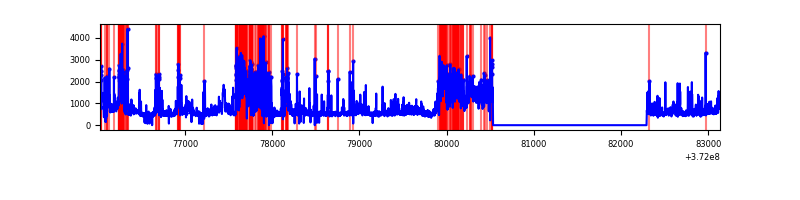 |
| B | 7111 | 5347 | 31 | 31 | 0.44% | 0.58% | 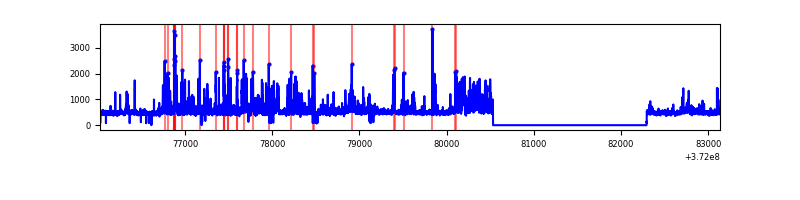 |
| C | 7111 | 5347 | 123 | 123 | 1.73% | 2.30% | 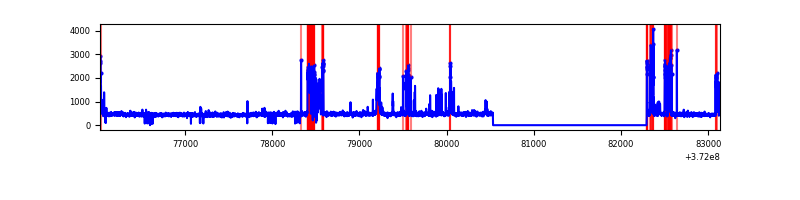 |
| D | 7111 | 5346 | 100 | 100 | 1.41% | 1.87% | 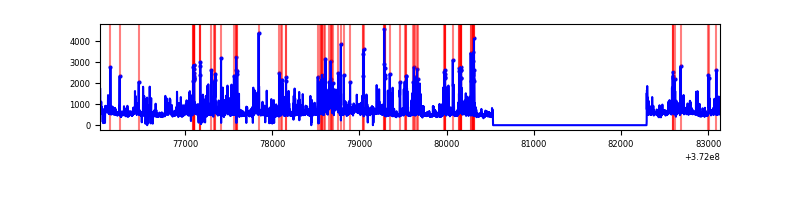 |
Top three noisy pixels from each quadrant. If the there are fewer than three noisy pixels in the level2.evt file, extra rows are filled as -1
| Pixel properties | Quadrant properties | ||||||
|---|---|---|---|---|---|---|---|
| Quadrant | DetID | PixID | Counts | Sigma | Mean | Median | Sigma |
| A | 15 | 249 | 2229539 | 18450.89 | 609 | 598 | 120.8 |
| A | 15 | 237 | 46516 | 380.1 | 609 | 598 | 120.8 |
| A | 7 | 16 | 14746 | 117.12 | 609 | 598 | 120.8 |
| B | 3 | 26 | 328380 | 2762.07 | 624 | 610 | 118.7 |
| B | 4 | 251 | 168331 | 1413.36 | 624 | 610 | 118.7 |
| B | 5 | 172 | 104182 | 872.79 | 624 | 610 | 118.7 |
| C | 0 | 10 | 553641 | 3985.26 | 602 | 606 | 138.8 |
| C | 3 | 233 | 28464 | 200.75 | 602 | 606 | 138.8 |
| C | 9 | 54 | 17647 | 122.8 | 602 | 606 | 138.8 |
| D | 2 | 249 | 440091 | 3031.84 | 600 | 587 | 145.0 |
| D | 2 | 250 | 292708 | 2015.15 | 600 | 587 | 145.0 |
| D | 7 | 80 | 229425 | 1578.6 | 600 | 587 | 145.0 |
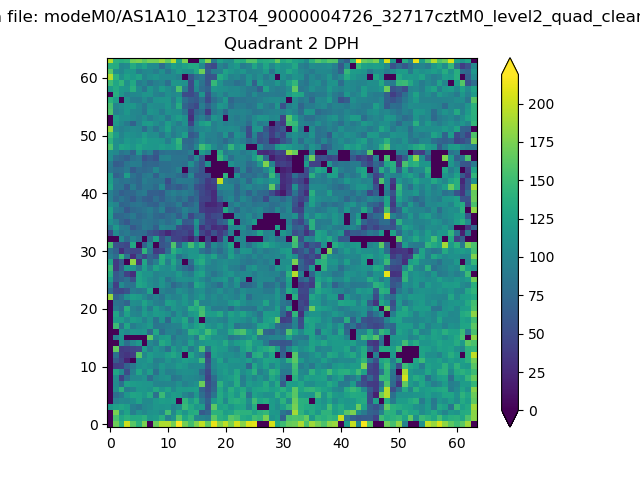
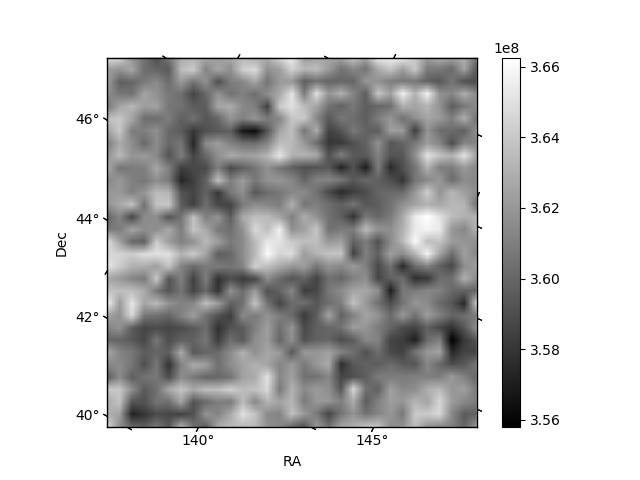
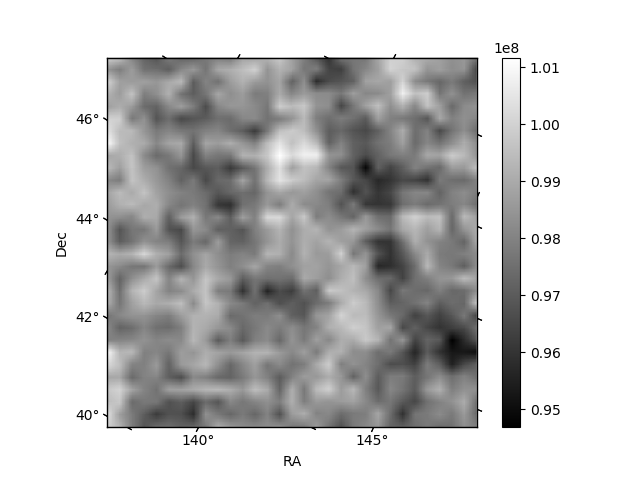
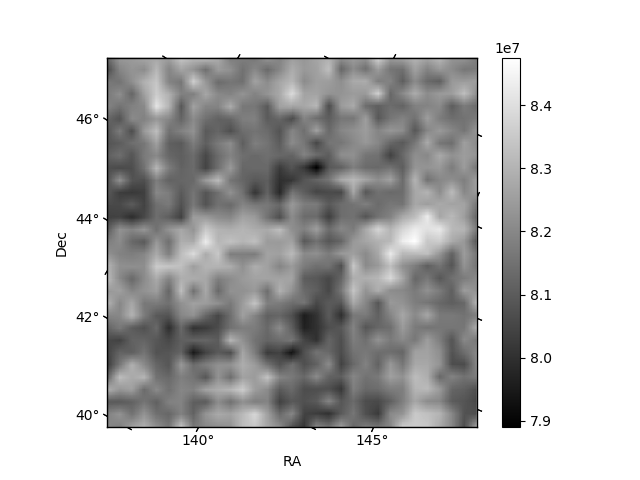
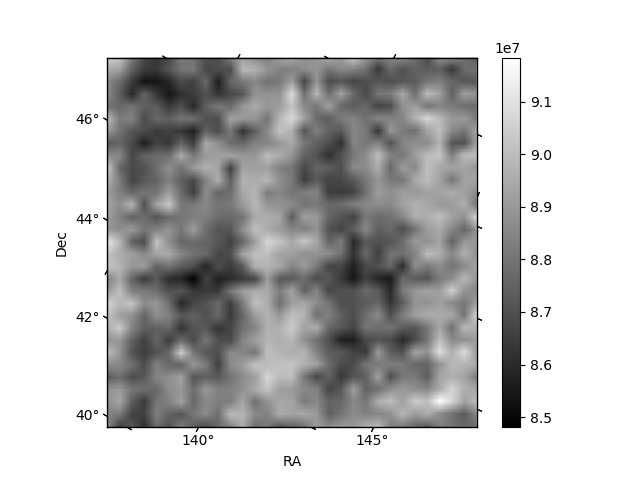
Histogram calculated using DETX and DETY for each event in the final _common_clean file
| Quadrant A | 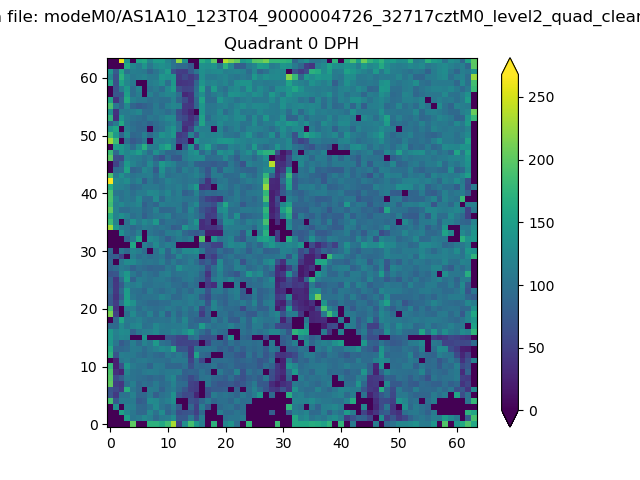 |
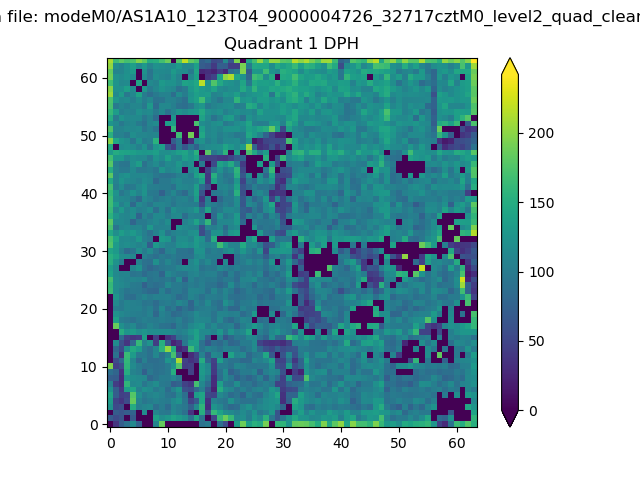 |
Quadrant B |
|---|---|---|---|
| Quadrant D | 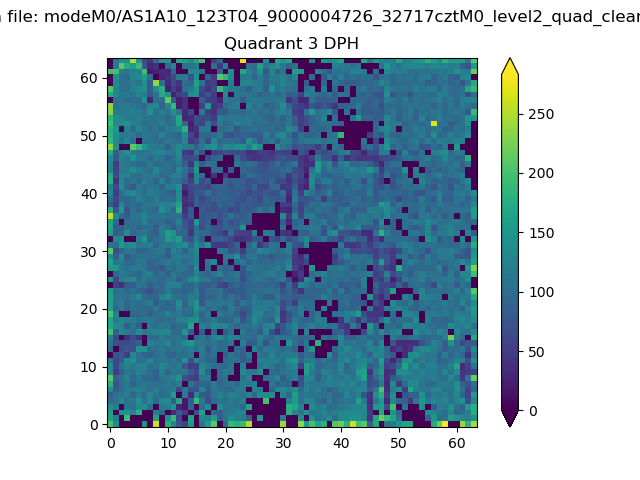 |
 |
Quadrant C |
| Plot type | Count rate plots | Images |
|---|---|---|
| Comparison with Poisson distribution Blue bars denote a histogram of data divided into 1 sec bins. Red curve is a Poisson curve with rate = median count rate of data. |
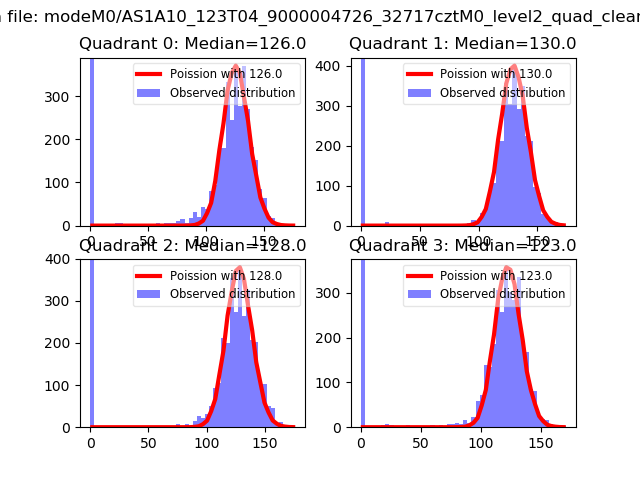 |
 |
| Quadrant-wise count rates Data is divided into 100 sec bins |
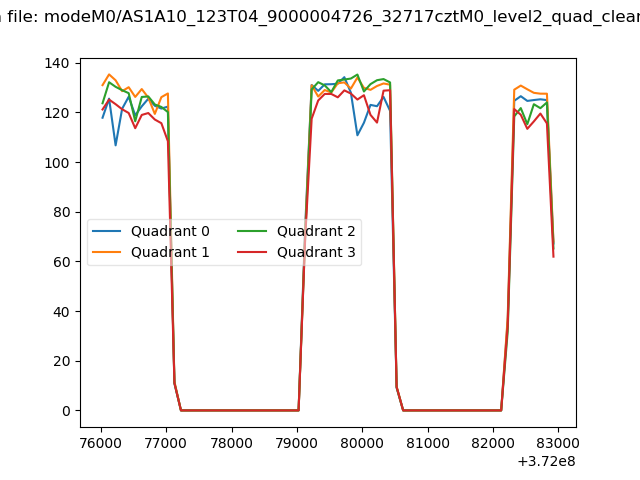 |
|
| Module-wise count rates for Quadrant A Data is divided into 100 sec bins |
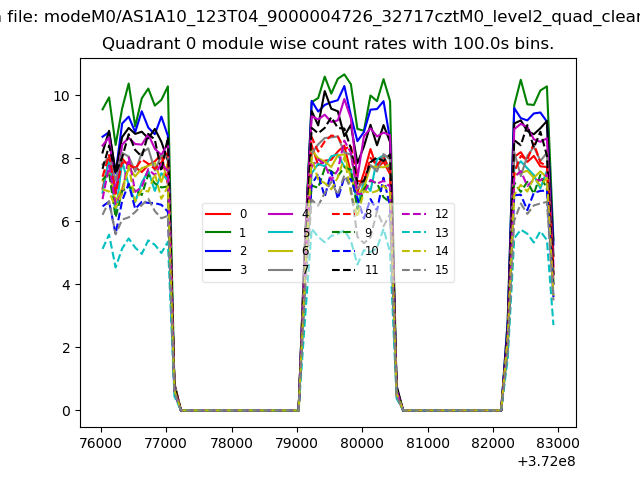 |
 |
| Module-wise count rates for Quadrant B Data is divided into 100 sec bins |
 |
 |
| Module-wise count rates for Quadrant C Data is divided into 100 sec bins |
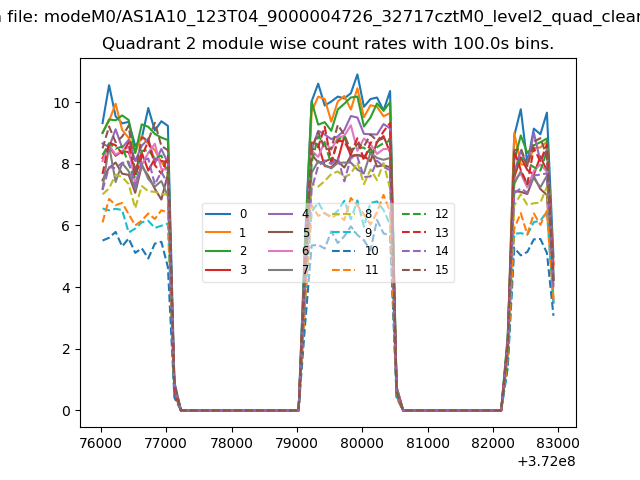 |
 |
| Module-wise count rates for Quadrant D Data is divided into 100 sec bins |
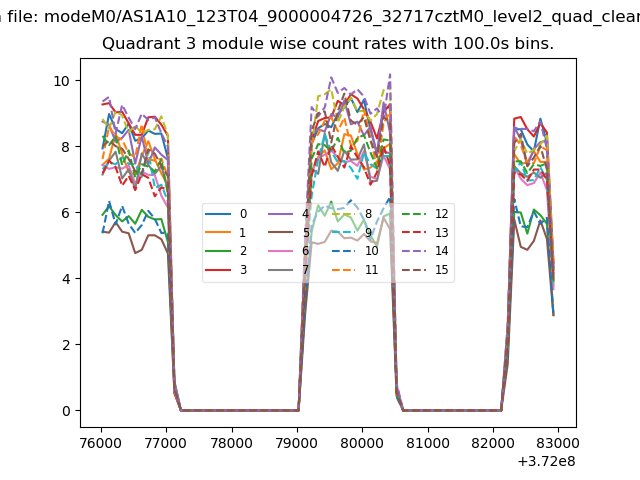 |
 |
| Parameter | Plot |
|---|---|
| CZT HV Monitor | 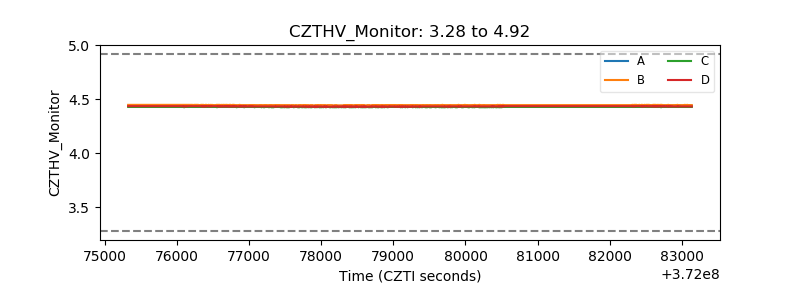 |
| D_VDD |  |
| Temperature 1 | 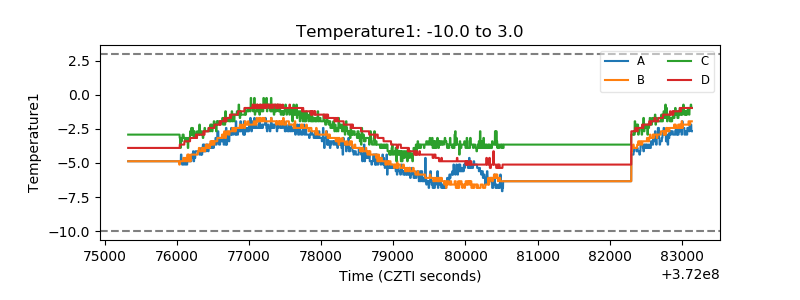 |
| Veto HV Monitor | 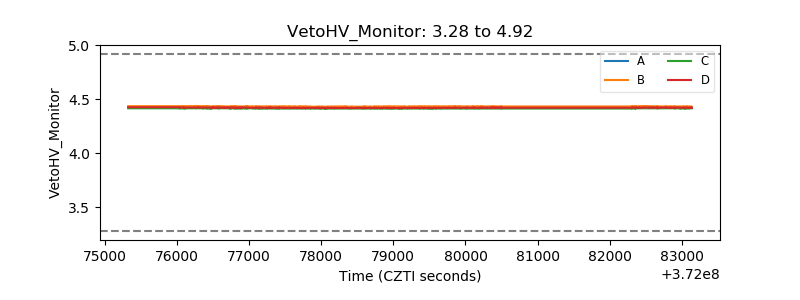 |
| Veto LLD | 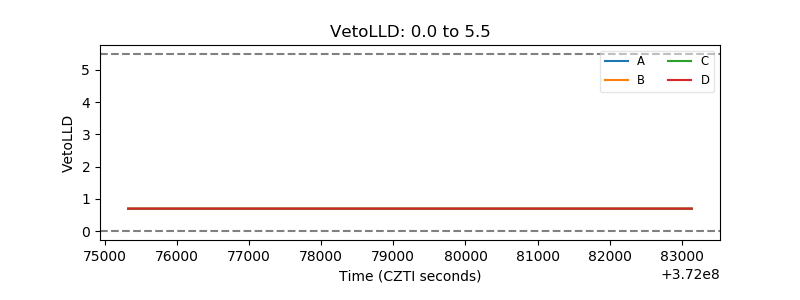 |
| Alpha Counter | 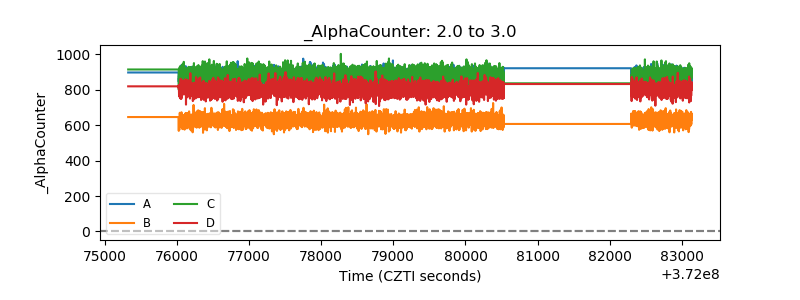 |
| _CPM_Rate | 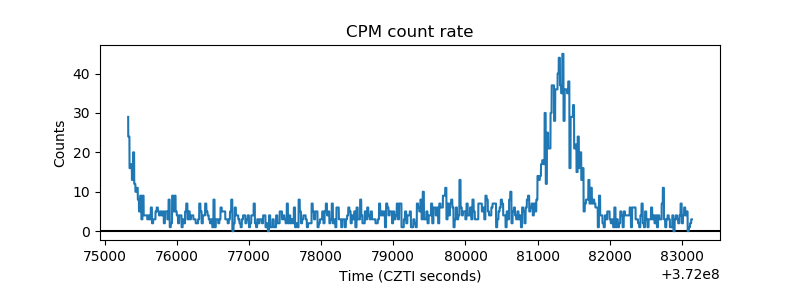 |
| CZT Counter | 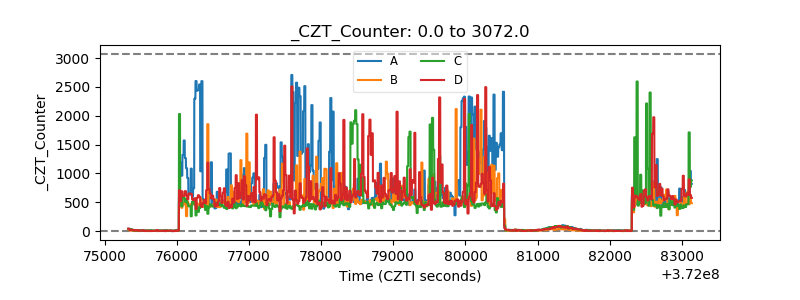 |
| +2.5 Volts monitor |  |
| +5 Volts monitor |  |
| _ROLL_ROT | 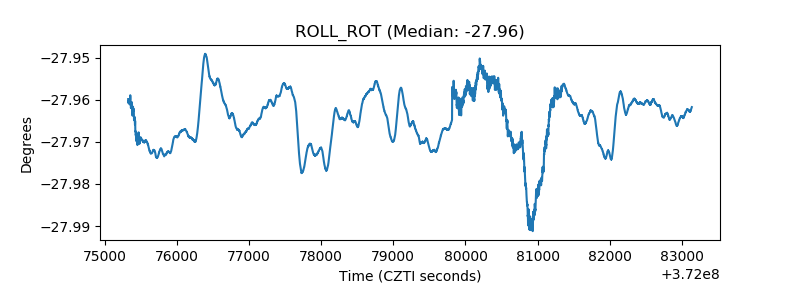 |
| _Roll_DEC | 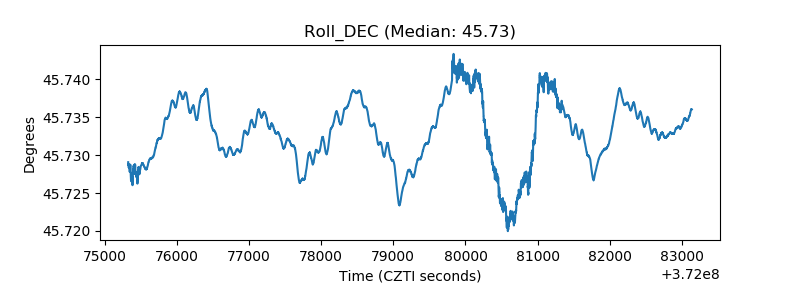 |
| _Roll_RA | 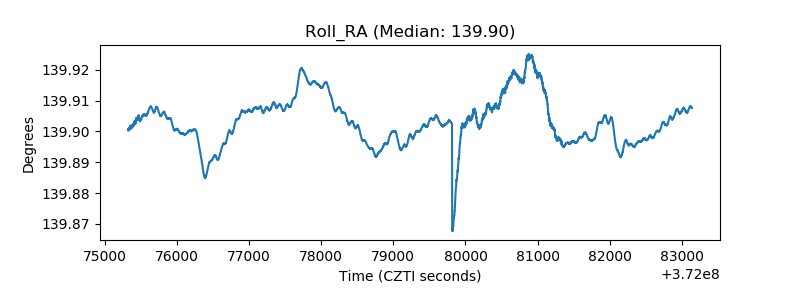 |
| Veto Counter |  |