| Param | Original file | Final file |
|---|---|---|
| Filename | modeM0/AS1A10_123T04_9000004726_32718cztM0_level2.evt | modeM0/AS1A10_123T04_9000004726_32718cztM0_level2_quad_clean.evt |
| Size (bytes) | 565,087,680 | 61,044,480 |
| Size | 538.9 MB | 58.2 MB |
| Events in quadrant A | 5,709,714 | 332,085 |
| Events in quadrant B | 3,531,352 | 382,091 |
| Events in quadrant C | 3,217,907 | 378,079 |
| Events in quadrant D | 4,269,073 | 357,222 |
| Mode M0 | |||
|---|---|---|---|
| Quadrant | BADHDUFLAG | Total packets | Discarded packets |
| A | 0 | 20671 | 4 |
| B | 0 | 14141 | 1 |
| C | 0 | 13272 | 1 |
| D | 0 | 16506 | 5 |
| Mode M9 | |||
|---|---|---|---|
| Quadrant | BADHDUFLAG | Total packets | Discarded packets |
| A | 0 | 14 | 0 |
| B | 0 | 14 | 0 |
| C | 0 | 14 | 0 |
| D | 0 | 14 | 0 |
| Mode SS | |||
|---|---|---|---|
| Quadrant | BADHDUFLAG | Total packets | Discarded packets |
| A | 0 | 116 | 0 |
| B | 0 | 116 | 0 |
| C | 0 | 116 | 0 |
| D | 0 | 116 | 0 |
| Quadrant | Total seconds | Saturated seconds | Saturation percentage |
|---|---|---|---|
| A | 5694 | 1035 | 18.177028% |
| B | 5695 | 182 | 3.195786% |
| C | 5695 | 98 | 1.720808% |
| D | 5694 | 245 | 4.302775% |
Noise dominated data is calculated using 1-second bins in cleaned event files. If a bin has >2000 counts, and if more than 50% of those come from <1% of pixels, then it is considered to be noise-dominated and hence unusable.
| Quadrant | # 1 sec bins | Bins with >0 counts | Bins with >2000 counts | High rate bins dominated by noise | Noise dominated (total time) | Noise dominated (detector-on time) | Marked lightcurve |
|---|---|---|---|---|---|---|---|
| A | 7127 | 5696 | 791 | 791 | 11.10% | 13.89% | 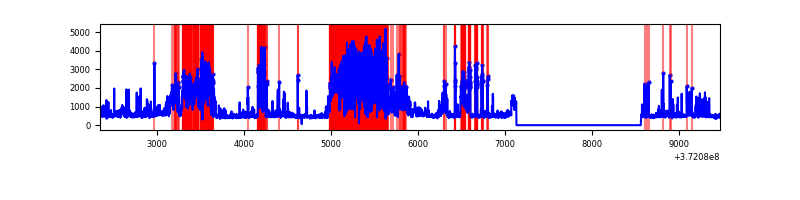 |
| B | 7127 | 5696 | 107 | 107 | 1.50% | 1.88% | 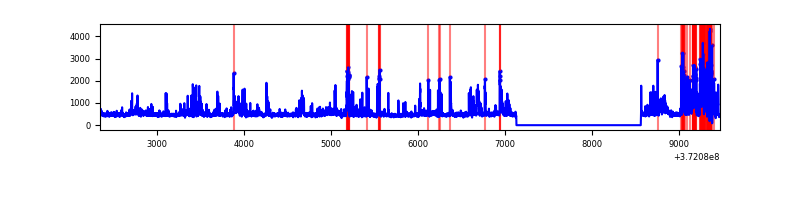 |
| C | 7127 | 5696 | 91 | 91 | 1.28% | 1.60% | 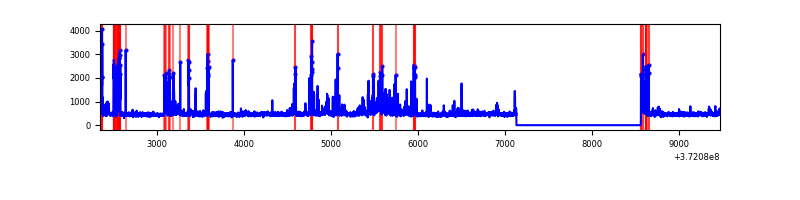 |
| D | 7127 | 5696 | 202 | 202 | 2.83% | 3.55% | 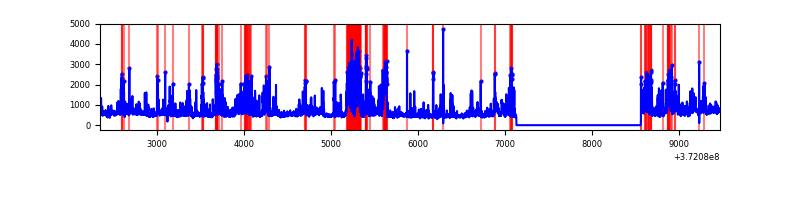 |
Top three noisy pixels from each quadrant. If the there are fewer than three noisy pixels in the level2.evt file, extra rows are filled as -1
| Pixel properties | Quadrant properties | ||||||
|---|---|---|---|---|---|---|---|
| Quadrant | DetID | PixID | Counts | Sigma | Mean | Median | Sigma |
| A | 15 | 249 | 3183470 | 25908.83 | 610 | 597 | 122.8 |
| A | 15 | 237 | 87403 | 706.61 | 610 | 597 | 122.8 |
| A | 9 | 143 | 64933 | 523.7 | 610 | 597 | 122.8 |
| B | 4 | 251 | 462316 | 3648.16 | 659 | 644 | 126.5 |
| B | 3 | 26 | 222848 | 1755.87 | 659 | 644 | 126.5 |
| B | 0 | 219 | 61650 | 482.07 | 659 | 644 | 126.5 |
| C | 0 | 10 | 529105 | 3586.96 | 641 | 646 | 147.3 |
| C | 3 | 233 | 107099 | 722.56 | 641 | 646 | 147.3 |
| C | 8 | 35 | 37298 | 248.78 | 641 | 646 | 147.3 |
| D | 2 | 249 | 627988 | 4100.96 | 635 | 620 | 153.0 |
| D | 2 | 250 | 329948 | 2152.74 | 635 | 620 | 153.0 |
| D | 8 | 195 | 276330 | 1802.25 | 635 | 620 | 153.0 |
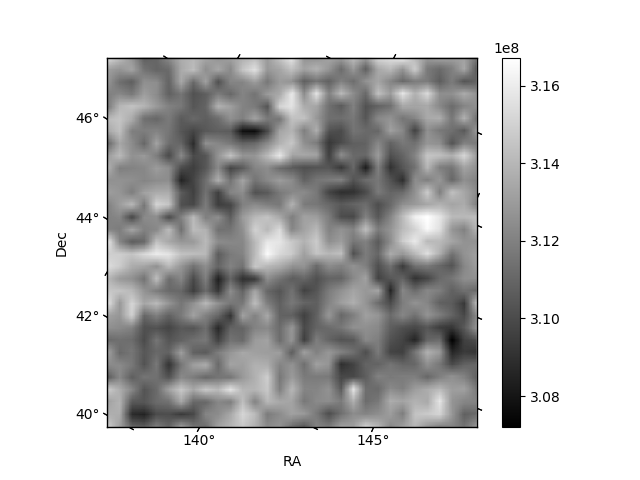
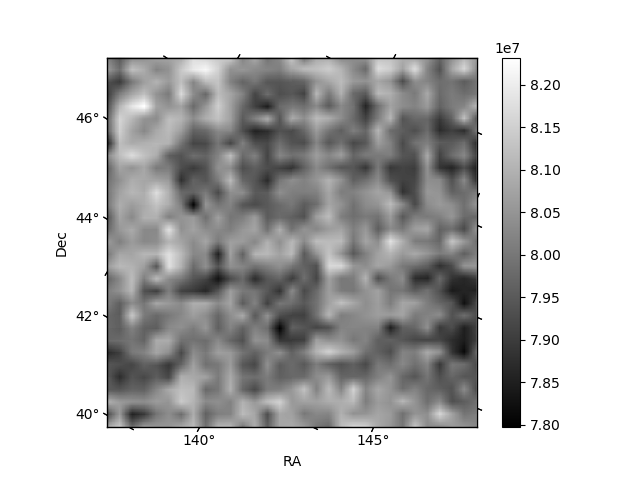
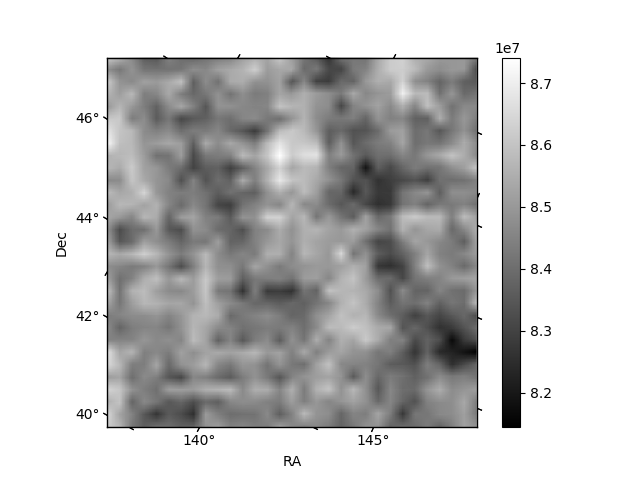
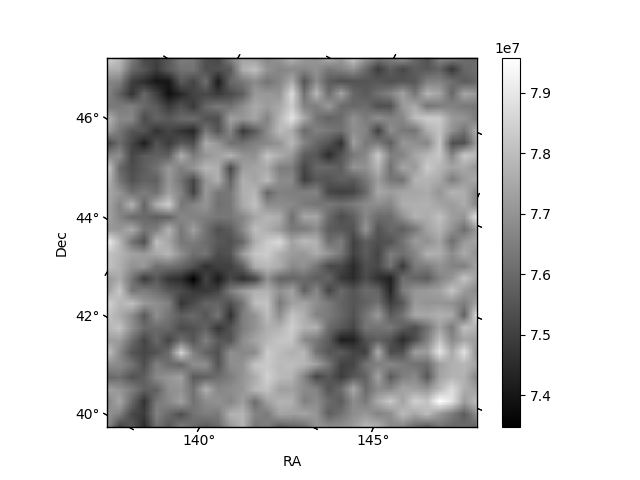
Histogram calculated using DETX and DETY for each event in the final _common_clean file
| Quadrant A | 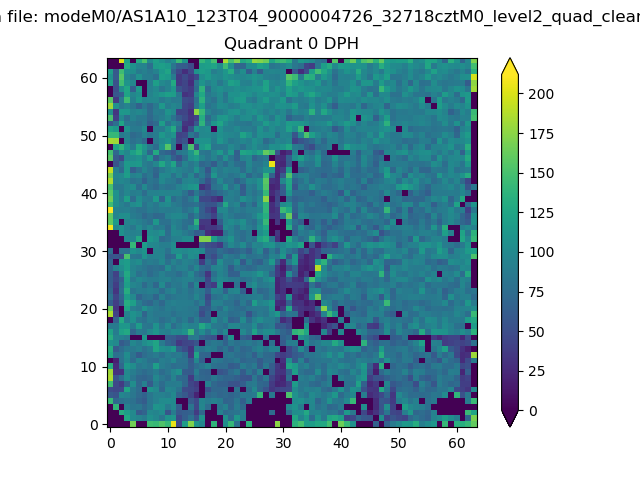 |
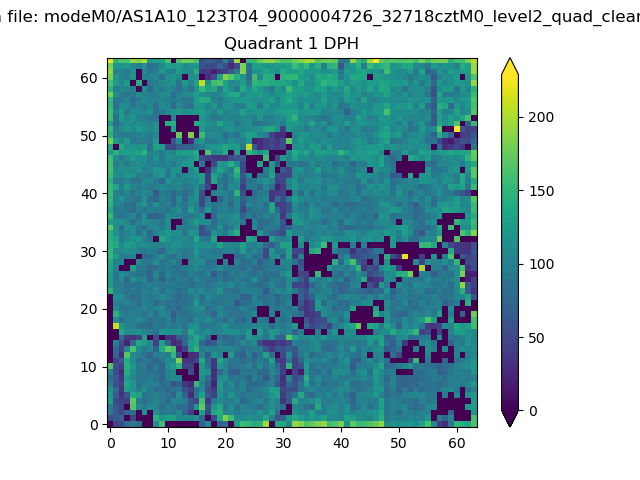 |
Quadrant B |
|---|---|---|---|
| Quadrant D | 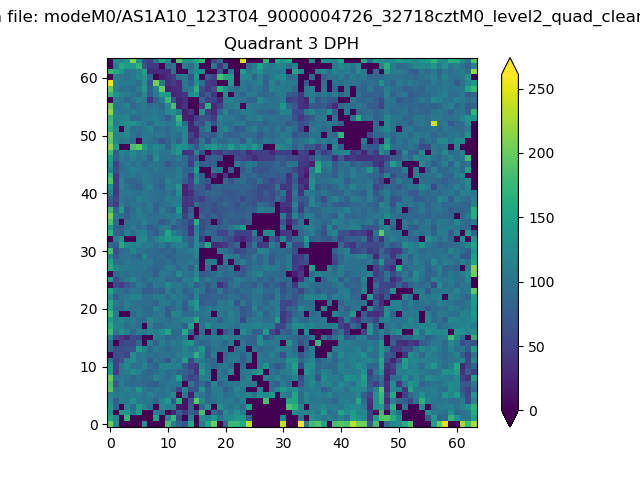 |
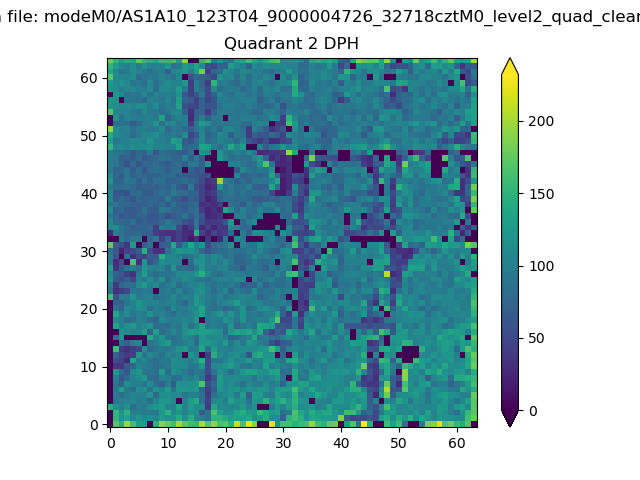 |
Quadrant C |
| Plot type | Count rate plots | Images |
|---|---|---|
| Comparison with Poisson distribution Blue bars denote a histogram of data divided into 1 sec bins. Red curve is a Poisson curve with rate = median count rate of data. |
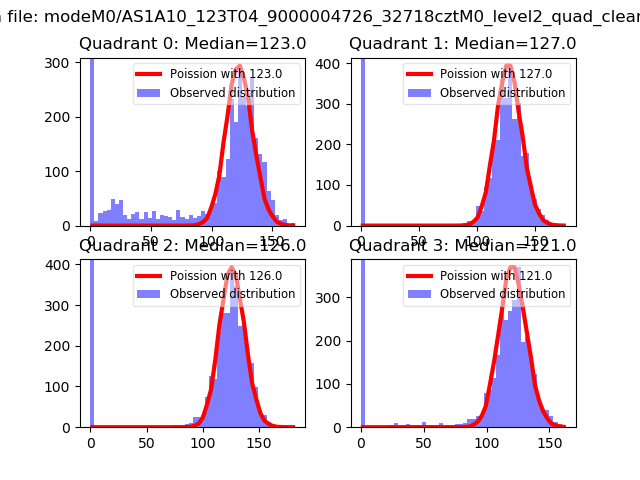 |
 |
| Quadrant-wise count rates Data is divided into 100 sec bins |
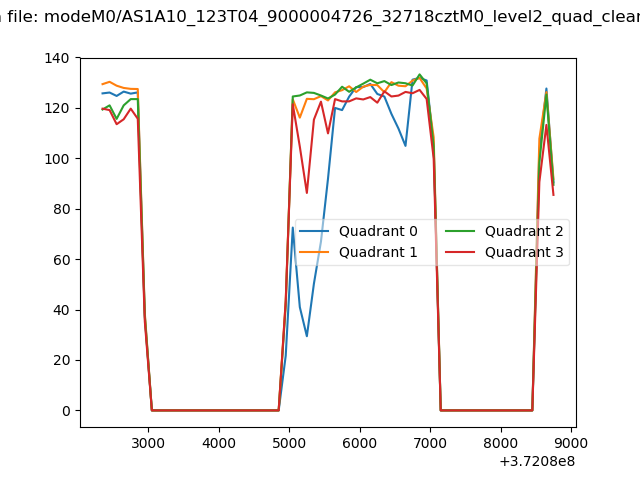 |
|
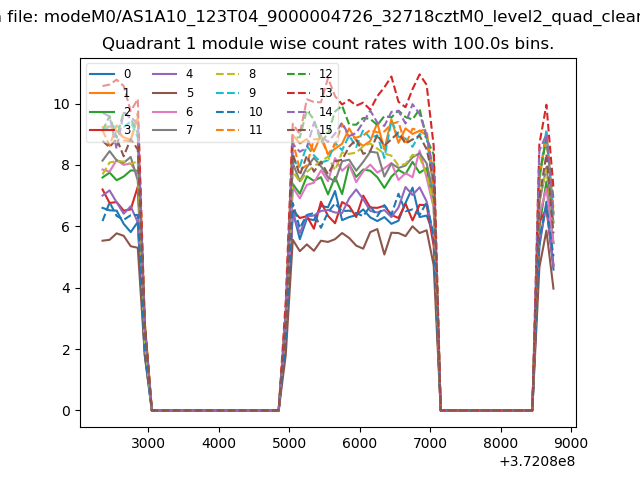
| Module-wise count rates for Quadrant A Data is divided into 100 sec bins |
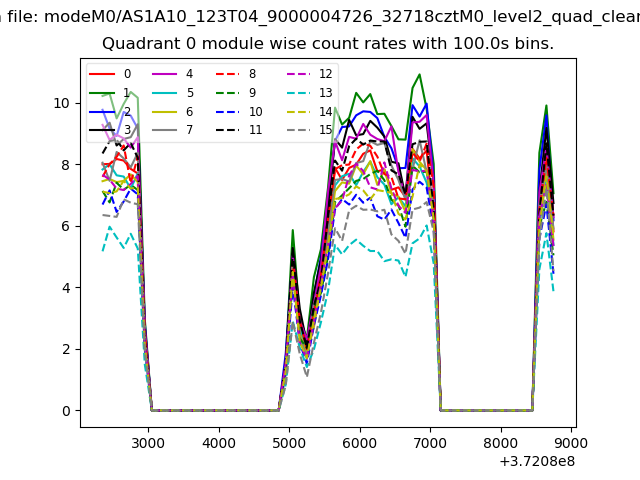 |
 |
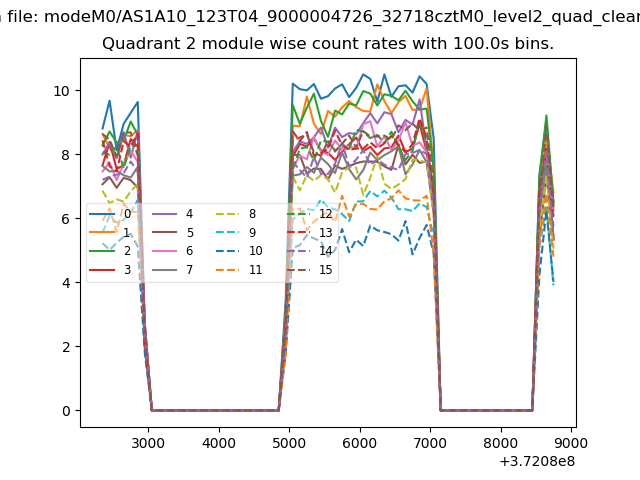
| Module-wise count rates for Quadrant B Data is divided into 100 sec bins |
 |
 |
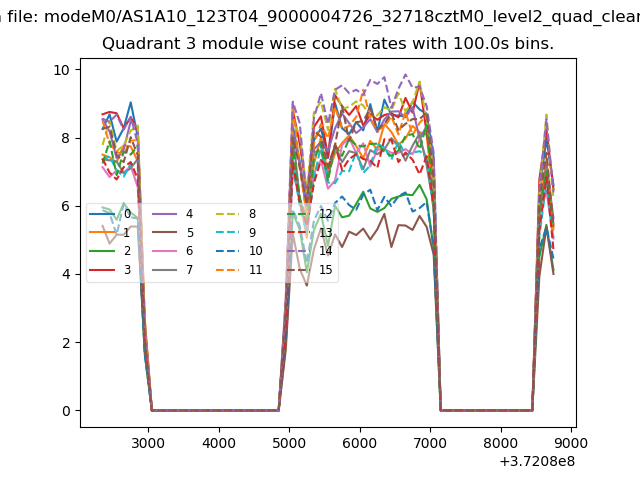
| Module-wise count rates for Quadrant C Data is divided into 100 sec bins |
 |
 |
| Module-wise count rates for Quadrant D Data is divided into 100 sec bins |
 |
 |
| Parameter | Plot |
|---|---|
| CZT HV Monitor | 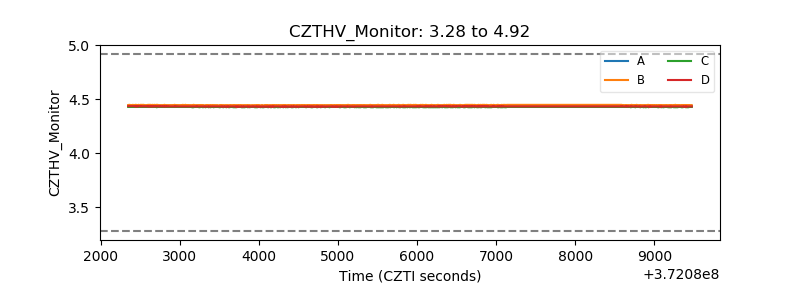 |
| D_VDD | 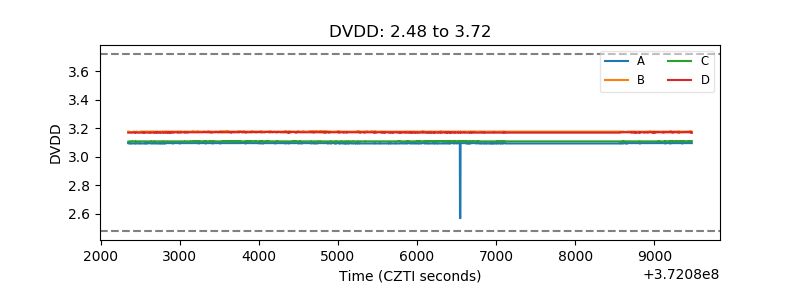 |
| Temperature 1 | 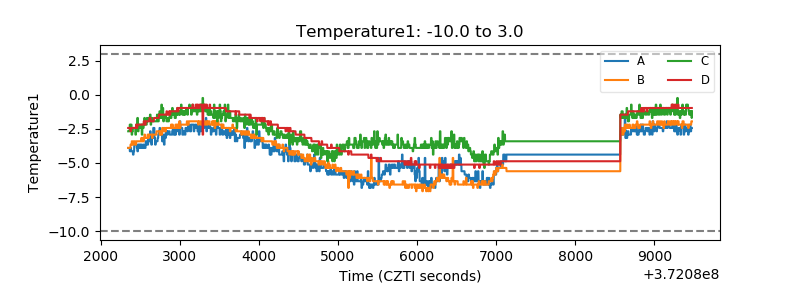 |
| Veto HV Monitor | 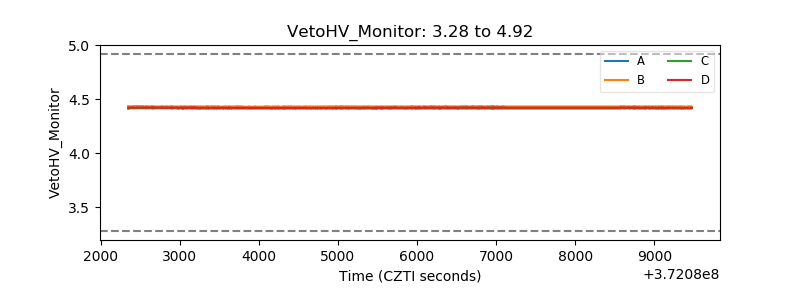 |
| Veto LLD | 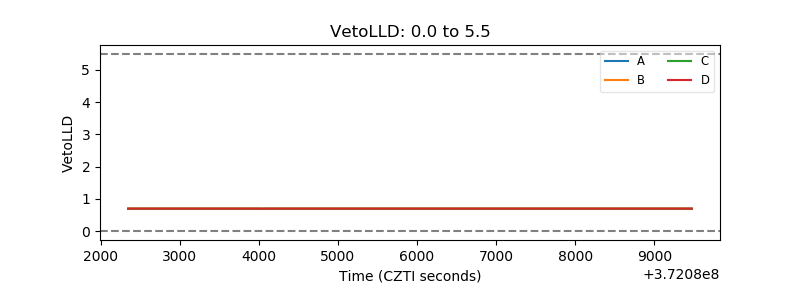 |
| Alpha Counter | 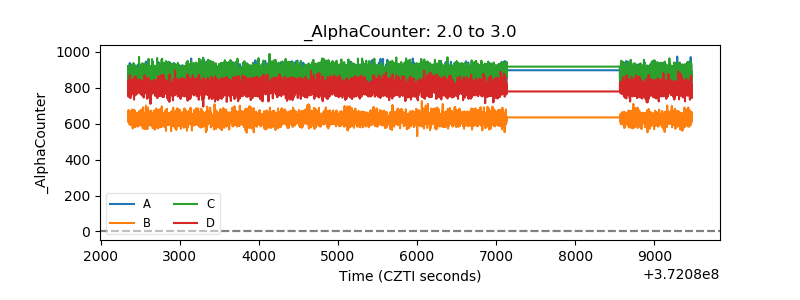 |
| _CPM_Rate | 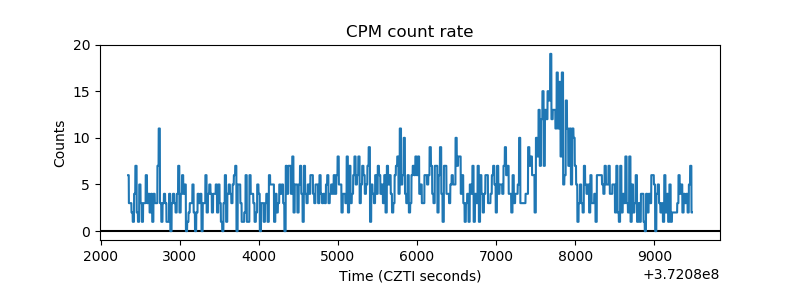 |
| CZT Counter | 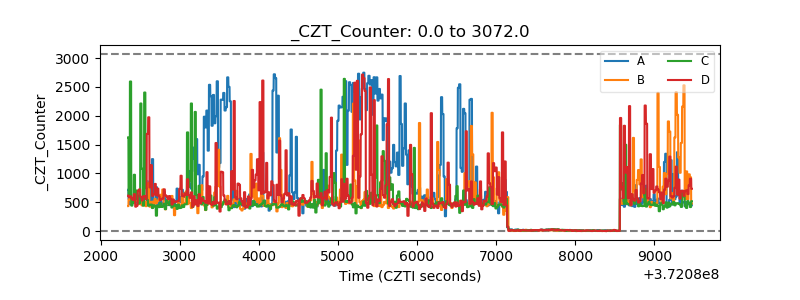 |
| +2.5 Volts monitor |  |
| +5 Volts monitor |  |
| _ROLL_ROT | 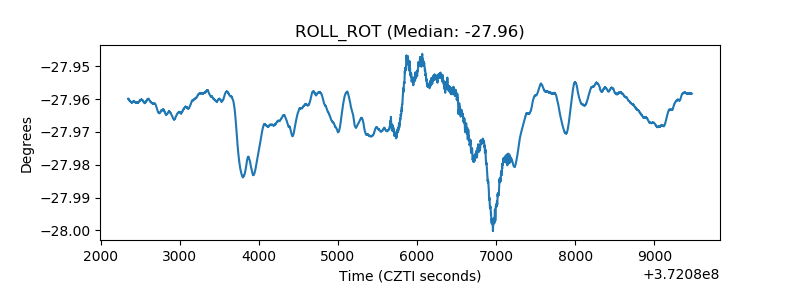 |
| _Roll_DEC | 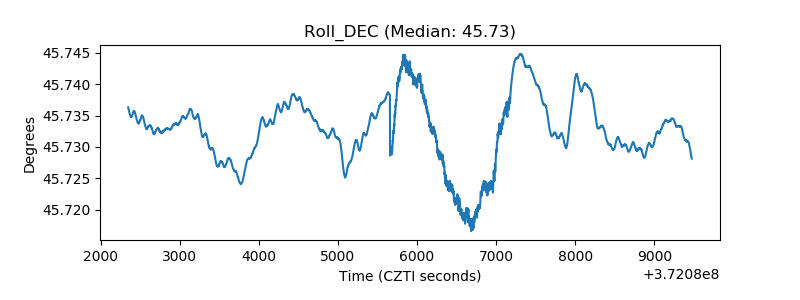 |
| _Roll_RA | 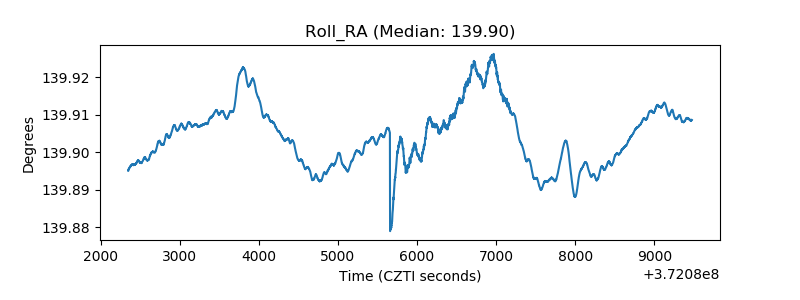 |
| Veto Counter | 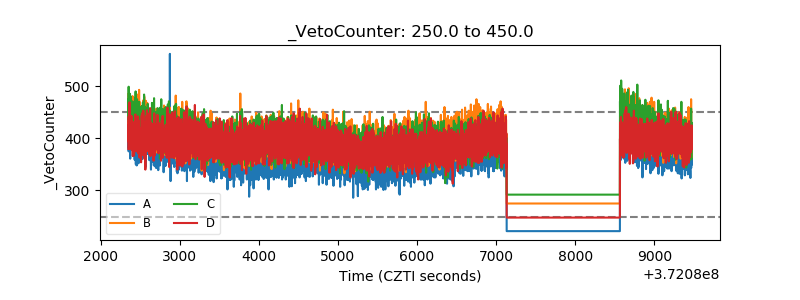 |