| Param | Original file | Final file |
|---|---|---|
| Filename | modeM0/AS1A10_123T04_9000004726_32719cztM0_level2.evt | modeM0/AS1A10_123T04_9000004726_32719cztM0_level2_quad_clean.evt |
| Size (bytes) | 499,737,600 | 61,410,240 |
| Size | 476.6 MB | 58.6 MB |
| Events in quadrant A | 3,277,763 | 368,935 |
| Events in quadrant B | 3,608,932 | 365,007 |
| Events in quadrant C | 3,037,363 | 367,088 |
| Events in quadrant D | 4,815,170 | 350,430 |
| Mode M0 | |||
|---|---|---|---|
| Quadrant | BADHDUFLAG | Total packets | Discarded packets |
| A | 0 | 13506 | 3 |
| B | 0 | 14493 | 2 |
| C | 0 | 12776 | 2 |
| D | 0 | 18516 | 2 |
| Mode M9 | |||
|---|---|---|---|
| Quadrant | BADHDUFLAG | Total packets | Discarded packets |
| A | 0 | 18 | 0 |
| B | 0 | 18 | 0 |
| C | 0 | 18 | 0 |
| D | 0 | 19 | 0 |
| Mode SS | |||
|---|---|---|---|
| Quadrant | BADHDUFLAG | Total packets | Discarded packets |
| A | 0 | 116 | 0 |
| B | 0 | 116 | 0 |
| C | 0 | 116 | 0 |
| D | 0 | 116 | 0 |
| Quadrant | Total seconds | Saturated seconds | Saturation percentage |
|---|---|---|---|
| A | 5843 | 61 | 1.043984% |
| B | 5843 | 210 | 3.594044% |
| C | 5843 | 45 | 0.770152% |
| D | 5843 | 183 | 3.131953% |
Noise dominated data is calculated using 1-second bins in cleaned event files. If a bin has >2000 counts, and if more than 50% of those come from <1% of pixels, then it is considered to be noise-dominated and hence unusable.
| Quadrant | # 1 sec bins | Bins with >0 counts | Bins with >2000 counts | High rate bins dominated by noise | Noise dominated (total time) | Noise dominated (detector-on time) | Marked lightcurve |
|---|---|---|---|---|---|---|---|
| A | 7155 | 5844 | 37 | 37 | 0.52% | 0.63% | 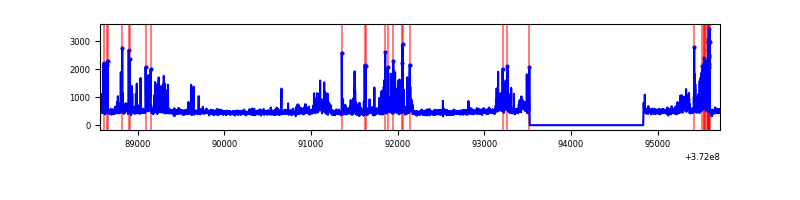 |
| B | 7155 | 5843 | 118 | 118 | 1.65% | 2.02% | 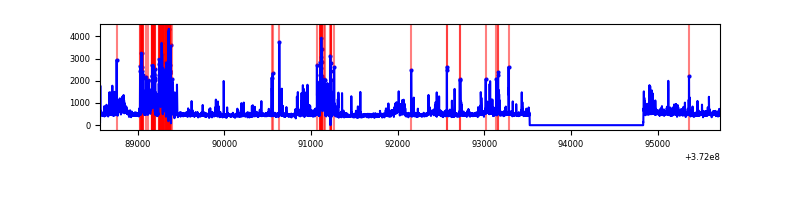 |
| C | 7155 | 5844 | 41 | 41 | 0.57% | 0.70% | 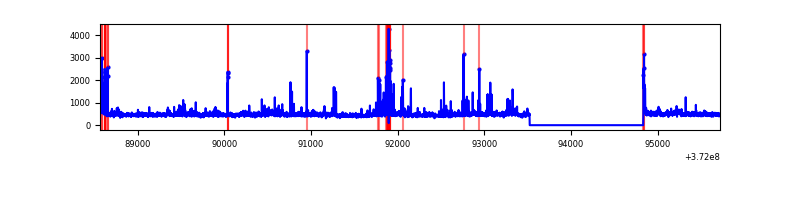 |
| D | 7155 | 5844 | 146 | 146 | 2.04% | 2.50% | 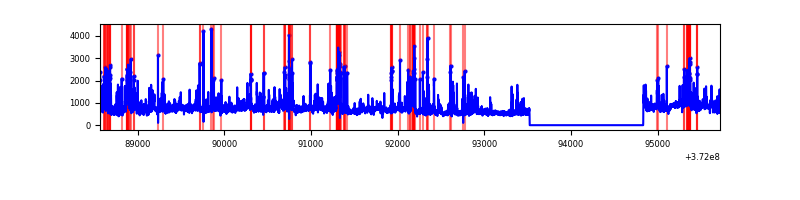 |
Top three noisy pixels from each quadrant. If the there are fewer than three noisy pixels in the level2.evt file, extra rows are filled as -1
| Pixel properties | Quadrant properties | ||||||
|---|---|---|---|---|---|---|---|
| Quadrant | DetID | PixID | Counts | Sigma | Mean | Median | Sigma |
| A | 15 | 249 | 587909 | 4315.75 | 680 | 667 | 136.1 |
| A | 15 | 237 | 32267 | 232.23 | 680 | 667 | 136.1 |
| A | 13 | 6 | 11546 | 79.95 | 680 | 667 | 136.1 |
| B | 4 | 251 | 559219 | 4328.33 | 678 | 663 | 129.0 |
| B | 0 | 219 | 91041 | 700.35 | 678 | 663 | 129.0 |
| B | 3 | 26 | 63260 | 485.07 | 678 | 663 | 129.0 |
| C | 0 | 10 | 137762 | 888.92 | 661 | 665 | 154.2 |
| C | 9 | 236 | 134848 | 870.03 | 661 | 665 | 154.2 |
| C | 3 | 233 | 92171 | 593.31 | 661 | 665 | 154.2 |
| D | 8 | 195 | 1044083 | 6615.58 | 654 | 639 | 157.7 |
| D | 2 | 250 | 630919 | 3996.06 | 654 | 639 | 157.7 |
| D | 7 | 80 | 141697 | 894.33 | 654 | 639 | 157.7 |
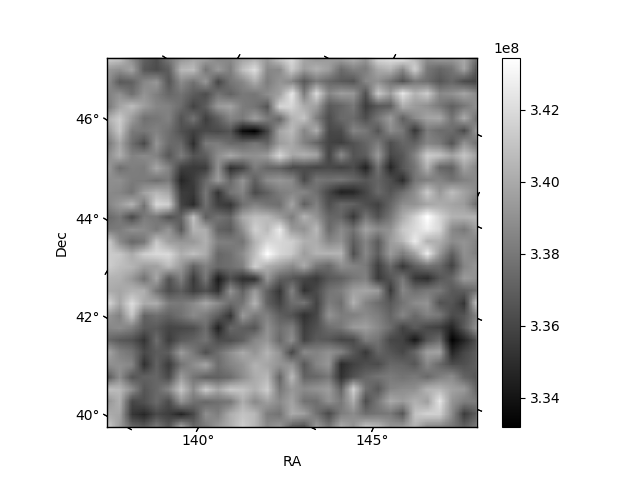
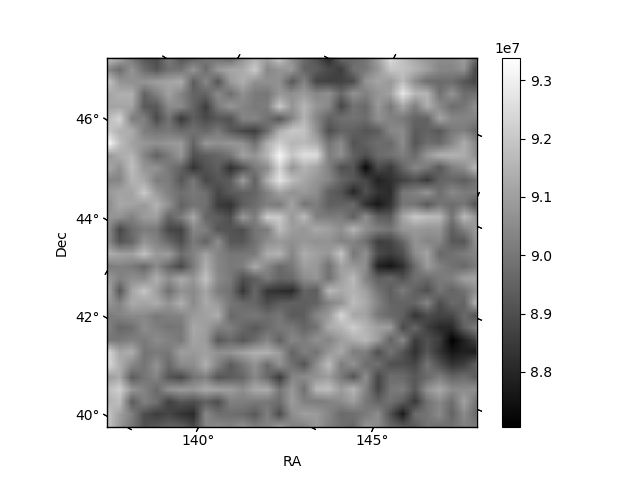
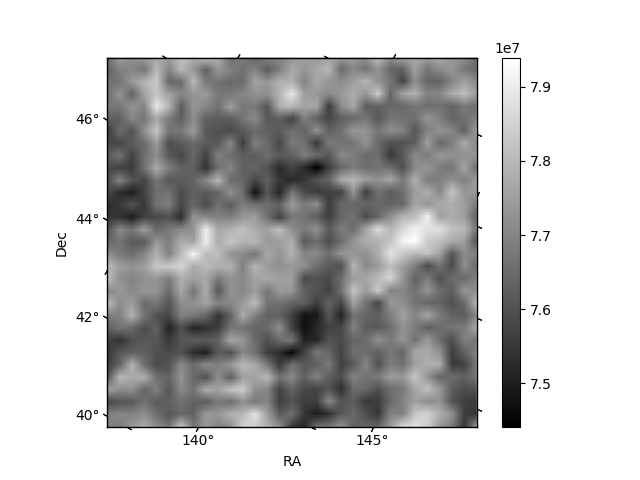
Histogram calculated using DETX and DETY for each event in the final _common_clean file
| Quadrant A | 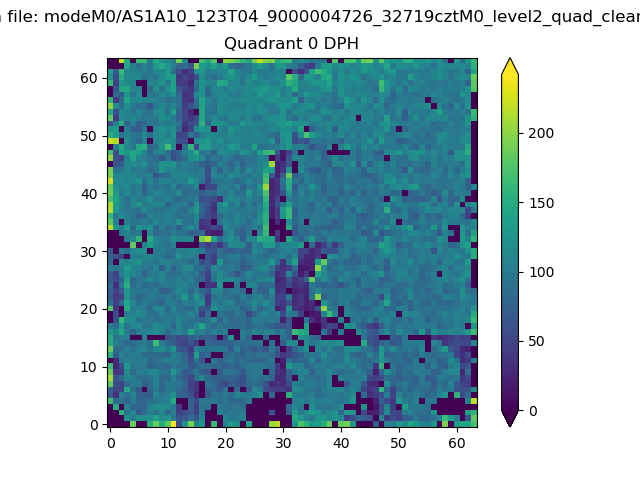 |
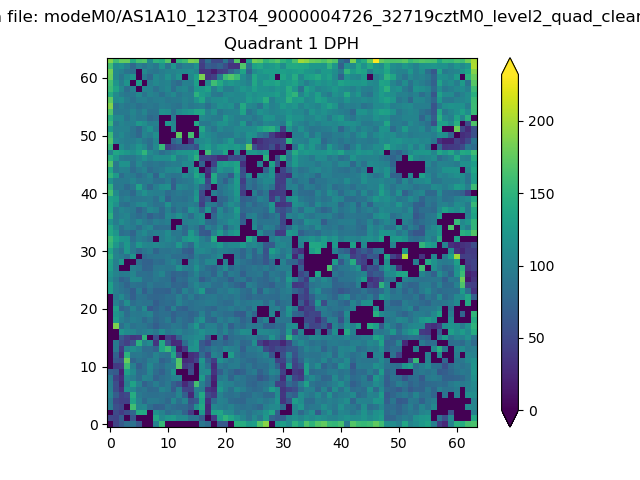 |
Quadrant B |
|---|---|---|---|
| Quadrant D | 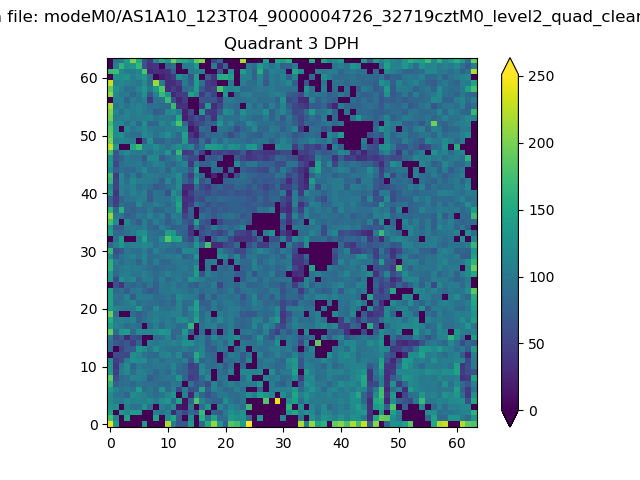 |
 |
Quadrant C |
| Plot type | Count rate plots | Images |
|---|---|---|
| Comparison with Poisson distribution Blue bars denote a histogram of data divided into 1 sec bins. Red curve is a Poisson curve with rate = median count rate of data. |
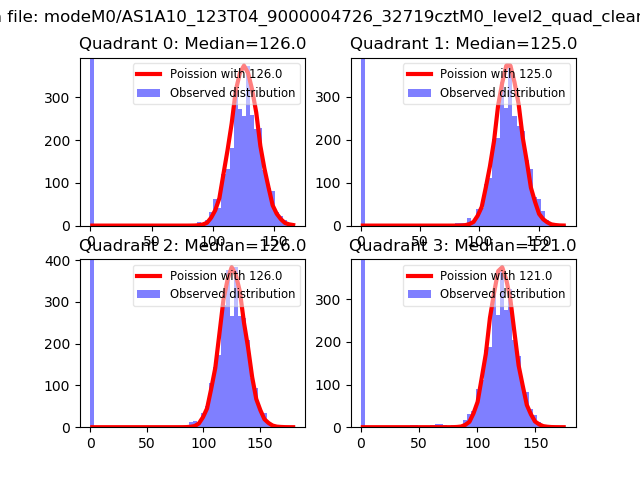 |
 |
| Quadrant-wise count rates Data is divided into 100 sec bins |
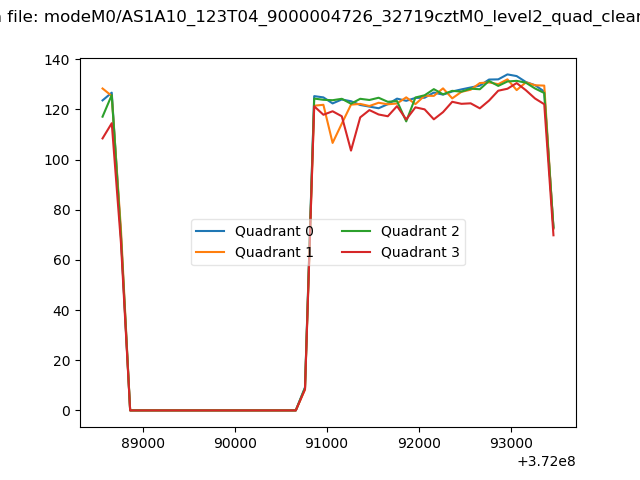 |
|
| Module-wise count rates for Quadrant A Data is divided into 100 sec bins |
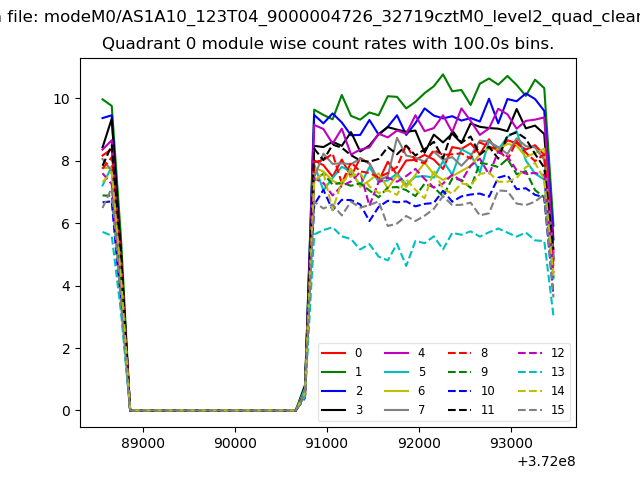 |
 |
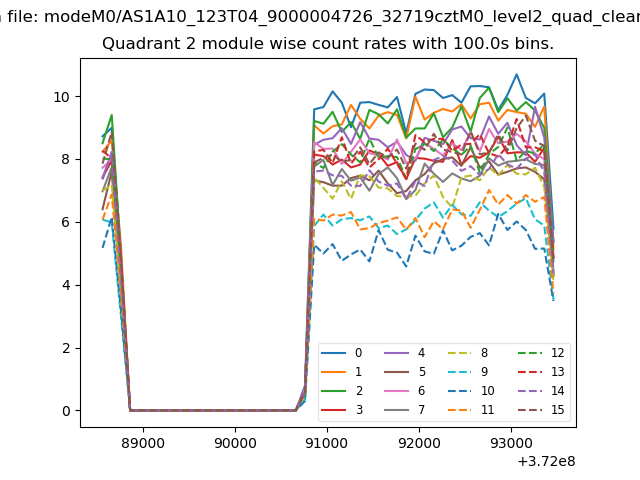
| Module-wise count rates for Quadrant B Data is divided into 100 sec bins |
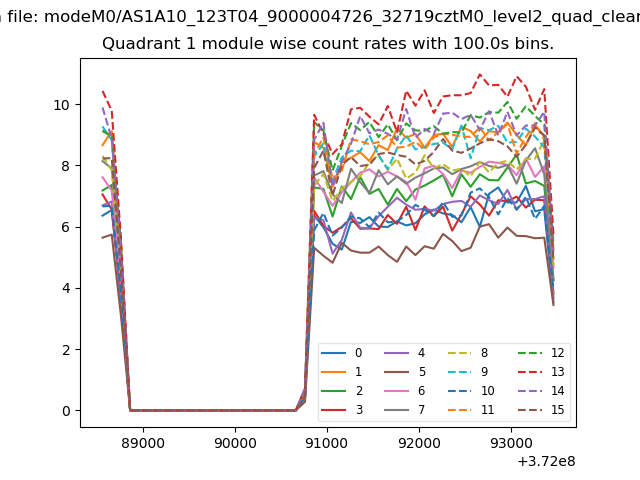 |
 |
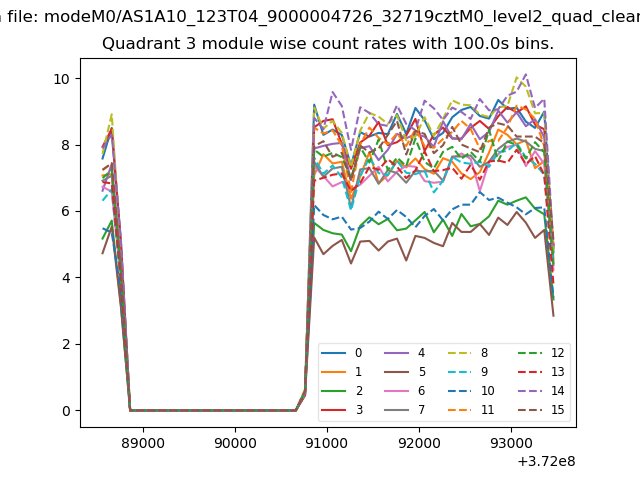
| Module-wise count rates for Quadrant C Data is divided into 100 sec bins |
 |
 |
| Module-wise count rates for Quadrant D Data is divided into 100 sec bins |
 |
 |
| Parameter | Plot |
|---|---|
| CZT HV Monitor | 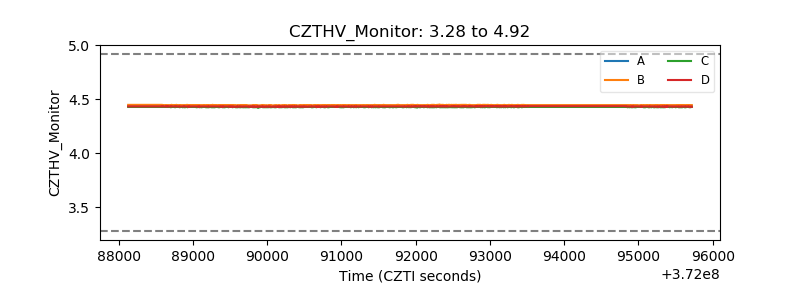 |
| D_VDD | 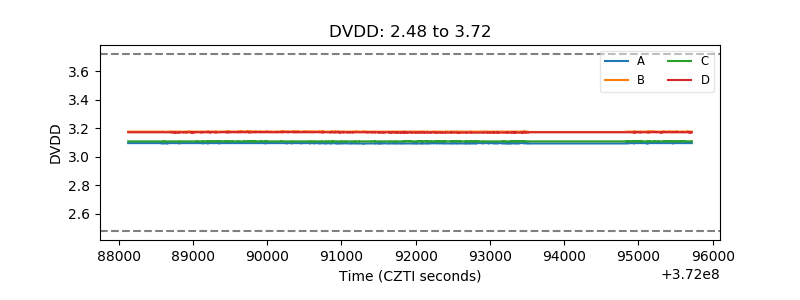 |
| Temperature 1 |  |
| Veto HV Monitor | 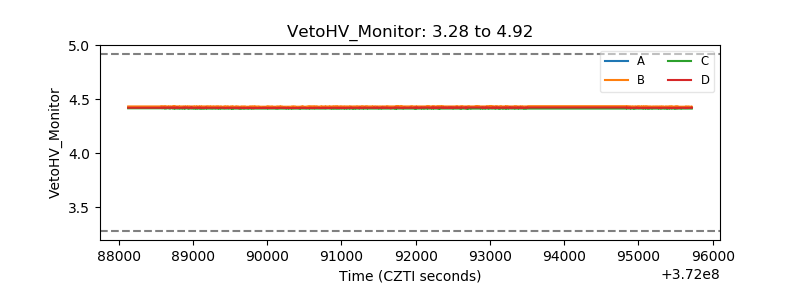 |
| Veto LLD | 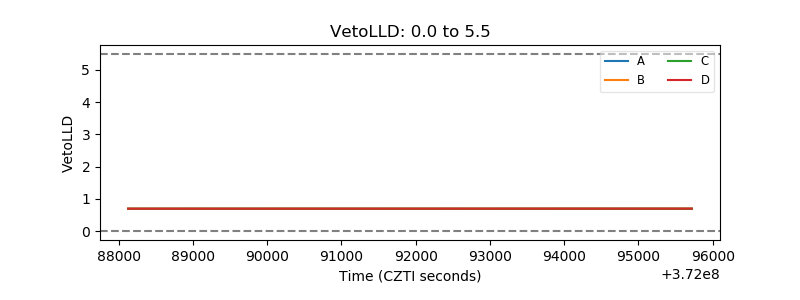 |
| Alpha Counter | 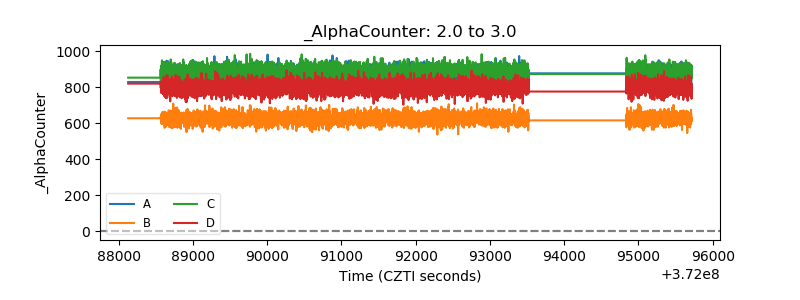 |
| _CPM_Rate | 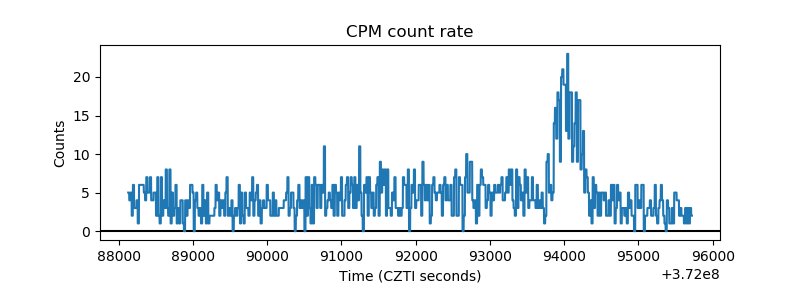 |
| CZT Counter | 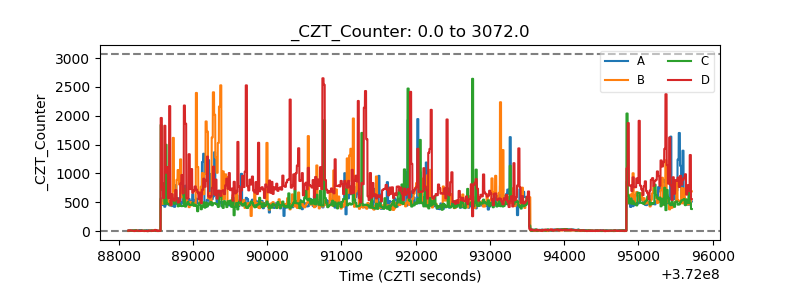 |
| +2.5 Volts monitor |  |
| +5 Volts monitor |  |
| _ROLL_ROT | 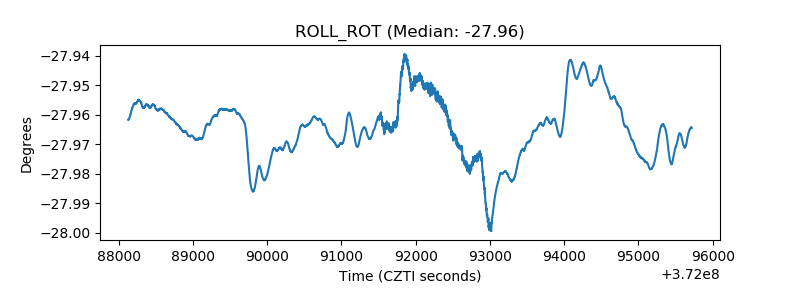 |
| _Roll_DEC | 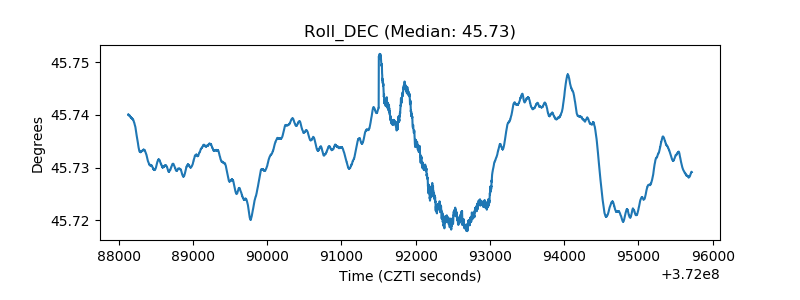 |
| _Roll_RA | 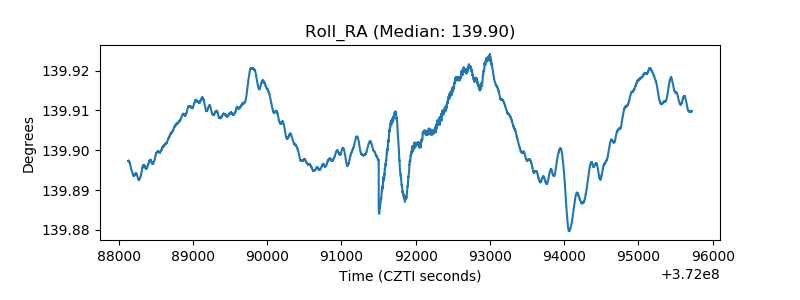 |
| Veto Counter | 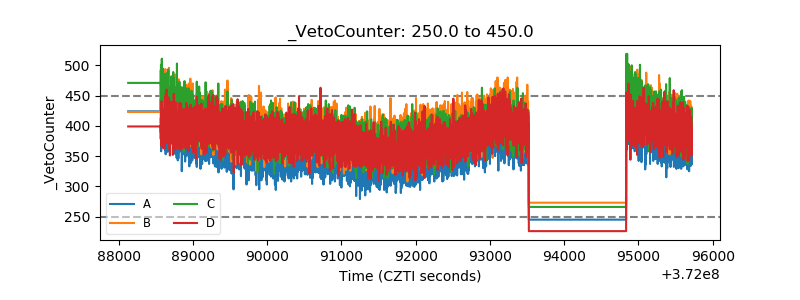 |