| Param | Original file | Final file |
|---|---|---|
| Filename | modeM0/AS1A10_123T04_9000004726_32722cztM0_level2.evt | modeM0/AS1A10_123T04_9000004726_32722cztM0_level2_quad_clean.evt |
| Size (bytes) | 173,427,840 | 47,116,800 |
| Size | 165.4 MB | 44.9 MB |
| Events in quadrant A | 1,113,549 | 317,125 |
| Events in quadrant B | 1,182,221 | 310,251 |
| Events in quadrant C | 1,315,703 | 315,149 |
| Events in quadrant D | 1,465,477 | 301,499 |
| Mode M0 | |||
|---|---|---|---|
| Quadrant | BADHDUFLAG | Total packets | Discarded packets |
| A | 0 | 6004 | 856 |
| B | 0 | 6459 | 1221 |
| C | 0 | 6624 | 902 |
| D | 0 | 7342 | 1309 |
| Mode M9 | |||
|---|---|---|---|
| Quadrant | BADHDUFLAG | Total packets | Discarded packets |
| A | 0 | 10 | 9 |
| B | 0 | 11 | 10 |
| C | 0 | 10 | 10 |
| D | 0 | 8 | 7 |
| Mode SS | |||
|---|---|---|---|
| Quadrant | BADHDUFLAG | Total packets | Discarded packets |
| A | 0 | 62 | 10 |
| B | 0 | 62 | 10 |
| C | 0 | 62 | 10 |
| D | 0 | 62 | 8 |
| Quadrant | Total seconds | Saturated seconds | Saturation percentage |
|---|---|---|---|
| A | 2554 | 0 | 0.000000% |
| B | 2519 | 4 | 0.158793% |
| C | 2556 | 17 | 0.665102% |
| D | 2526 | 51 | 2.019002% |
Noise dominated data is calculated using 1-second bins in cleaned event files. If a bin has >2000 counts, and if more than 50% of those come from <1% of pixels, then it is considered to be noise-dominated and hence unusable.
| Quadrant | # 1 sec bins | Bins with >0 counts | Bins with >2000 counts | High rate bins dominated by noise | Noise dominated (total time) | Noise dominated (detector-on time) | Marked lightcurve |
|---|---|---|---|---|---|---|---|
| A | 2981 | 2645 | 0 | 0 | 0.00% | 0.00% |  |
| B | 2982 | 2612 | 3 | 3 | 0.10% | 0.11% |  |
| C | 2983 | 2654 | 17 | 17 | 0.57% | 0.64% |  |
| D | 2976 | 2600 | 50 | 50 | 1.68% | 1.92% |  |
Top three noisy pixels from each quadrant. If the there are fewer than three noisy pixels in the level2.evt file, extra rows are filled as -1
| Pixel properties | Quadrant properties | ||||||
|---|---|---|---|---|---|---|---|
| Quadrant | DetID | PixID | Counts | Sigma | Mean | Median | Sigma |
| A | 15 | 249 | 12510 | 208.82 | 281 | 275 | 58.6 |
| A | 15 | 237 | 8700 | 143.79 | 281 | 275 | 58.6 |
| A | 13 | 254 | 4944 | 79.69 | 281 | 275 | 58.6 |
| B | 8 | 128 | 16502 | 296.04 | 279 | 272 | 54.8 |
| B | 3 | 32 | 13556 | 242.3 | 279 | 272 | 54.8 |
| B | 15 | 36 | 11461 | 204.09 | 279 | 272 | 54.8 |
| C | 9 | 236 | 156330 | 2413.17 | 271 | 273 | 64.7 |
| C | 15 | 208 | 51897 | 798.28 | 271 | 273 | 64.7 |
| C | 0 | 10 | 21573 | 329.37 | 271 | 273 | 64.7 |
| D | 2 | 250 | 163344 | 2492.68 | 264 | 258 | 65.4 |
| D | 7 | 80 | 80029 | 1219.26 | 264 | 258 | 65.4 |
| D | 12 | 218 | 49580 | 753.86 | 264 | 258 | 65.4 |
Histogram calculated using DETX and DETY for each event in the final _common_clean file
| Quadrant A |  |
 |
Quadrant B |
|---|---|---|---|
| Quadrant D |  |
 |
Quadrant C |
| Plot type | Count rate plots | Images |
|---|---|---|
| Comparison with Poisson distribution Blue bars denote a histogram of data divided into 1 sec bins. Red curve is a Poisson curve with rate = median count rate of data. |
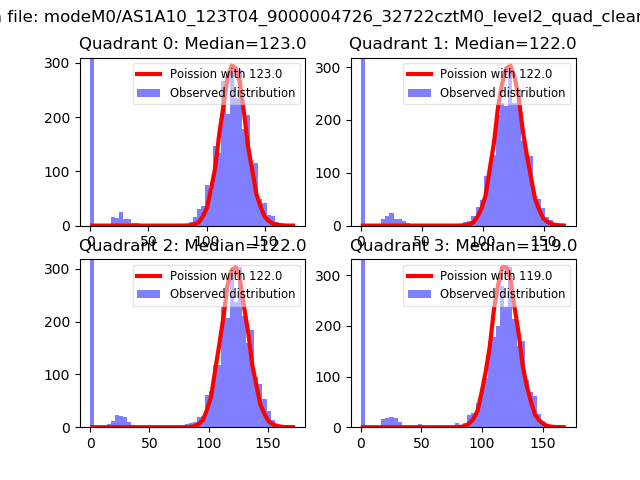 |
 |
| Quadrant-wise count rates Data is divided into 100 sec bins |
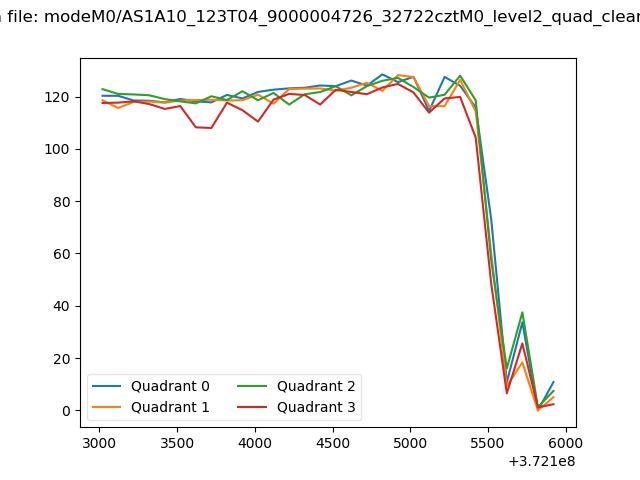 |
|
| Module-wise count rates for Quadrant A Data is divided into 100 sec bins |
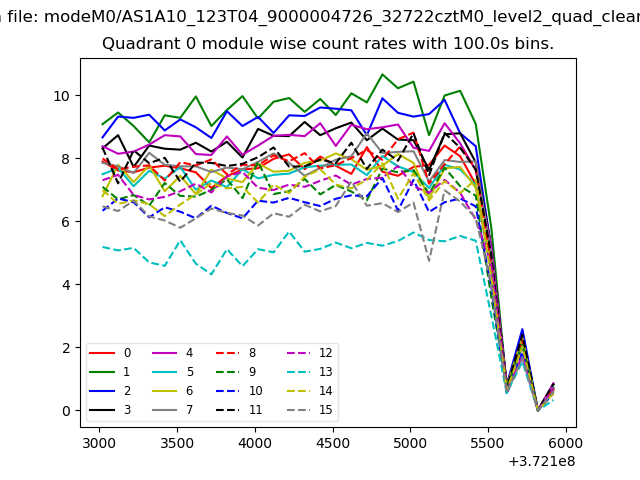 |
 |
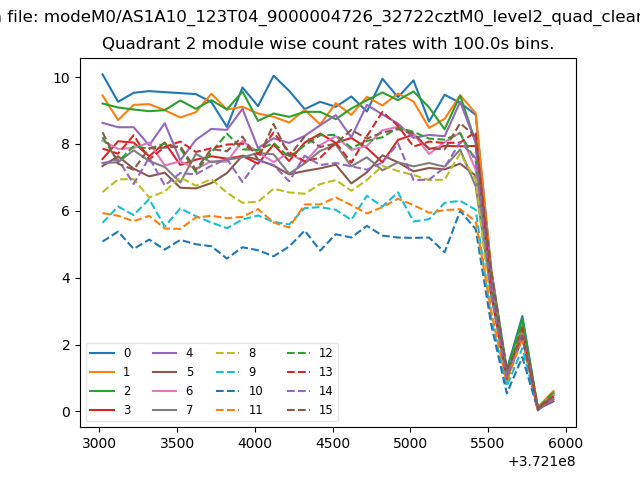
| Module-wise count rates for Quadrant B Data is divided into 100 sec bins |
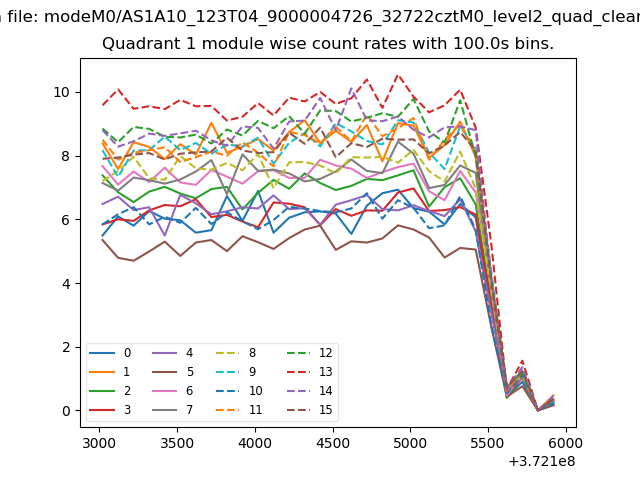 |
 |
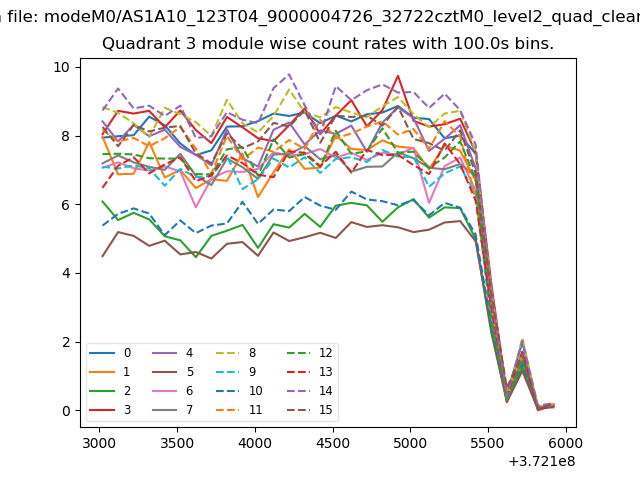
| Module-wise count rates for Quadrant C Data is divided into 100 sec bins |
 |
 |
| Module-wise count rates for Quadrant D Data is divided into 100 sec bins |
 |
 |
| Parameter | Plot |
|---|---|
| CZT HV Monitor | 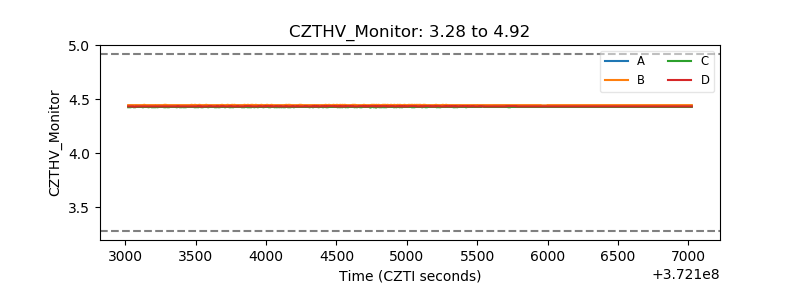 |
| D_VDD |  |
| Temperature 1 |  |
| Veto HV Monitor |  |
| Veto LLD |  |
| Alpha Counter | 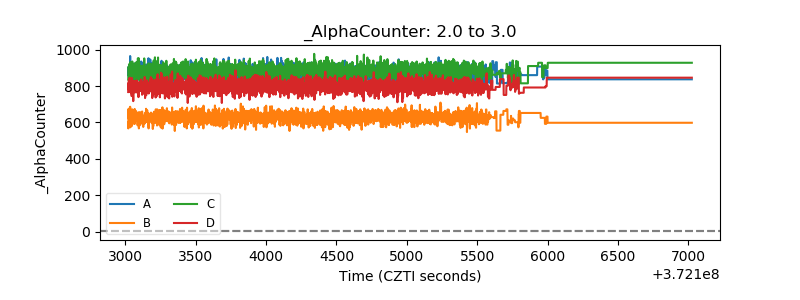 |
| _CPM_Rate | 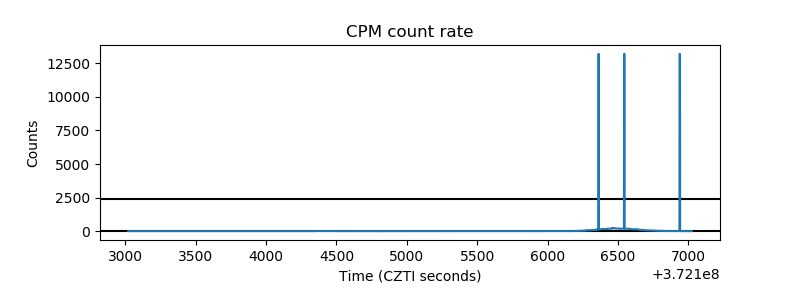 |
| CZT Counter |  |
| +2.5 Volts monitor |  |
| +5 Volts monitor |  |
| _ROLL_ROT | 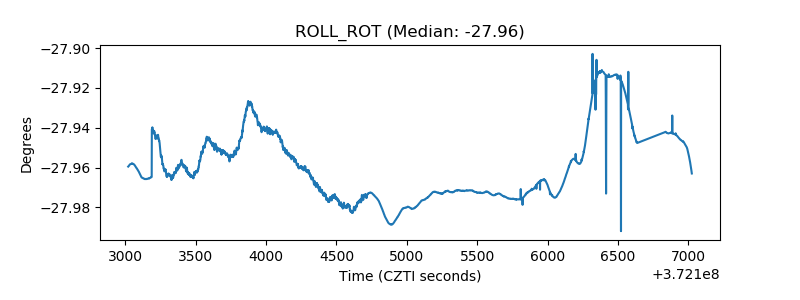 |
| _Roll_DEC |  |
| _Roll_RA |  |
| Veto Counter | 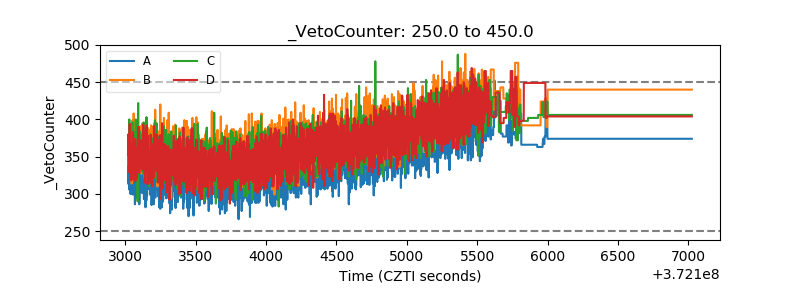 |