| Param | Original file | Final file |
|---|---|---|
| Filename | modeM0/AS1A10_123T04_9000004726_32723cztM0_level2.evt | modeM0/AS1A10_123T04_9000004726_32723cztM0_level2_quad_clean.evt |
| Size (bytes) | 908,288,640 | 99,213,120 |
| Size | 866.2 MB | 94.6 MB |
| Events in quadrant A | 4,344,440 | 745,619 |
| Events in quadrant B | 14,266,547 | 327,197 |
| Events in quadrant C | 3,854,737 | 747,379 |
| Events in quadrant D | 4,589,641 | 715,119 |
| Mode M0 | |||
|---|---|---|---|
| Quadrant | BADHDUFLAG | Total packets | Discarded packets |
| A | 0 | 19249 | 1587 |
| B | 0 | 51309 | 4435 |
| C | 0 | 18115 | 2138 |
| D | 0 | 20625 | 2461 |
| Mode M9 | |||
|---|---|---|---|
| Quadrant | BADHDUFLAG | Total packets | Discarded packets |
| A | 0 | 30 | 10 |
| B | 0 | 30 | 9 |
| C | 0 | 31 | 11 |
| D | 0 | 31 | 13 |
| Mode SS | |||
|---|---|---|---|
| Quadrant | BADHDUFLAG | Total packets | Discarded packets |
| A | 0 | 152 | 12 |
| B | 0 | 152 | 18 |
| C | 0 | 152 | 18 |
| D | 0 | 152 | 14 |
| Quadrant | Total seconds | Saturated seconds | Saturation percentage |
|---|---|---|---|
| A | 6792 | 278 | 4.093051% |
| B | 6570 | 5099 | 77.610350% |
| C | 6735 | 122 | 1.811433% |
| D | 6668 | 192 | 2.879424% |
Noise dominated data is calculated using 1-second bins in cleaned event files. If a bin has >2000 counts, and if more than 50% of those come from <1% of pixels, then it is considered to be noise-dominated and hence unusable.
| Quadrant | # 1 sec bins | Bins with >0 counts | Bins with >2000 counts | High rate bins dominated by noise | Noise dominated (total time) | Noise dominated (detector-on time) | Marked lightcurve |
|---|---|---|---|---|---|---|---|
| A | 10511 | 7032 | 130 | 130 | 1.24% | 1.85% | 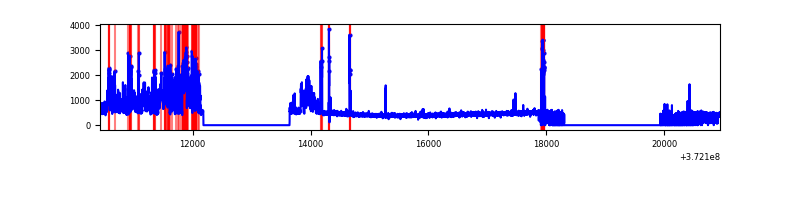 |
| B | 10513 | 6749 | 4421 | 4421 | 42.05% | 65.51% | 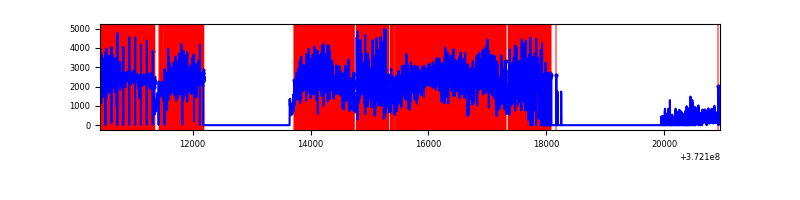 |
| C | 10513 | 6963 | 86 | 86 | 0.82% | 1.24% |  |
| D | 10513 | 6885 | 167 | 167 | 1.59% | 2.43% | 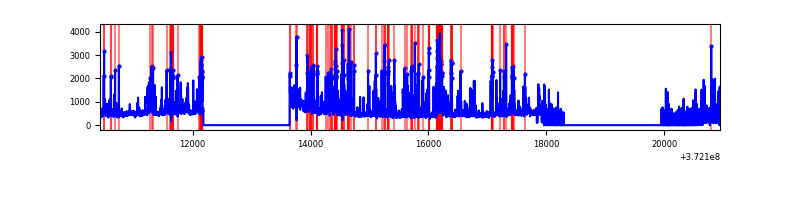 |
Top three noisy pixels from each quadrant. If the there are fewer than three noisy pixels in the level2.evt file, extra rows are filled as -1
| Pixel properties | Quadrant properties | ||||||
|---|---|---|---|---|---|---|---|
| Quadrant | DetID | PixID | Counts | Sigma | Mean | Median | Sigma |
| A | 15 | 249 | 1196223 | 7667.67 | 777 | 762 | 155.9 |
| A | 15 | 237 | 125177 | 797.99 | 777 | 762 | 155.9 |
| A | 13 | 254 | 12675 | 76.41 | 777 | 762 | 155.9 |
| B | 12 | 1 | 12167188 | 166321.66 | 383 | 376 | 73.2 |
| B | 4 | 206 | 345302 | 4715.18 | 383 | 376 | 73.2 |
| B | 0 | 197 | 59752 | 811.68 | 383 | 376 | 73.2 |
| C | 9 | 236 | 353294 | 2029.01 | 751 | 758 | 173.7 |
| C | 0 | 239 | 329710 | 1893.27 | 751 | 758 | 173.7 |
| C | 15 | 208 | 101274 | 578.52 | 751 | 758 | 173.7 |
| D | 2 | 250 | 671776 | 3832.49 | 736 | 722 | 175.1 |
| D | 8 | 195 | 220921 | 1257.59 | 736 | 722 | 175.1 |
| D | 7 | 80 | 172689 | 982.13 | 736 | 722 | 175.1 |
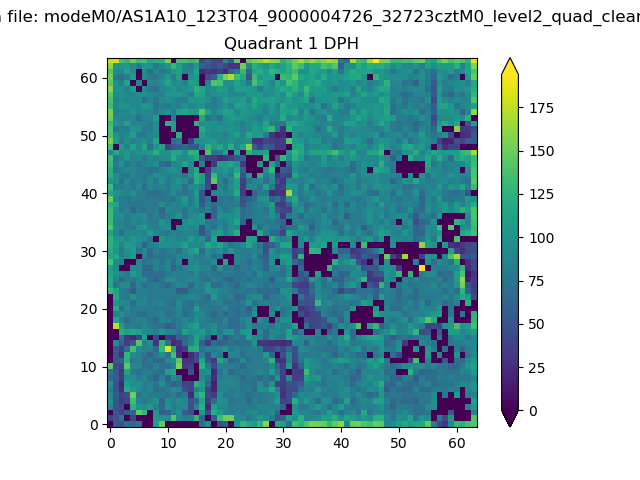
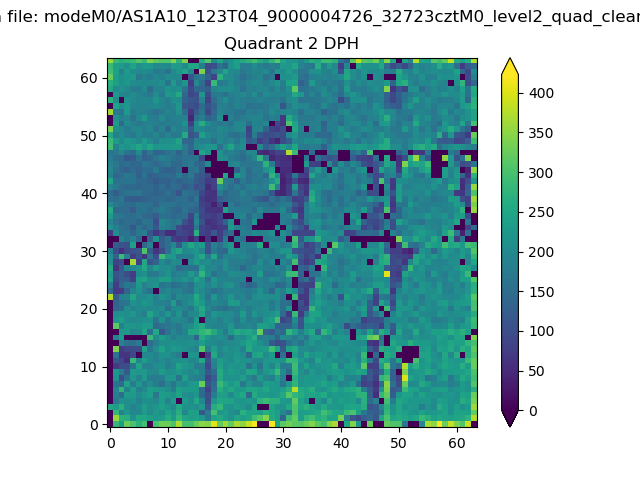
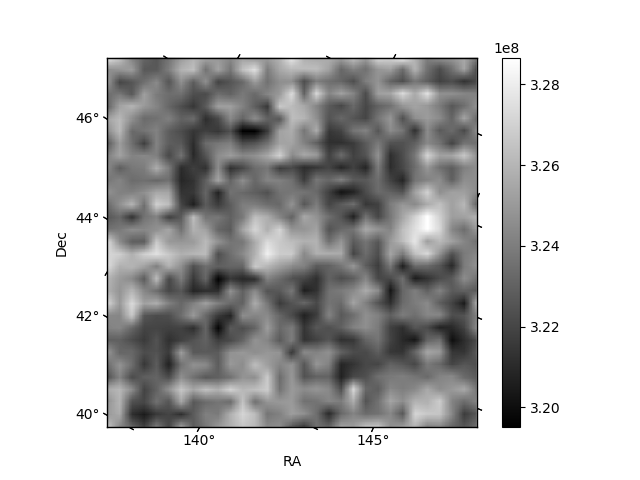
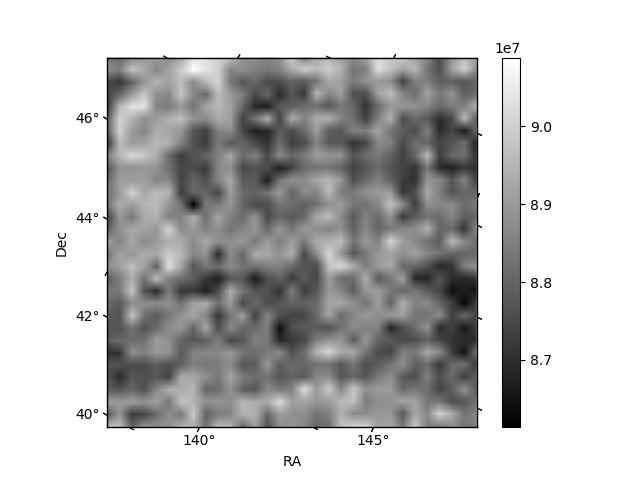
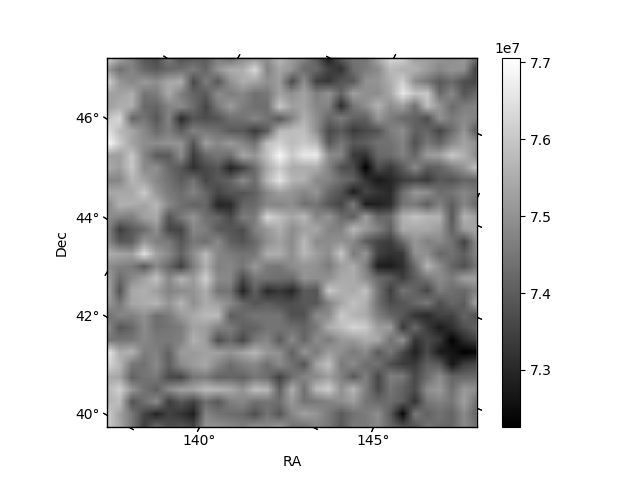
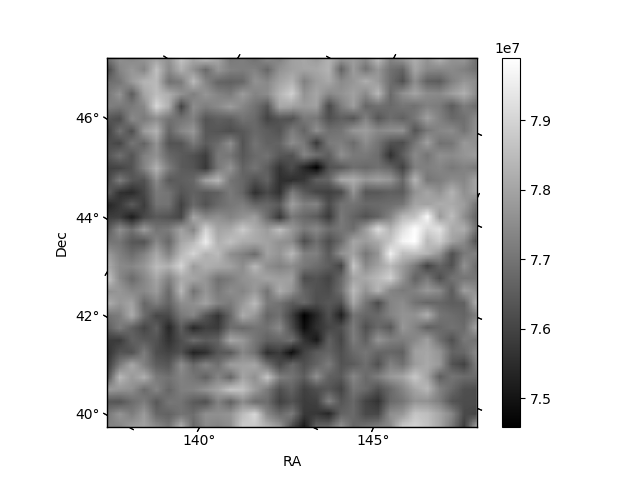
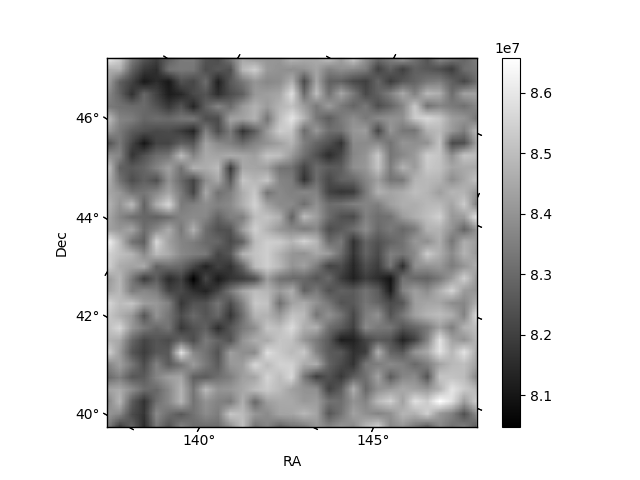
Histogram calculated using DETX and DETY for each event in the final _common_clean file
| Quadrant A | 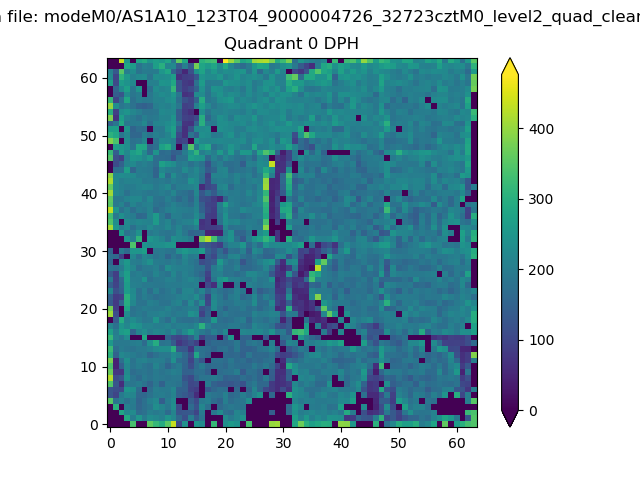 |
 |
Quadrant B |
|---|---|---|---|
| Quadrant D | 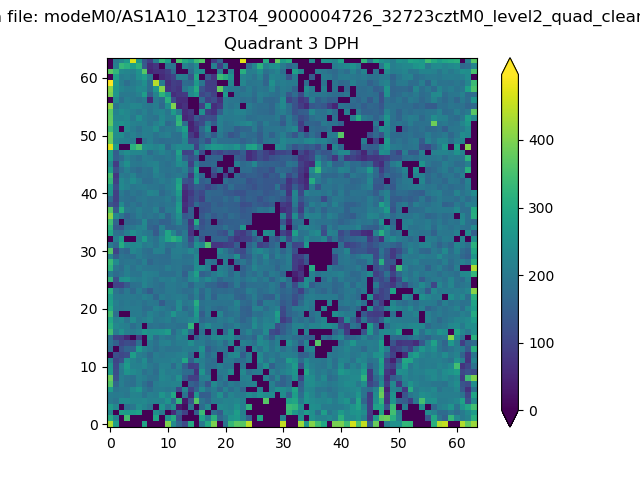 |
 |
Quadrant C |
| Plot type | Count rate plots | Images |
|---|---|---|
| Comparison with Poisson distribution Blue bars denote a histogram of data divided into 1 sec bins. Red curve is a Poisson curve with rate = median count rate of data. |
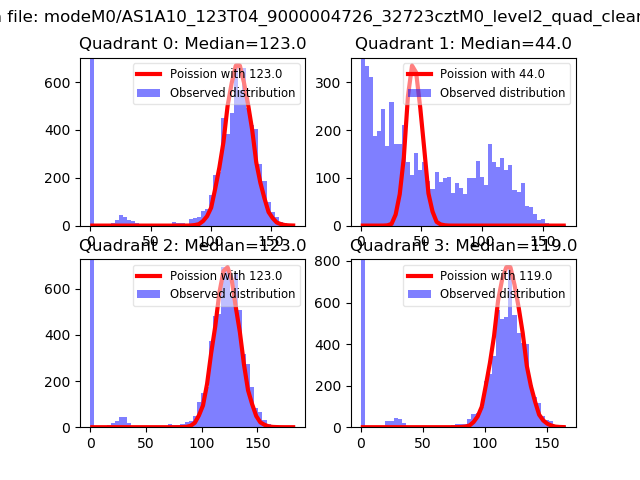 |
 |
| Quadrant-wise count rates Data is divided into 100 sec bins |
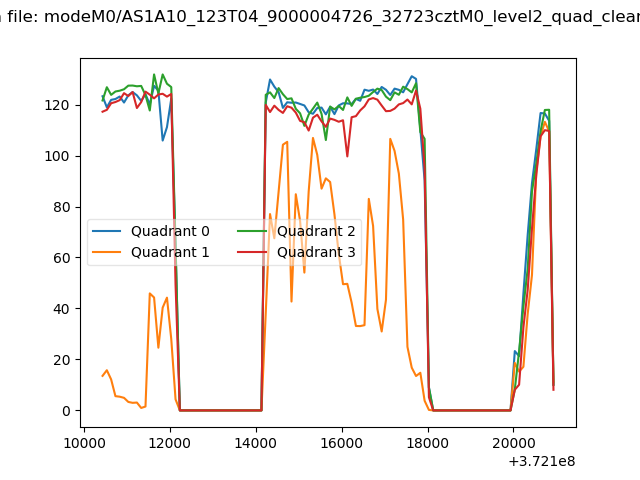 |
|
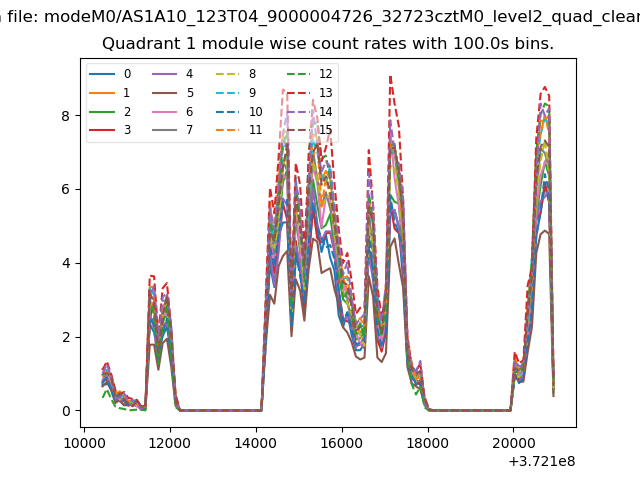
| Module-wise count rates for Quadrant A Data is divided into 100 sec bins |
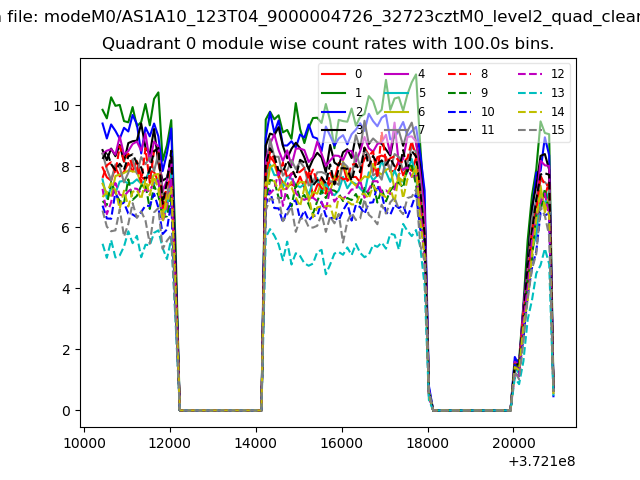 |
 |
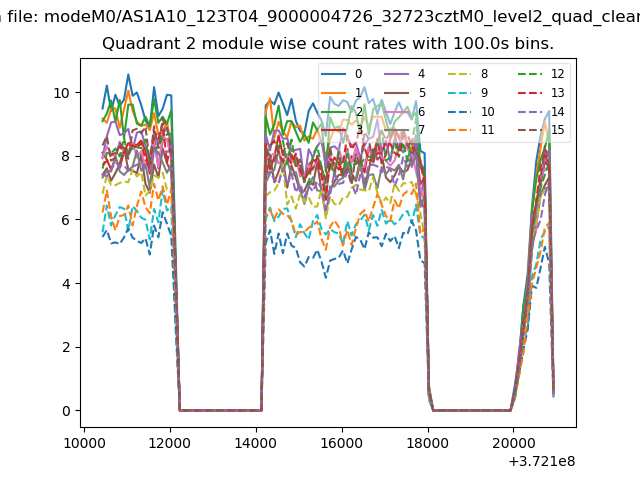
| Module-wise count rates for Quadrant B Data is divided into 100 sec bins |
 |
 |
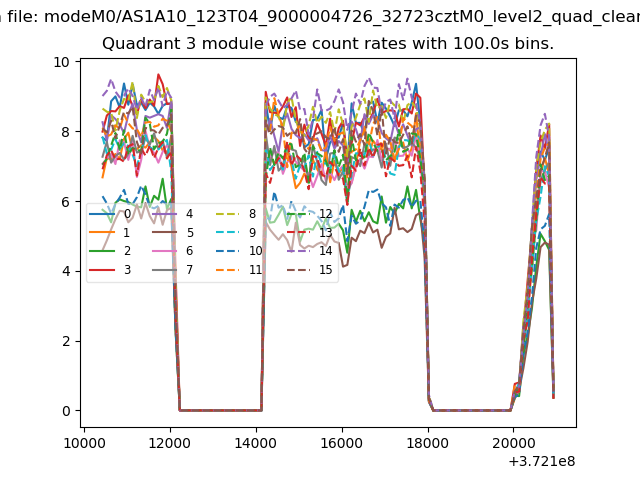
| Module-wise count rates for Quadrant C Data is divided into 100 sec bins |
 |
 |
| Module-wise count rates for Quadrant D Data is divided into 100 sec bins |
 |
 |
| Parameter | Plot |
|---|---|
| CZT HV Monitor | 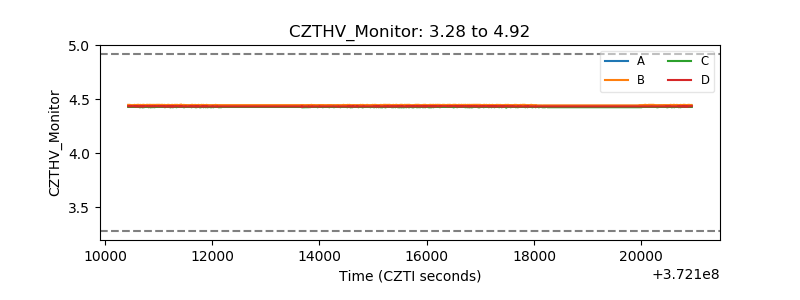 |
| D_VDD | 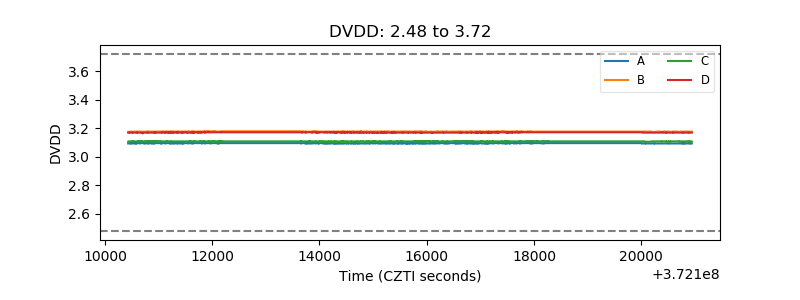 |
| Temperature 1 | 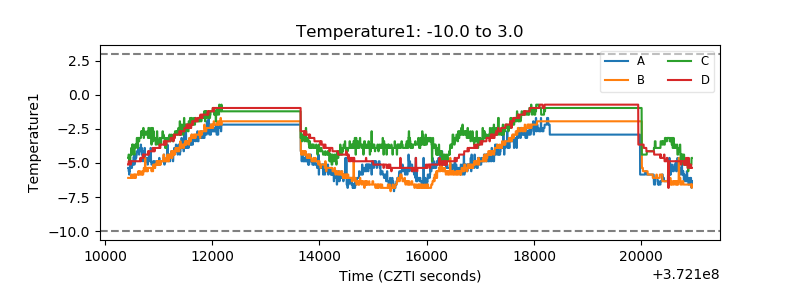 |
| Veto HV Monitor |  |
| Veto LLD | 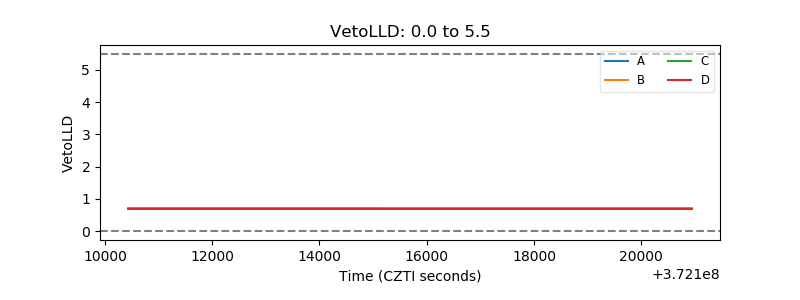 |
| Alpha Counter | 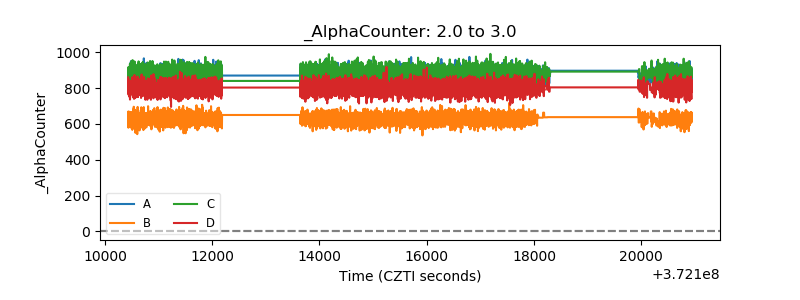 |
| _CPM_Rate | 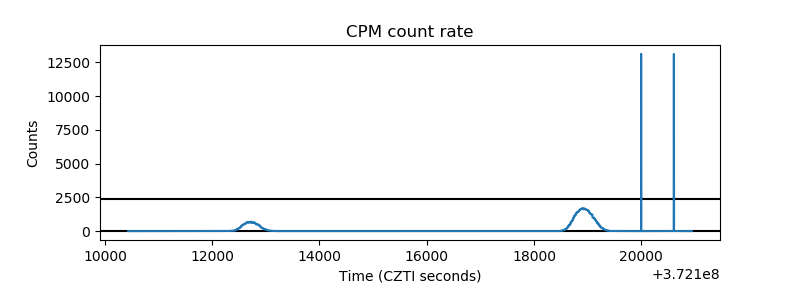 |
| CZT Counter | 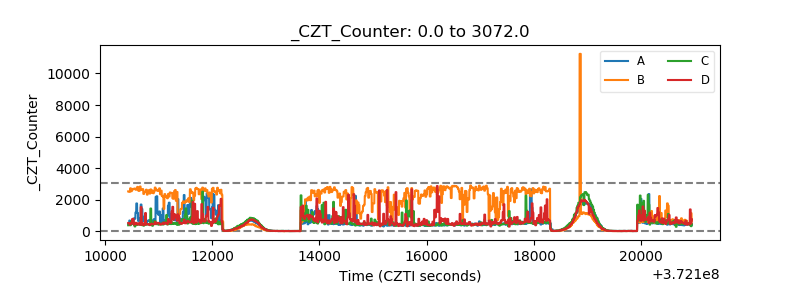 |
| +2.5 Volts monitor |  |
| +5 Volts monitor | 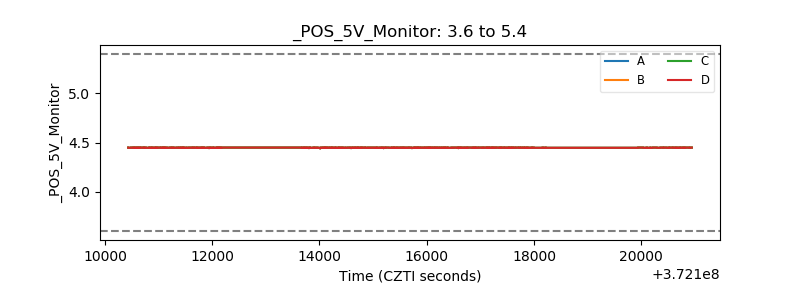 |
| _ROLL_ROT | 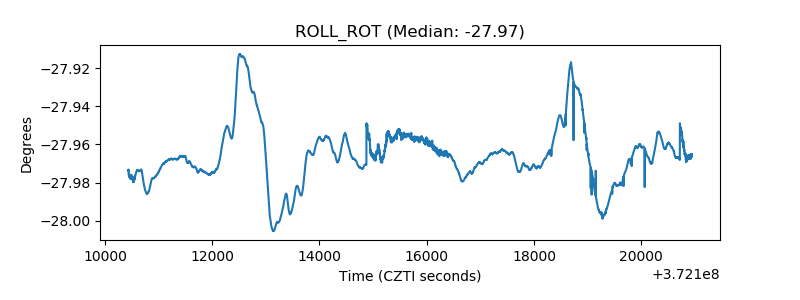 |
| _Roll_DEC | 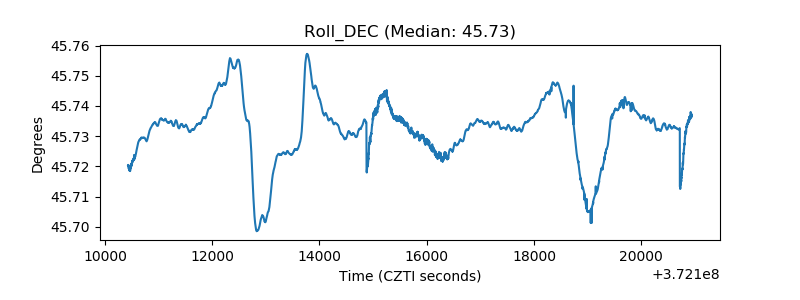 |
| _Roll_RA | 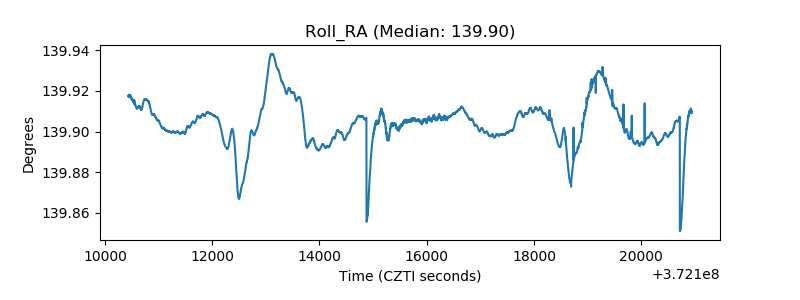 |
| Veto Counter | 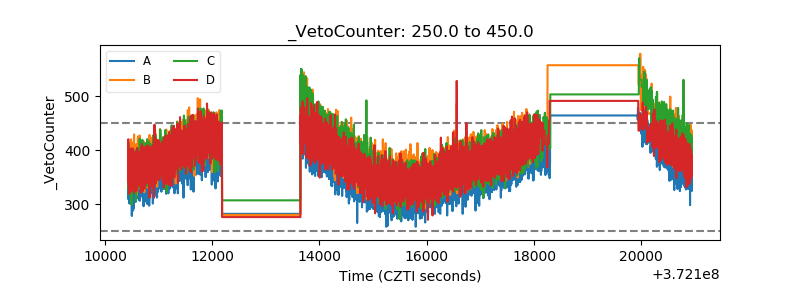 |