| Param | Original file | Final file |
|---|---|---|
| Filename | modeM0/AS1A10_123T04_9000004726_32726cztM0_level2.evt | modeM0/AS1A10_123T04_9000004726_32726cztM0_level2_quad_clean.evt |
| Size (bytes) | 1,133,847,360 | 171,630,720 |
| Size | 1.1 GB | 163.7 MB |
| Events in quadrant A | 6,507,995 | 1,088,452 |
| Events in quadrant B | 10,036,206 | 1,089,098 |
| Events in quadrant C | 6,495,977 | 1,107,907 |
| Events in quadrant D | 10,440,109 | 1,033,688 |
| Mode M0 | |||
|---|---|---|---|
| Quadrant | BADHDUFLAG | Total packets | Discarded packets |
| A | 0 | 27714 | 6 |
| B | 0 | 38229 | 4 |
| C | 0 | 27667 | 4 |
| D | 0 | 39901 | 4 |
| Mode M9 | |||
|---|---|---|---|
| Quadrant | BADHDUFLAG | Total packets | Discarded packets |
| A | 0 | 42 | 0 |
| B | 0 | 42 | 0 |
| C | 0 | 42 | 0 |
| D | 0 | 42 | 0 |
| Mode SS | |||
|---|---|---|---|
| Quadrant | BADHDUFLAG | Total packets | Discarded packets |
| A | 0 | 256 | 0 |
| B | 0 | 256 | 0 |
| C | 0 | 256 | 0 |
| D | 0 | 256 | 0 |
| Quadrant | Total seconds | Saturated seconds | Saturation percentage |
|---|---|---|---|
| A | 12720 | 233 | 1.831761% |
| B | 12720 | 1711 | 13.451258% |
| C | 12720 | 95 | 0.746855% |
| D | 12720 | 805 | 6.328616% |
Noise dominated data is calculated using 1-second bins in cleaned event files. If a bin has >2000 counts, and if more than 50% of those come from <1% of pixels, then it is considered to be noise-dominated and hence unusable.
| Quadrant | # 1 sec bins | Bins with >0 counts | Bins with >2000 counts | High rate bins dominated by noise | Noise dominated (total time) | Noise dominated (detector-on time) | Marked lightcurve |
|---|---|---|---|---|---|---|---|
| A | 38478 | 12723 | 156 | 156 | 0.41% | 1.23% | 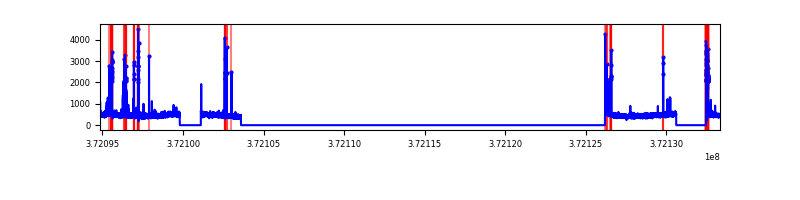 |
| B | 38478 | 12722 | 927 | 927 | 2.41% | 7.29% | 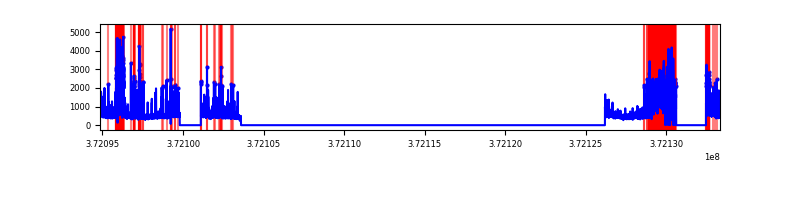 |
| C | 38478 | 12723 | 86 | 86 | 0.22% | 0.68% | 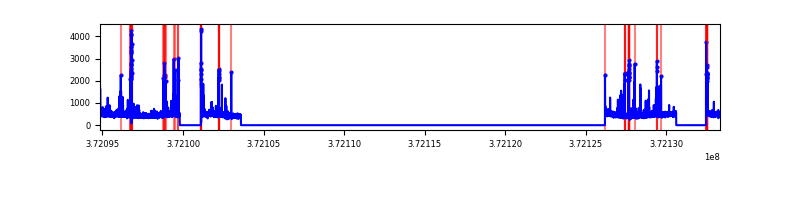 |
| D | 38478 | 12723 | 668 | 668 | 1.74% | 5.25% | 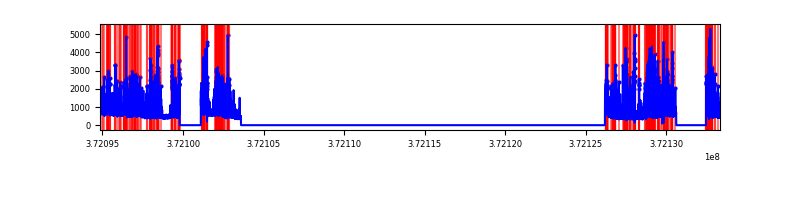 |
Top three noisy pixels from each quadrant. If the there are fewer than three noisy pixels in the level2.evt file, extra rows are filled as -1
| Pixel properties | Quadrant properties | ||||||
|---|---|---|---|---|---|---|---|
| Quadrant | DetID | PixID | Counts | Sigma | Mean | Median | Sigma |
| A | 15 | 249 | 653417 | 2225.59 | 1465 | 1438 | 292.9 |
| A | 15 | 237 | 140207 | 473.7 | 1465 | 1438 | 292.9 |
| A | 13 | 254 | 24222 | 77.78 | 1465 | 1438 | 292.9 |
| B | 12 | 1 | 2633734 | 10367.58 | 1360 | 1328 | 253.9 |
| B | 4 | 206 | 920475 | 3620.01 | 1360 | 1328 | 253.9 |
| B | 3 | 26 | 269933 | 1057.89 | 1360 | 1328 | 253.9 |
| C | 9 | 236 | 256271 | 770.86 | 1441 | 1453 | 330.6 |
| C | 15 | 208 | 218480 | 656.54 | 1441 | 1453 | 330.6 |
| C | 0 | 10 | 147605 | 442.13 | 1441 | 1453 | 330.6 |
| D | 2 | 250 | 1022558 | 3043.98 | 1403 | 1372 | 335.5 |
| D | 7 | 80 | 748462 | 2226.95 | 1403 | 1372 | 335.5 |
| D | 8 | 195 | 539138 | 1602.99 | 1403 | 1372 | 335.5 |
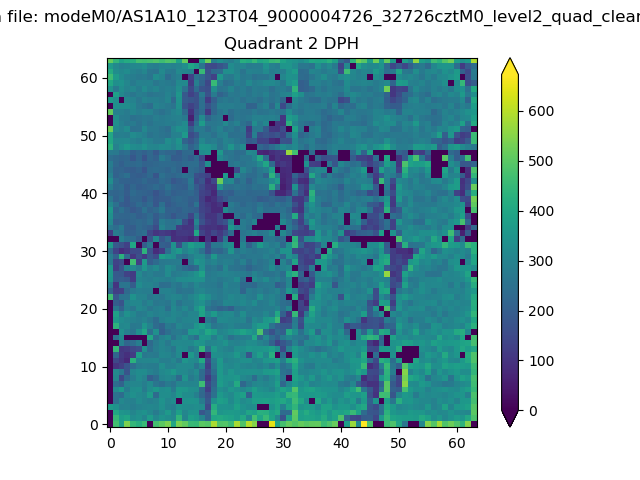
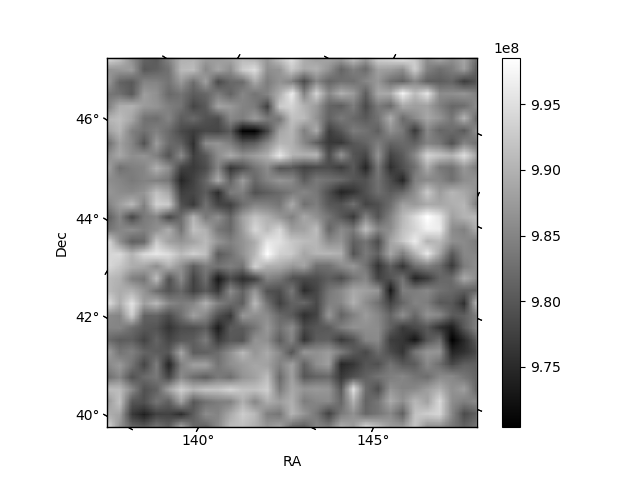
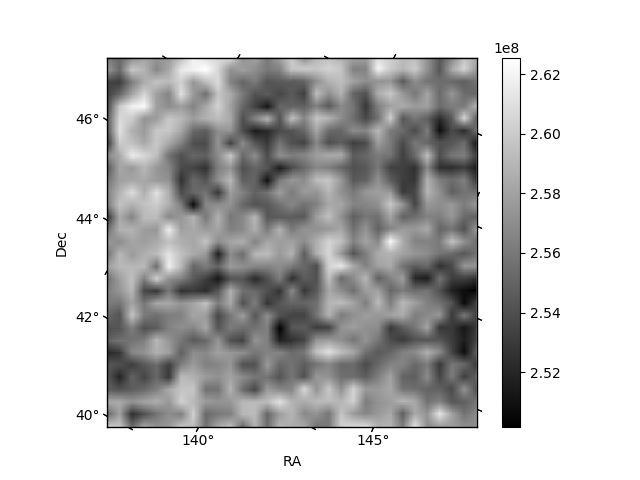
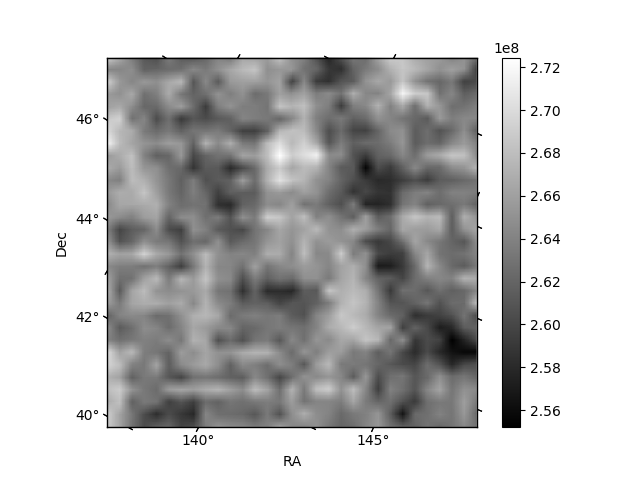
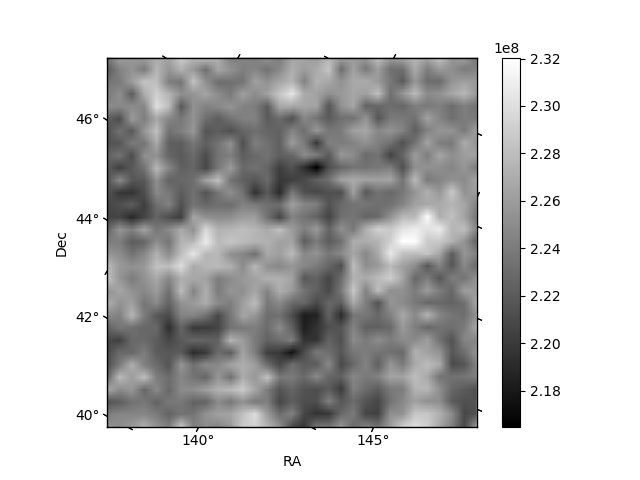
Histogram calculated using DETX and DETY for each event in the final _common_clean file
| Quadrant A | 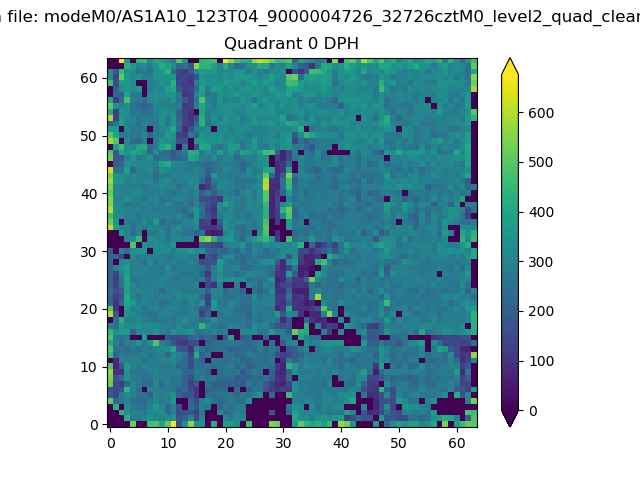 |
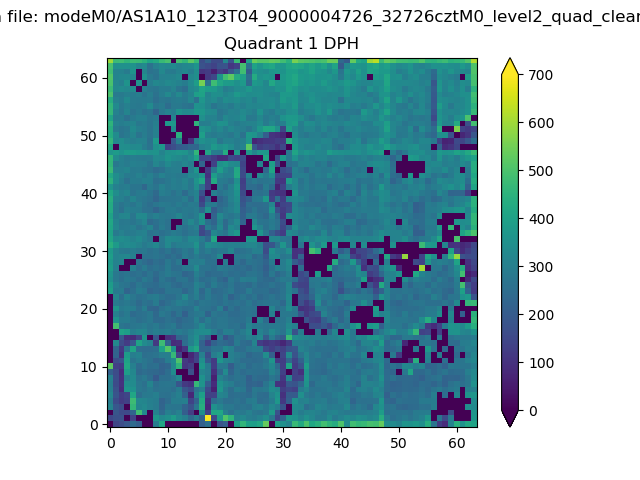 |
Quadrant B |
|---|---|---|---|
| Quadrant D | 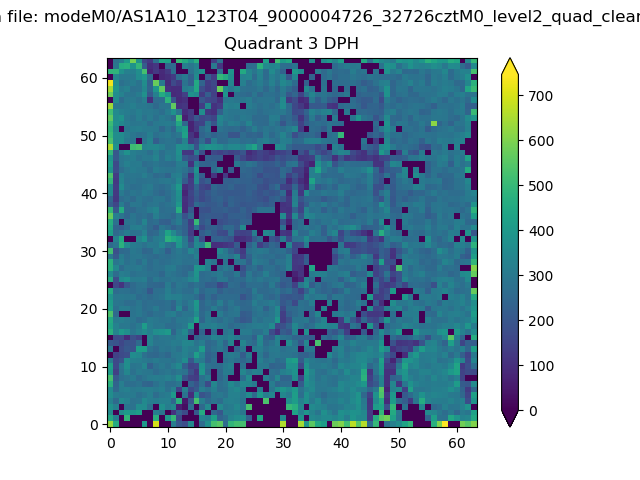 |
 |
Quadrant C |
| Plot type | Count rate plots | Images |
|---|---|---|
| Comparison with Poisson distribution Blue bars denote a histogram of data divided into 1 sec bins. Red curve is a Poisson curve with rate = median count rate of data. |
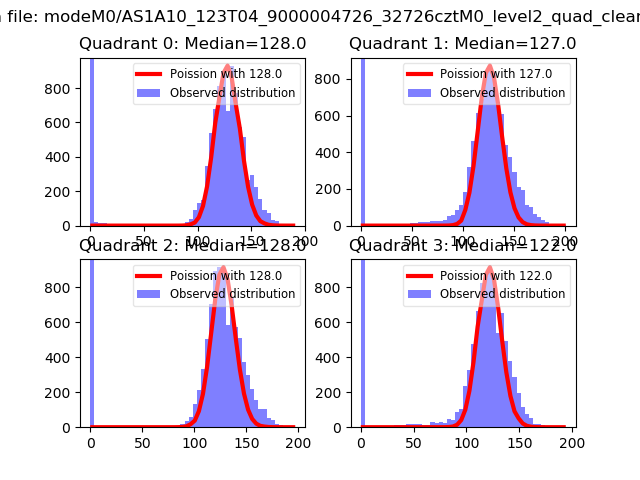 |
 |
| Quadrant-wise count rates Data is divided into 100 sec bins |
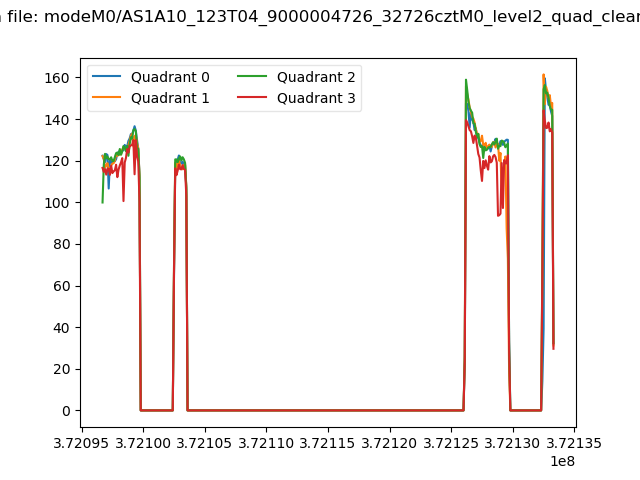 |
|
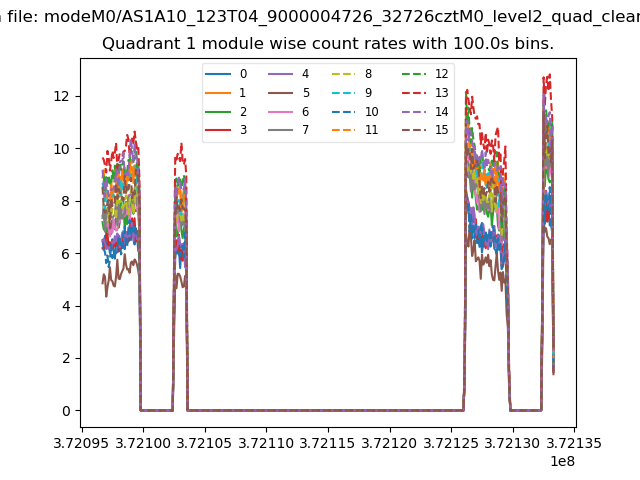
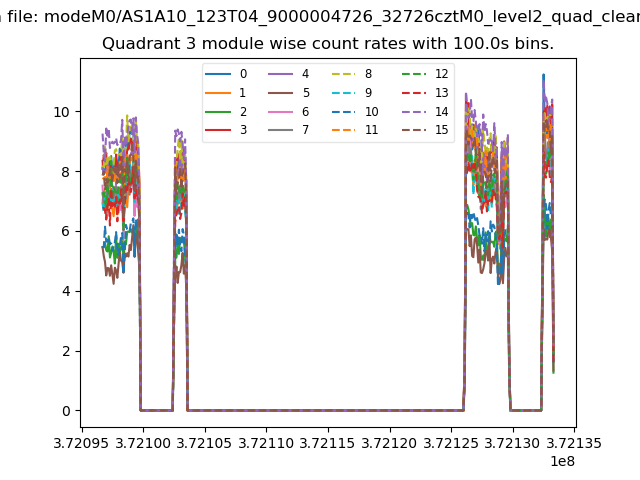
| Module-wise count rates for Quadrant A Data is divided into 100 sec bins |
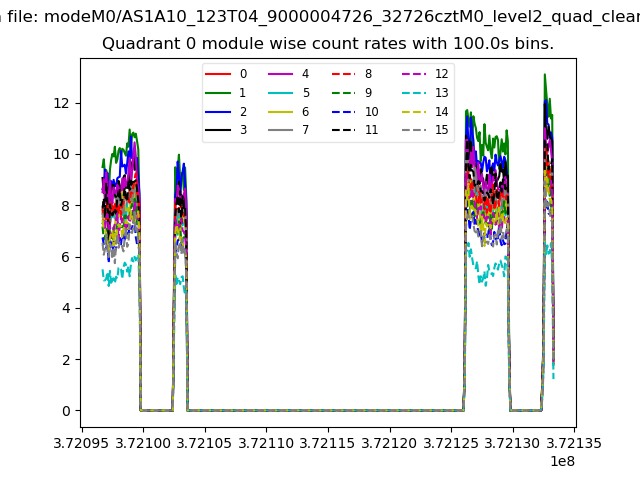 |
 |
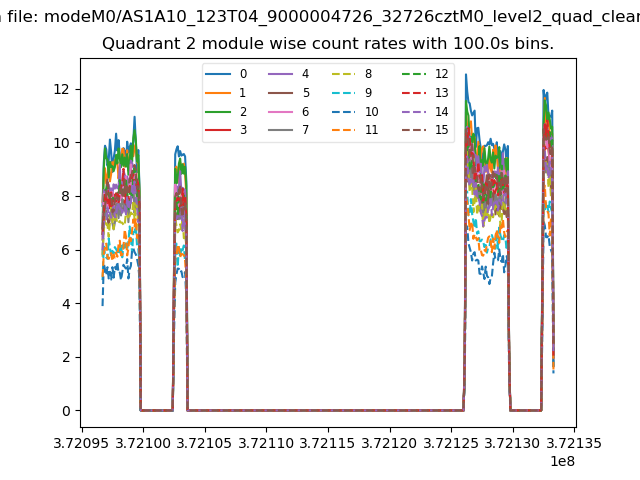
| Module-wise count rates for Quadrant B Data is divided into 100 sec bins |
 |
 |
| Module-wise count rates for Quadrant C Data is divided into 100 sec bins |
 |
 |
| Module-wise count rates for Quadrant D Data is divided into 100 sec bins |
 |
 |
| Parameter | Plot |
|---|---|
| CZT HV Monitor | 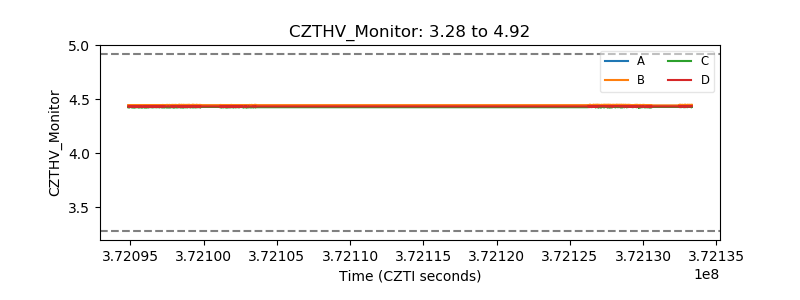 |
| D_VDD | 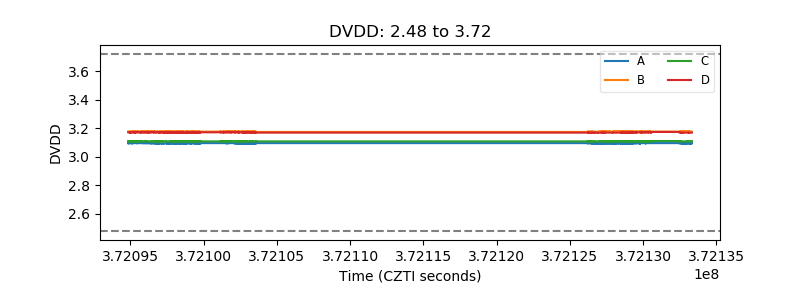 |
| Temperature 1 |  |
| Veto HV Monitor | 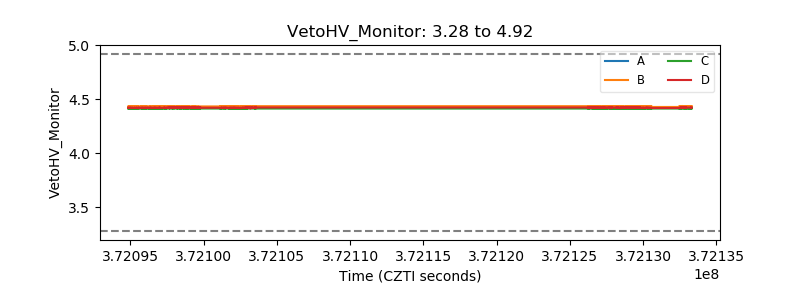 |
| Veto LLD | 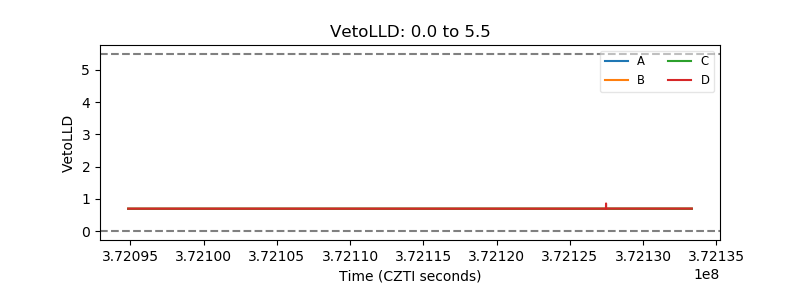 |
| Alpha Counter | 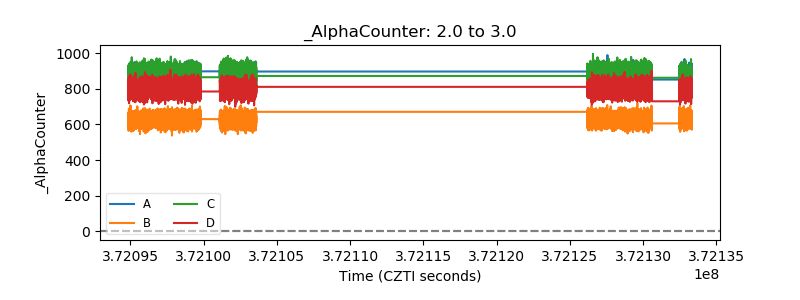 |
| _CPM_Rate | 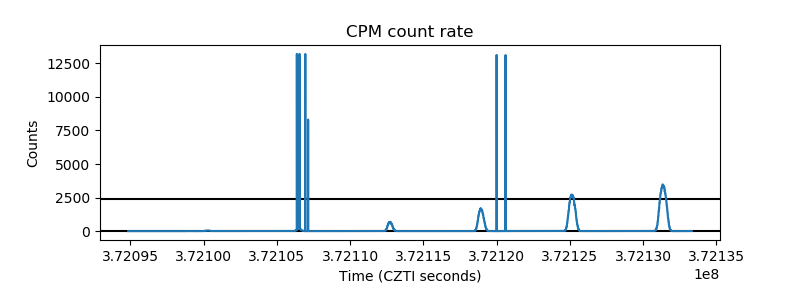 |
| CZT Counter | 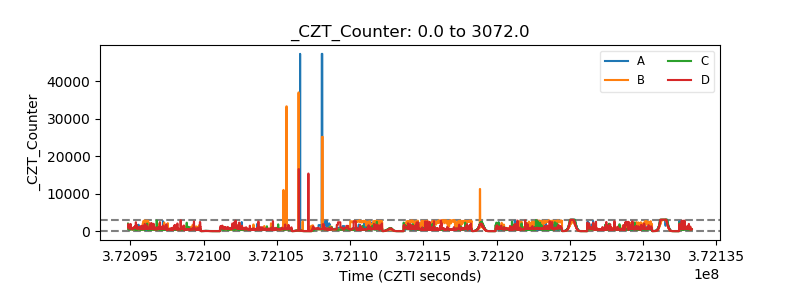 |
| +2.5 Volts monitor |  |
| +5 Volts monitor |  |
| _ROLL_ROT | 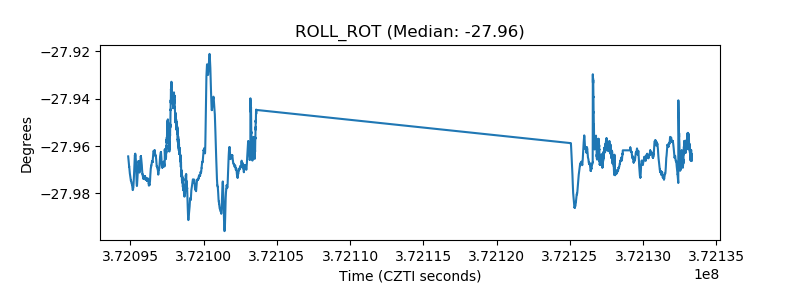 |
| _Roll_DEC | 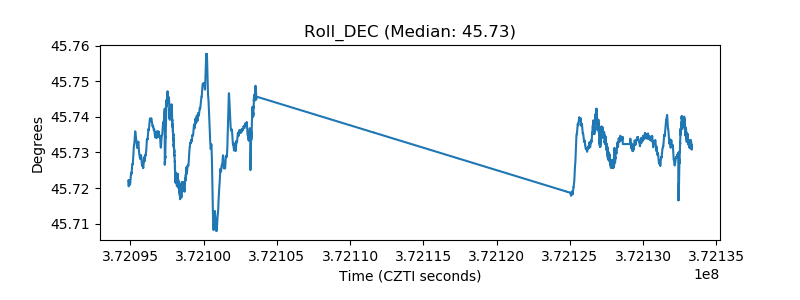 |
| _Roll_RA | 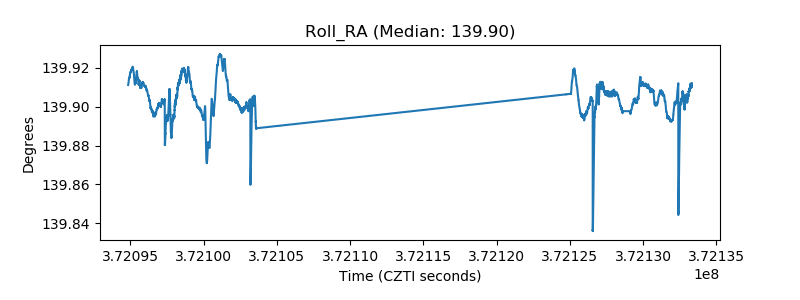 |
| Veto Counter | 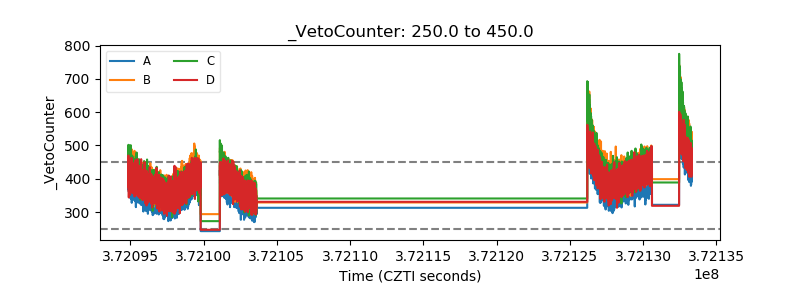 |