| Param | Original file | Final file |
|---|---|---|
| Filename | modeM0/AS1A10_123T04_9000004726_32727cztM0_level2.evt | modeM0/AS1A10_123T04_9000004726_32727cztM0_level2_quad_clean.evt |
| Size (bytes) | 547,056,000 | 90,270,720 |
| Size | 521.7 MB | 86.1 MB |
| Events in quadrant A | 2,998,974 | 586,353 |
| Events in quadrant B | 6,139,959 | 601,710 |
| Events in quadrant C | 2,801,331 | 602,124 |
| Events in quadrant D | 4,258,681 | 562,858 |
| Mode M0 | |||
|---|---|---|---|
| Quadrant | BADHDUFLAG | Total packets | Discarded packets |
| A | 0 | 12293 | 2 |
| B | 0 | 21923 | 1 |
| C | 0 | 11708 | 1 |
| D | 0 | 16362 | 1 |
| Mode M9 | |||
|---|---|---|---|
| Quadrant | BADHDUFLAG | Total packets | Discarded packets |
| A | 0 | 28 | 0 |
| B | 0 | 28 | 0 |
| C | 0 | 28 | 0 |
| D | 0 | 29 | 0 |
| Mode SS | |||
|---|---|---|---|
| Quadrant | BADHDUFLAG | Total packets | Discarded packets |
| A | 0 | 110 | 0 |
| B | 0 | 110 | 0 |
| C | 0 | 110 | 0 |
| D | 0 | 110 | 0 |
| Quadrant | Total seconds | Saturated seconds | Saturation percentage |
|---|---|---|---|
| A | 5440 | 151 | 2.775735% |
| B | 5440 | 1420 | 26.102941% |
| C | 5440 | 41 | 0.753676% |
| D | 5440 | 240 | 4.411765% |
Noise dominated data is calculated using 1-second bins in cleaned event files. If a bin has >2000 counts, and if more than 50% of those come from <1% of pixels, then it is considered to be noise-dominated and hence unusable.
| Quadrant | # 1 sec bins | Bins with >0 counts | Bins with >2000 counts | High rate bins dominated by noise | Noise dominated (total time) | Noise dominated (detector-on time) | Marked lightcurve |
|---|---|---|---|---|---|---|---|
| A | 7413 | 5441 | 105 | 105 | 1.42% | 1.93% | 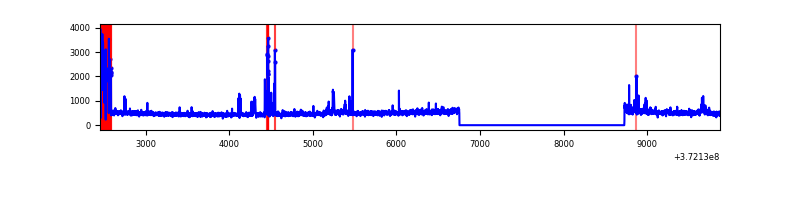 |
| B | 7413 | 5441 | 1066 | 1066 | 14.38% | 19.59% | 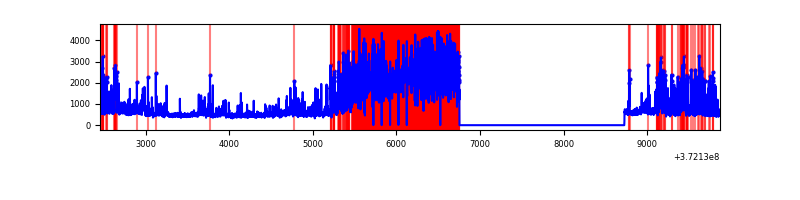 |
| C | 7413 | 5441 | 38 | 38 | 0.51% | 0.70% | 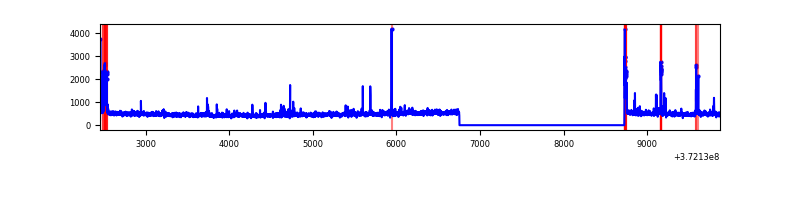 |
| D | 7413 | 5441 | 213 | 213 | 2.87% | 3.91% | 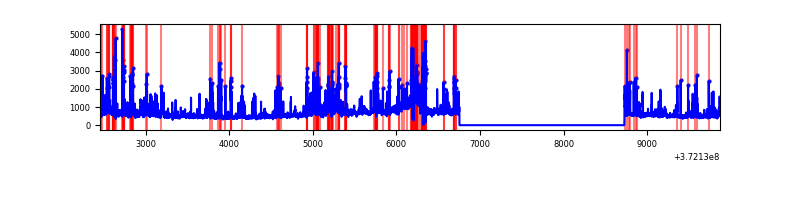 |
Top three noisy pixels from each quadrant. If the there are fewer than three noisy pixels in the level2.evt file, extra rows are filled as -1
| Pixel properties | Quadrant properties | ||||||
|---|---|---|---|---|---|---|---|
| Quadrant | DetID | PixID | Counts | Sigma | Mean | Median | Sigma |
| A | 15 | 249 | 422630 | 3282.89 | 644 | 631 | 128.5 |
| A | 15 | 237 | 41300 | 316.38 | 644 | 631 | 128.5 |
| A | 10 | 228 | 20956 | 158.12 | 644 | 631 | 128.5 |
| B | 12 | 1 | 3787792 | 37676.31 | 541 | 531 | 100.5 |
| B | 0 | 197 | 54509 | 536.98 | 541 | 531 | 100.5 |
| B | 0 | 219 | 53847 | 530.4 | 541 | 531 | 100.5 |
| C | 0 | 10 | 140096 | 956.25 | 634 | 640 | 145.8 |
| C | 0 | 207 | 63737 | 432.65 | 634 | 640 | 145.8 |
| C | 3 | 233 | 32592 | 219.09 | 634 | 640 | 145.8 |
| D | 7 | 80 | 510995 | 3523.73 | 615 | 604 | 144.8 |
| D | 8 | 195 | 386415 | 2663.63 | 615 | 604 | 144.8 |
| D | 2 | 250 | 286251 | 1972.1 | 615 | 604 | 144.8 |
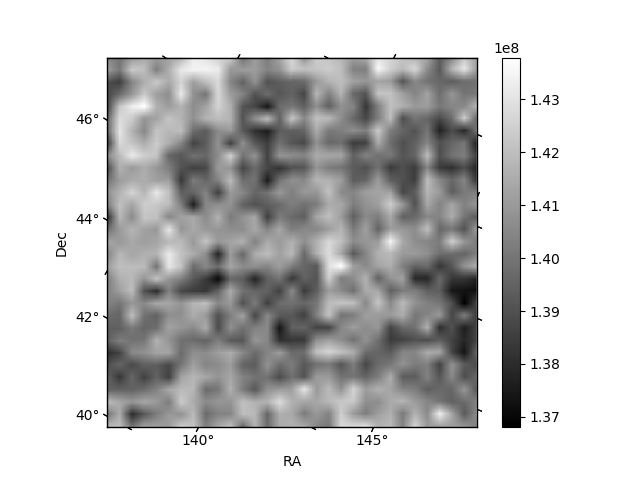
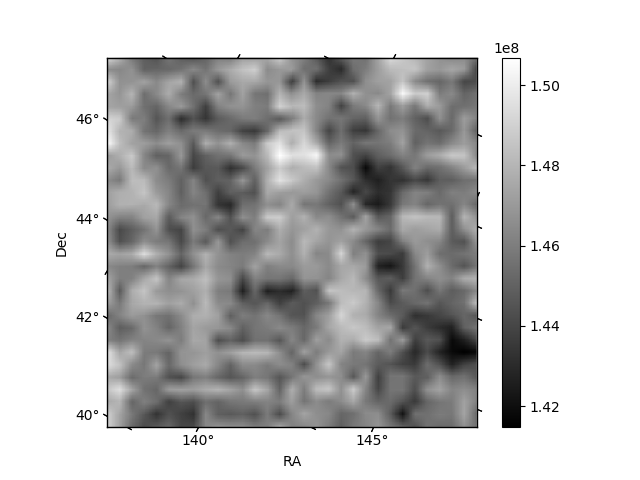
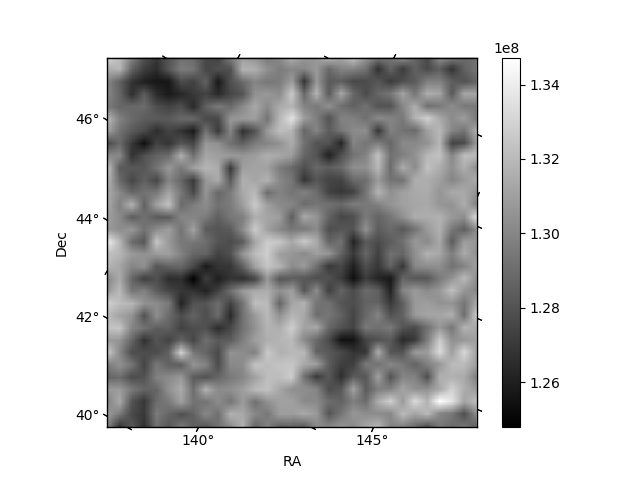
Histogram calculated using DETX and DETY for each event in the final _common_clean file
| Quadrant A | 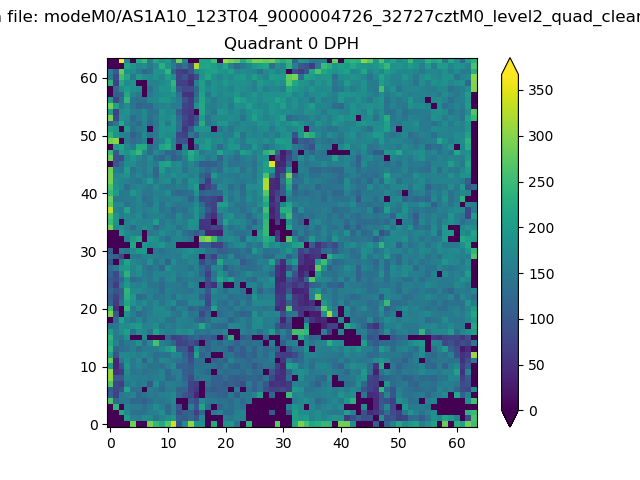 |
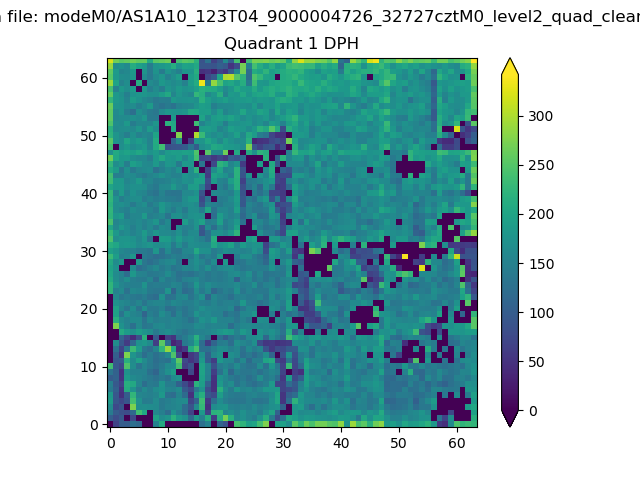 |
Quadrant B |
|---|---|---|---|
| Quadrant D | 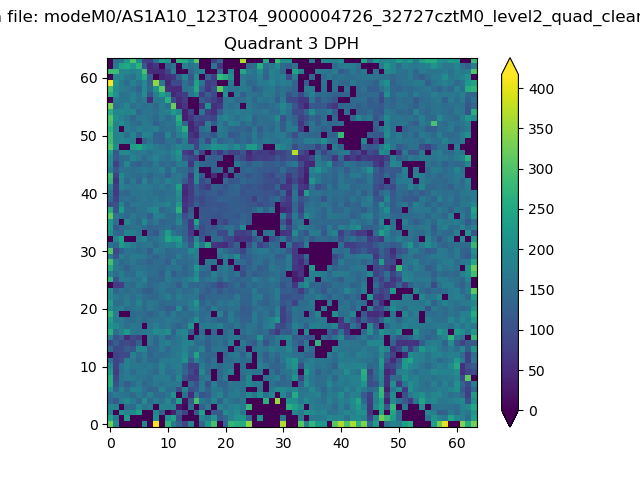 |
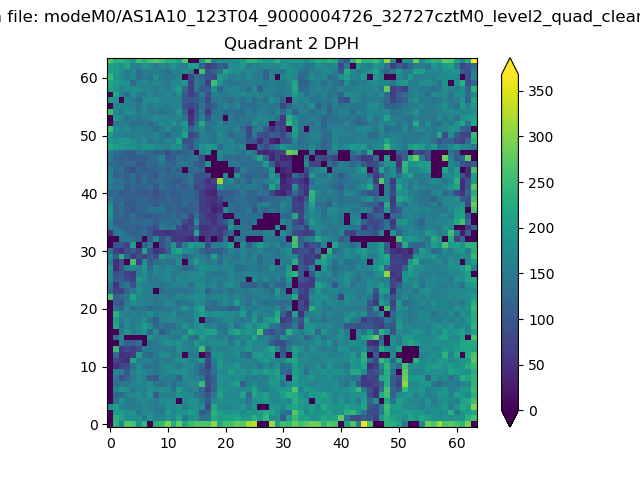 |
Quadrant C |
| Plot type | Count rate plots | Images |
|---|---|---|
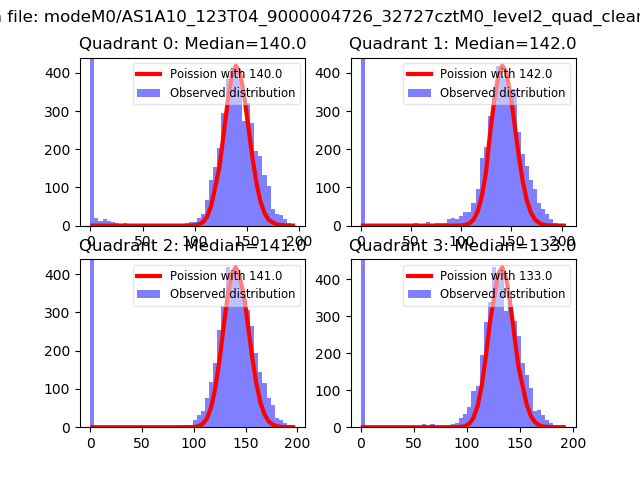
| Comparison with Poisson distribution Blue bars denote a histogram of data divided into 1 sec bins. Red curve is a Poisson curve with rate = median count rate of data. |
 |
 |
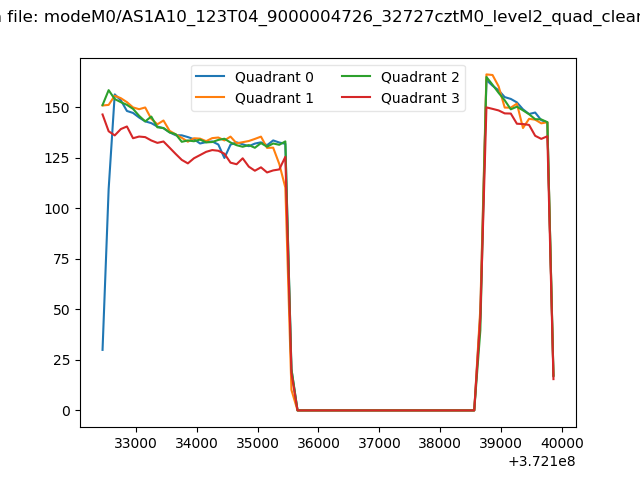
| Quadrant-wise count rates Data is divided into 100 sec bins |
 |
|
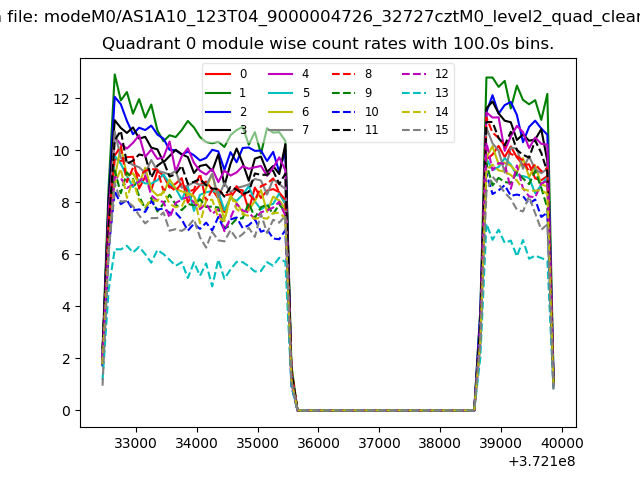
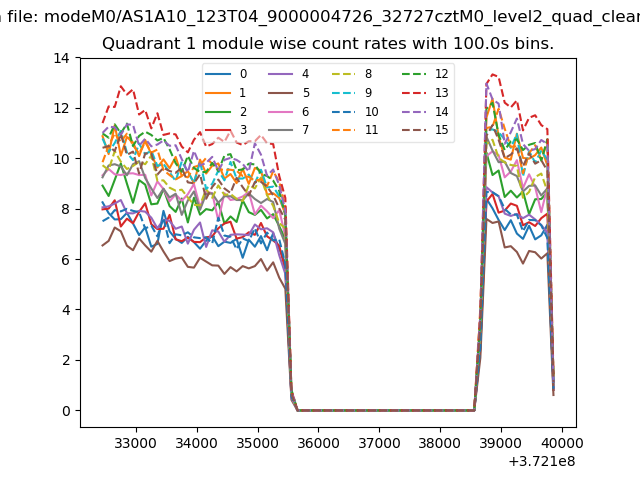
| Module-wise count rates for Quadrant A Data is divided into 100 sec bins |
 |
 |
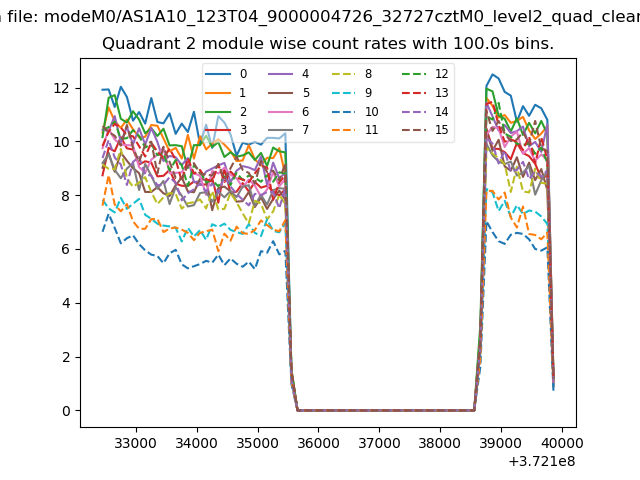
| Module-wise count rates for Quadrant B Data is divided into 100 sec bins |
 |
 |
| Module-wise count rates for Quadrant C Data is divided into 100 sec bins |
 |
 |
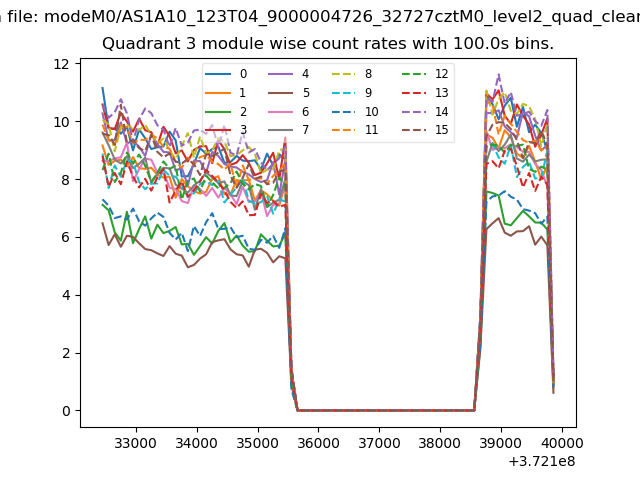
| Module-wise count rates for Quadrant D Data is divided into 100 sec bins |
 |
 |
| Parameter | Plot |
|---|---|
| CZT HV Monitor | 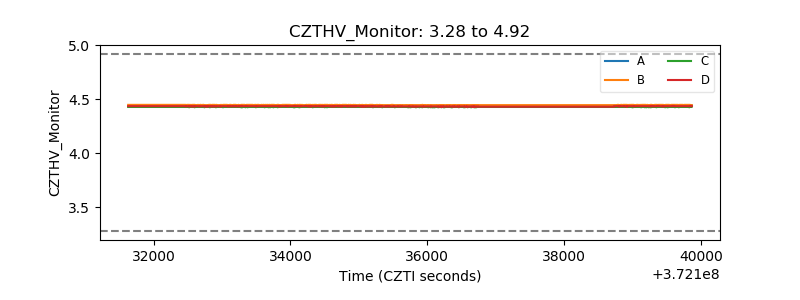 |
| D_VDD | 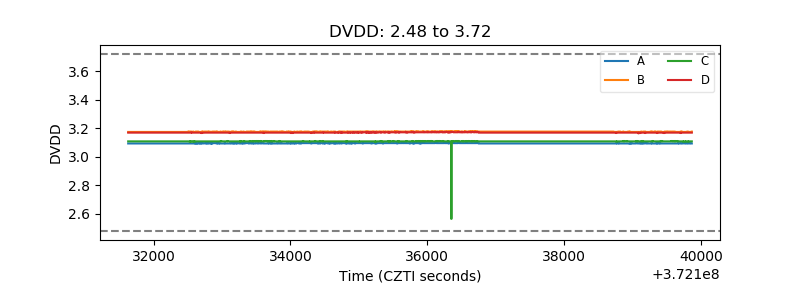 |
| Temperature 1 |  |
| Veto HV Monitor |  |
| Veto LLD | 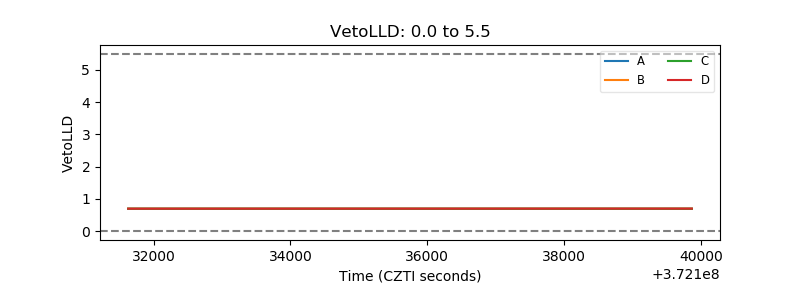 |
| Alpha Counter | 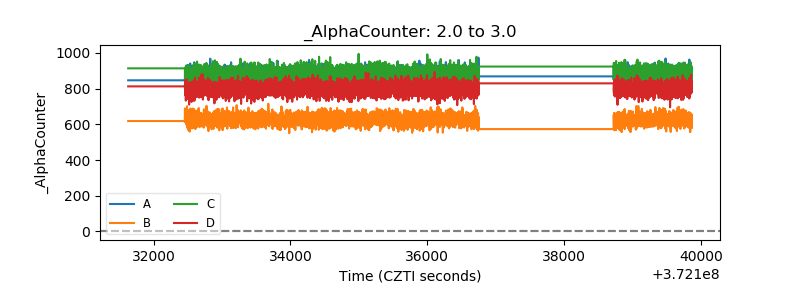 |
| _CPM_Rate | 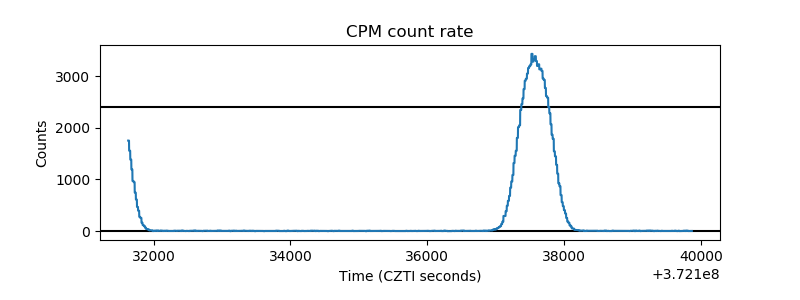 |
| CZT Counter | 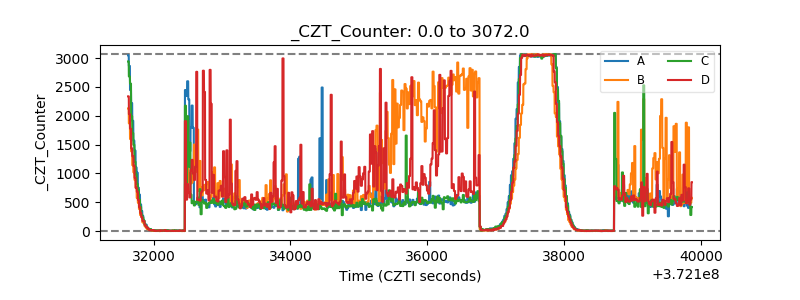 |
| +2.5 Volts monitor |  |
| +5 Volts monitor | 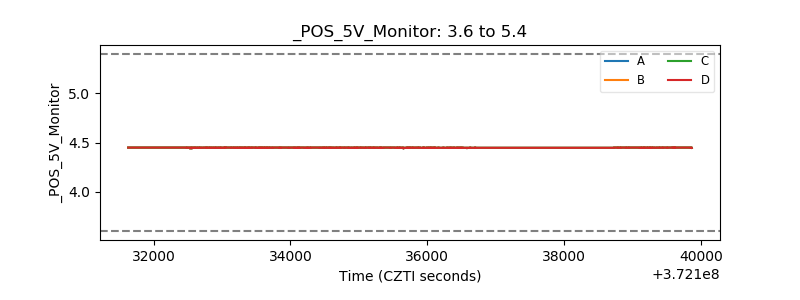 |
| _ROLL_ROT | 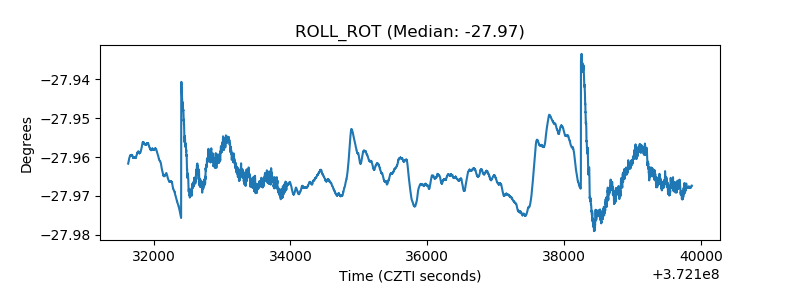 |
| _Roll_DEC | 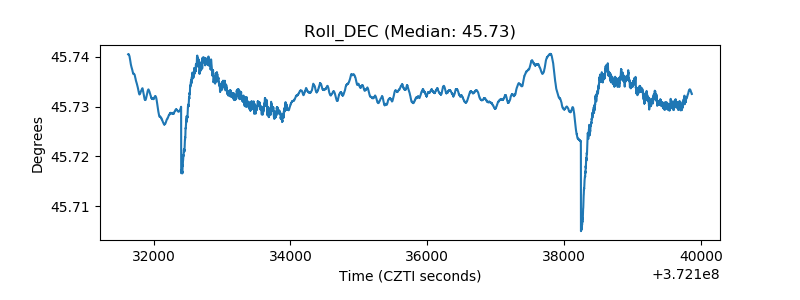 |
| _Roll_RA | 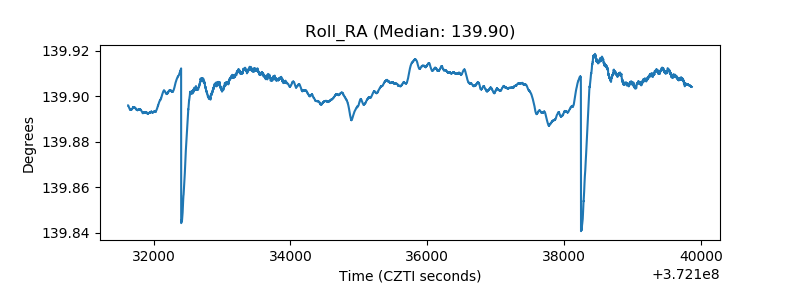 |
| Veto Counter | 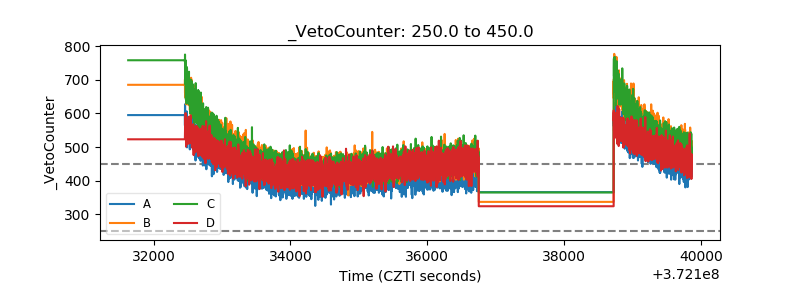 |