| Param | Original file | Final file |
|---|---|---|
| Filename | modeM0/AS1A10_123T04_9000004726_32728cztM0_level2.evt | modeM0/AS1A10_123T04_9000004726_32728cztM0_level2_quad_clean.evt |
| Size (bytes) | 603,244,800 | 82,834,560 |
| Size | 575.3 MB | 79.0 MB |
| Events in quadrant A | 3,475,007 | 557,047 |
| Events in quadrant B | 6,337,740 | 505,789 |
| Events in quadrant C | 2,969,655 | 558,488 |
| Events in quadrant D | 5,124,118 | 510,930 |
| Mode M0 | |||
|---|---|---|---|
| Quadrant | BADHDUFLAG | Total packets | Discarded packets |
| A | 0 | 13597 | 2 |
| B | 0 | 22516 | 3 |
| C | 0 | 12189 | 1 |
| D | 0 | 18835 | 1 |
| Mode M9 | |||
|---|---|---|---|
| Quadrant | BADHDUFLAG | Total packets | Discarded packets |
| A | 0 | 28 | 0 |
| B | 0 | 28 | 0 |
| C | 0 | 28 | 0 |
| D | 0 | 29 | 0 |
| Mode SS | |||
|---|---|---|---|
| Quadrant | BADHDUFLAG | Total packets | Discarded packets |
| A | 0 | 108 | 0 |
| B | 0 | 108 | 0 |
| C | 0 | 108 | 0 |
| D | 0 | 108 | 0 |
| Quadrant | Total seconds | Saturated seconds | Saturation percentage |
|---|---|---|---|
| A | 5372 | 66 | 1.228593% |
| B | 5371 | 1309 | 24.371625% |
| C | 5372 | 45 | 0.837677% |
| D | 5372 | 588 | 10.945644% |
Noise dominated data is calculated using 1-second bins in cleaned event files. If a bin has >2000 counts, and if more than 50% of those come from <1% of pixels, then it is considered to be noise-dominated and hence unusable.
| Quadrant | # 1 sec bins | Bins with >0 counts | Bins with >2000 counts | High rate bins dominated by noise | Noise dominated (total time) | Noise dominated (detector-on time) | Marked lightcurve |
|---|---|---|---|---|---|---|---|
| A | 7466 | 5373 | 51 | 51 | 0.68% | 0.95% | 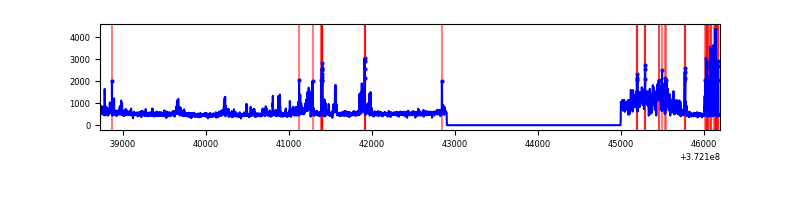 |
| B | 7466 | 5373 | 886 | 886 | 11.87% | 16.49% | 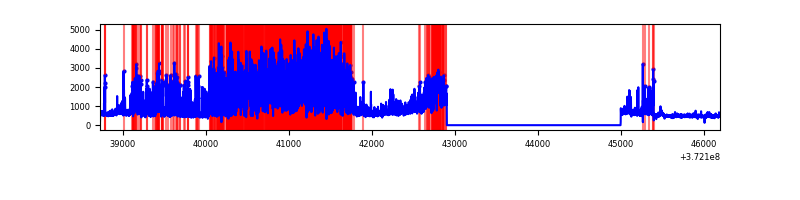 |
| C | 7466 | 5373 | 39 | 39 | 0.52% | 0.73% | 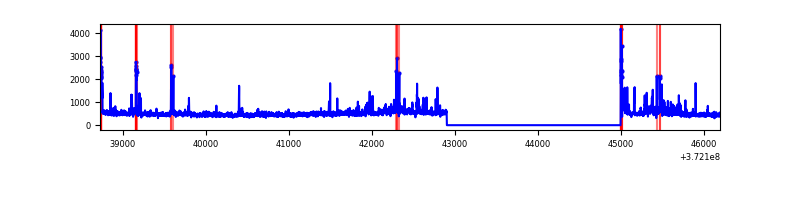 |
| D | 7466 | 5373 | 506 | 506 | 6.78% | 9.42% | 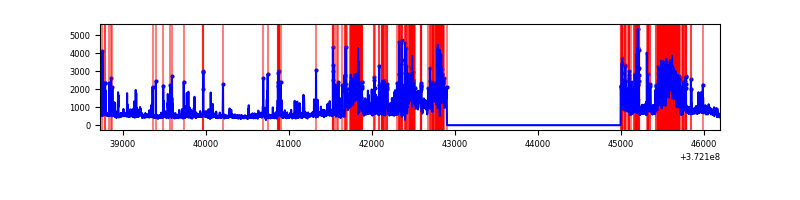 |
Top three noisy pixels from each quadrant. If the there are fewer than three noisy pixels in the level2.evt file, extra rows are filled as -1
| Pixel properties | Quadrant properties | ||||||
|---|---|---|---|---|---|---|---|
| Quadrant | DetID | PixID | Counts | Sigma | Mean | Median | Sigma |
| A | 15 | 249 | 866335 | 6652.44 | 661 | 649 | 130.1 |
| A | 10 | 228 | 20953 | 156.03 | 661 | 649 | 130.1 |
| A | 15 | 237 | 11833 | 85.94 | 661 | 649 | 130.1 |
| B | 12 | 1 | 3709628 | 33270.73 | 602 | 592 | 111.5 |
| B | 12 | 2 | 74779 | 665.47 | 602 | 592 | 111.5 |
| B | 0 | 219 | 65635 | 583.45 | 602 | 592 | 111.5 |
| C | 0 | 10 | 176585 | 1227.7 | 634 | 641 | 143.3 |
| C | 0 | 207 | 121601 | 844.03 | 634 | 641 | 143.3 |
| C | 0 | 239 | 70729 | 489.06 | 634 | 641 | 143.3 |
| D | 2 | 250 | 1106184 | 7761.23 | 605 | 593 | 142.5 |
| D | 7 | 80 | 701612 | 4921.14 | 605 | 593 | 142.5 |
| D | 8 | 195 | 262628 | 1839.48 | 605 | 593 | 142.5 |
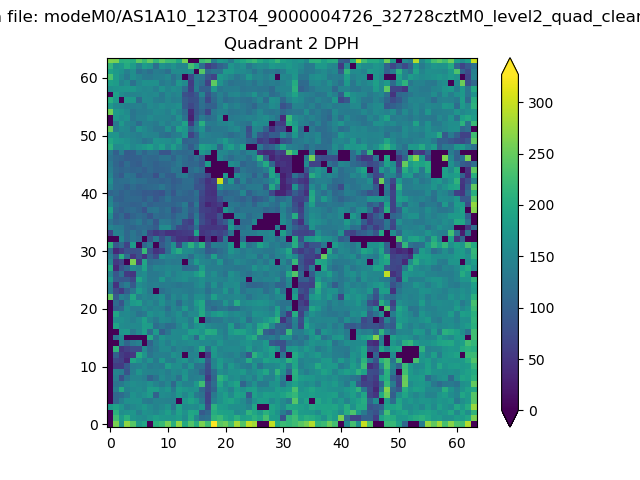
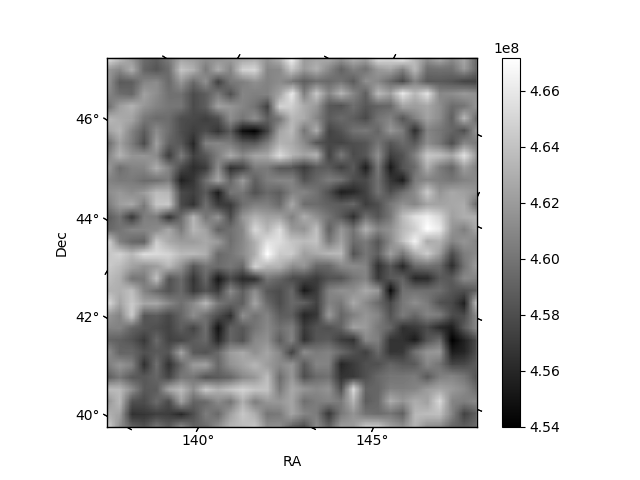
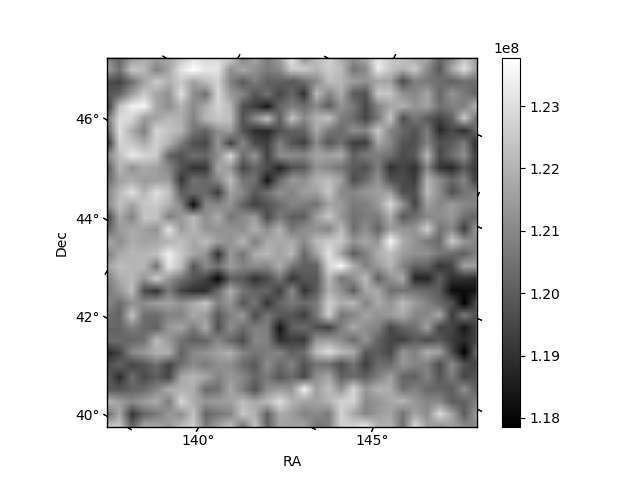
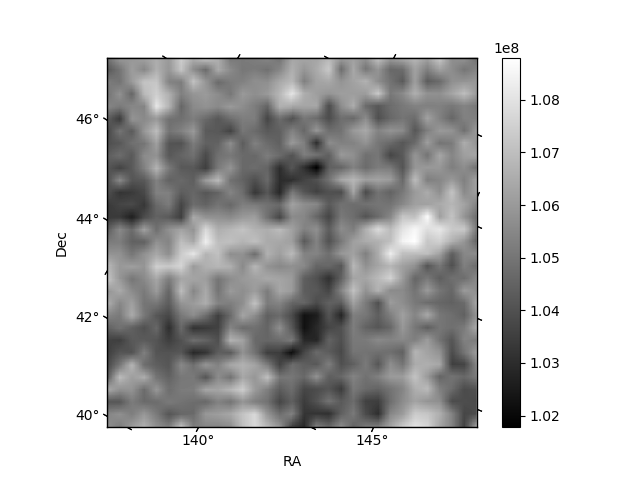
Histogram calculated using DETX and DETY for each event in the final _common_clean file
| Quadrant A | 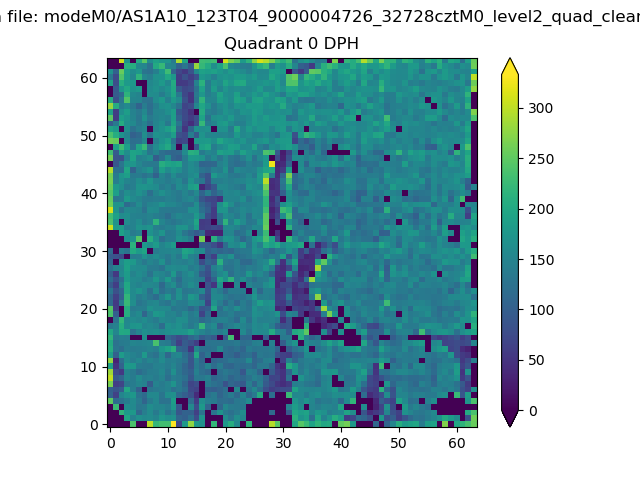 |
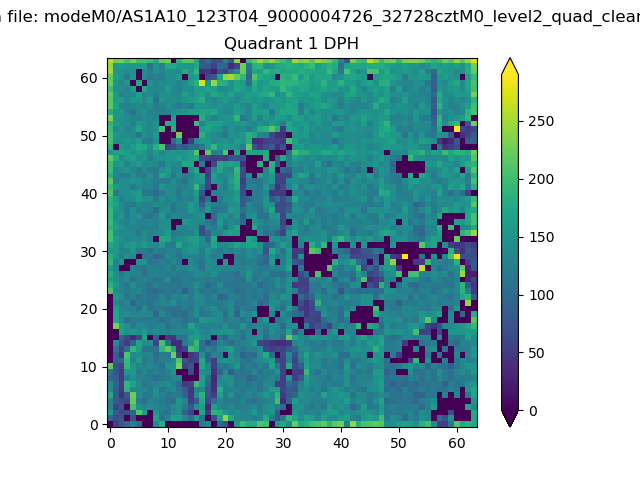 |
Quadrant B |
|---|---|---|---|
| Quadrant D | 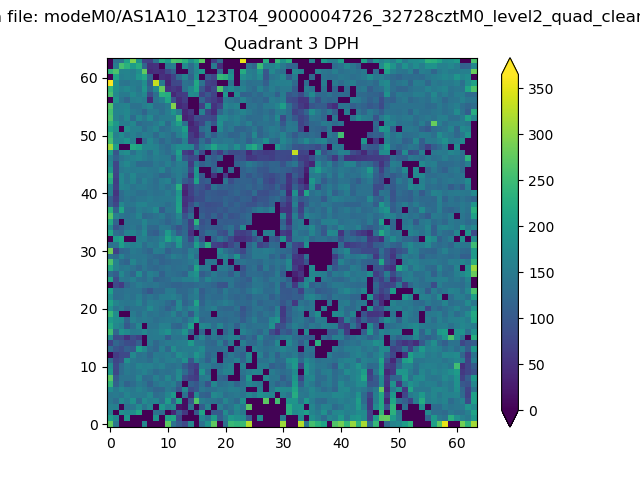 |
 |
Quadrant C |
| Plot type | Count rate plots | Images |
|---|---|---|
| Comparison with Poisson distribution Blue bars denote a histogram of data divided into 1 sec bins. Red curve is a Poisson curve with rate = median count rate of data. |
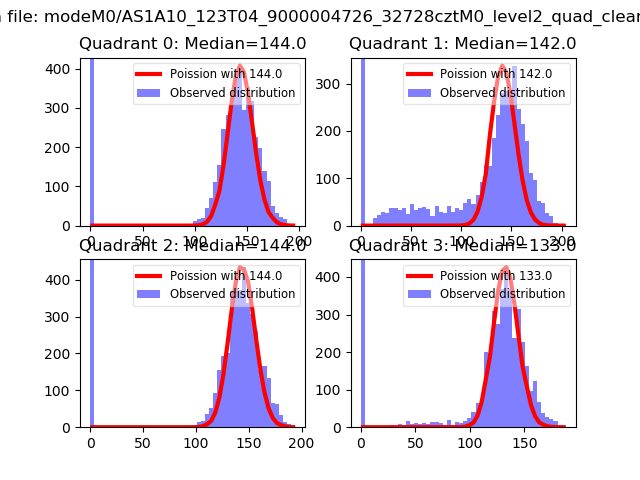 |
 |
| Quadrant-wise count rates Data is divided into 100 sec bins |
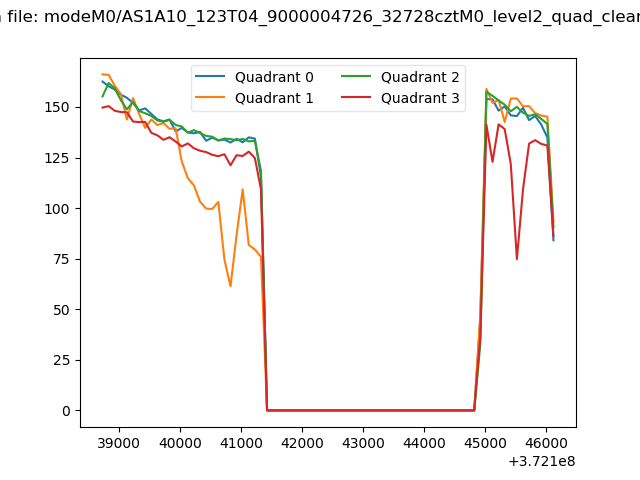 |
|
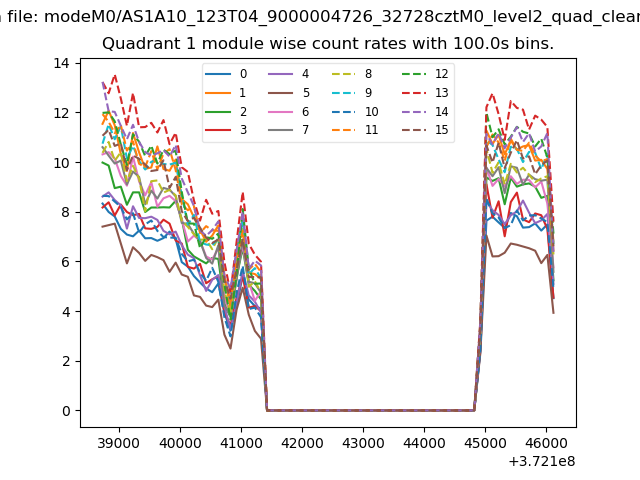
| Module-wise count rates for Quadrant A Data is divided into 100 sec bins |
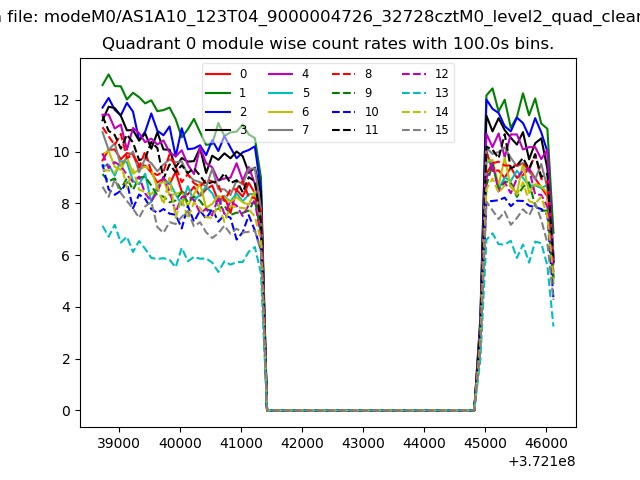 |
 |
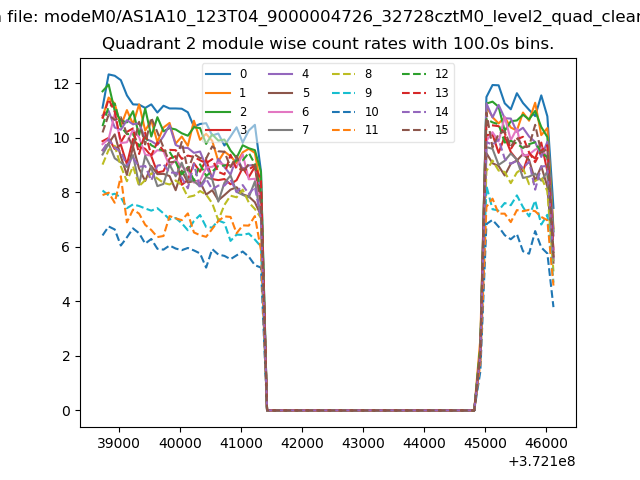
| Module-wise count rates for Quadrant B Data is divided into 100 sec bins |
 |
 |
| Module-wise count rates for Quadrant C Data is divided into 100 sec bins |
 |
 |
| Module-wise count rates for Quadrant D Data is divided into 100 sec bins |
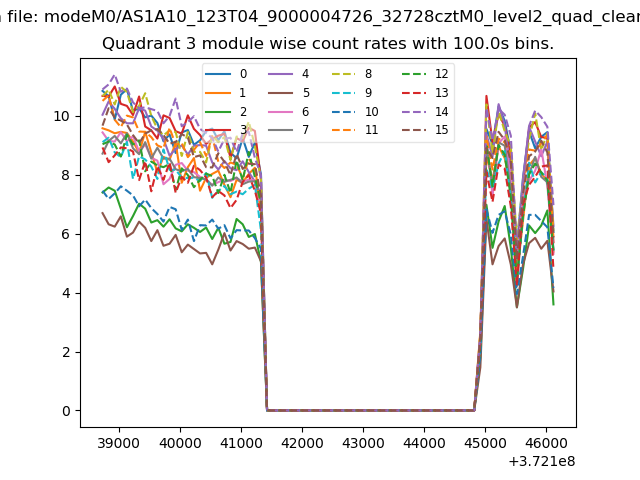 |
 |
| Parameter | Plot |
|---|---|
| CZT HV Monitor | 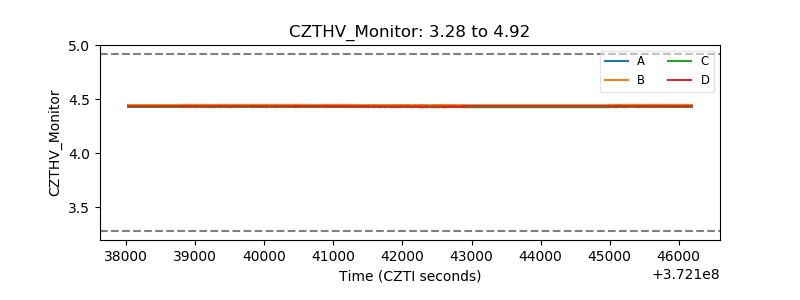 |
| D_VDD |  |
| Temperature 1 |  |
| Veto HV Monitor | 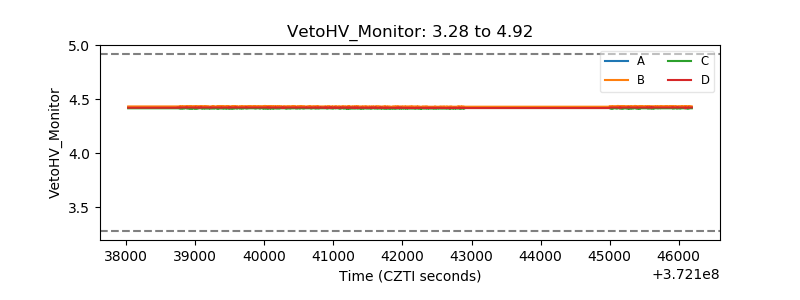 |
| Veto LLD |  |
| Alpha Counter | 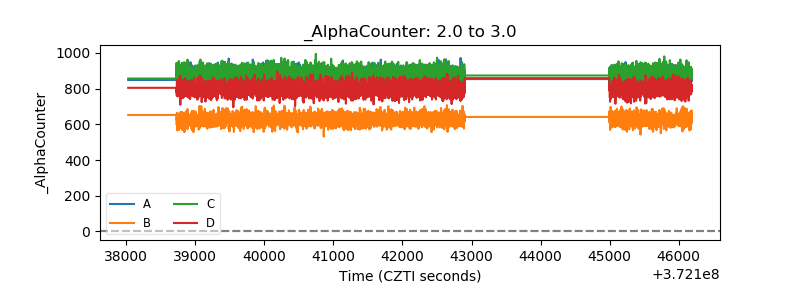 |
| _CPM_Rate | 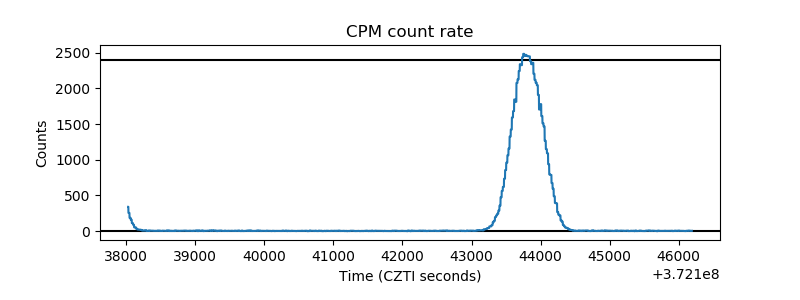 |
| CZT Counter | 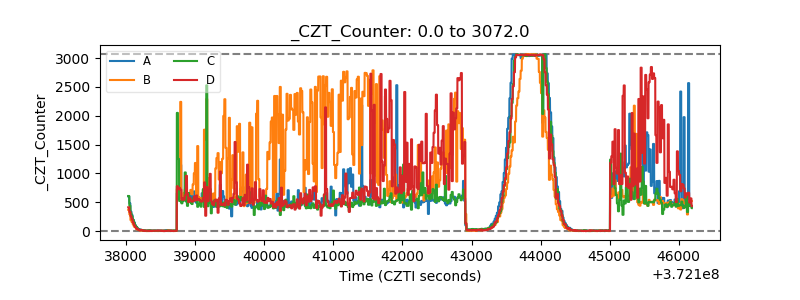 |
| +2.5 Volts monitor |  |
| +5 Volts monitor |  |
| _ROLL_ROT | 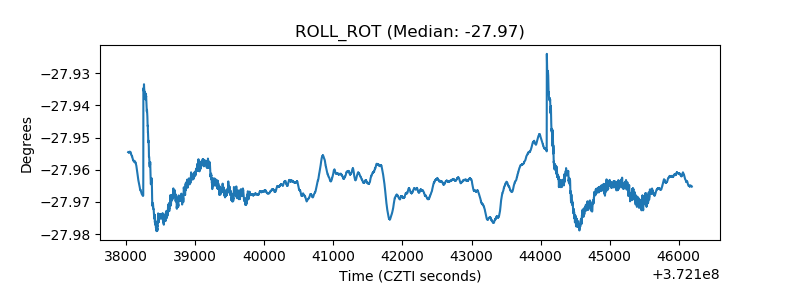 |
| _Roll_DEC | 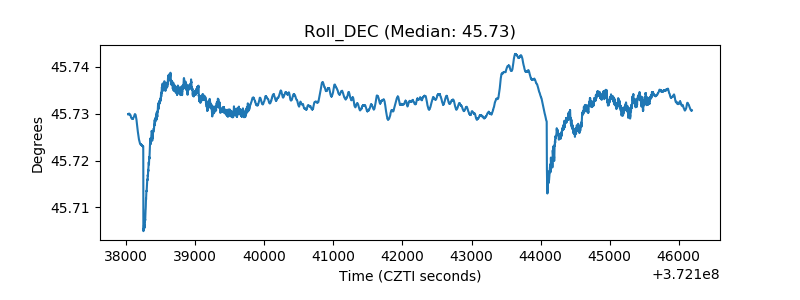 |
| _Roll_RA | 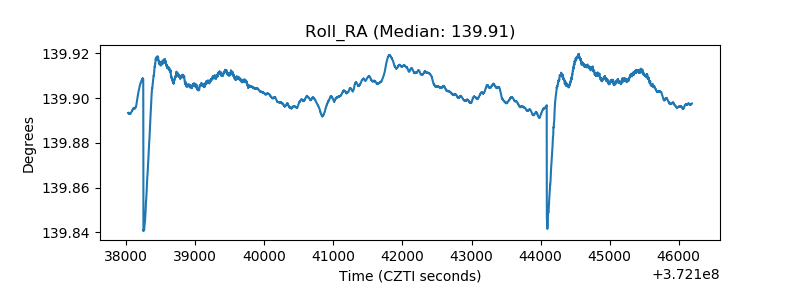 |
| Veto Counter | 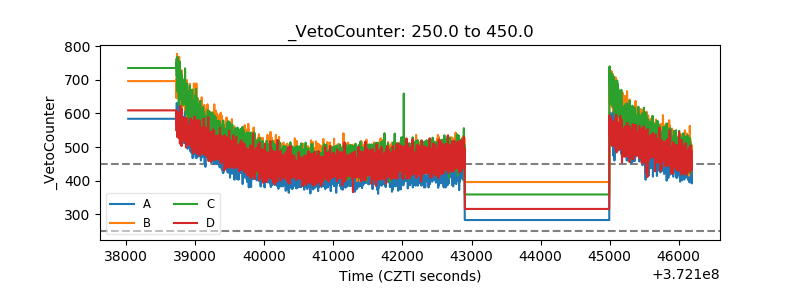 |