| Param | Original file | Final file |
|---|---|---|
| Filename | modeM0/AS1A10_123T04_9000004726_32729cztM0_level2.evt | modeM0/AS1A10_123T04_9000004726_32729cztM0_level2_quad_clean.evt |
| Size (bytes) | 473,860,800 | 62,703,360 |
| Size | 451.9 MB | 59.8 MB |
| Events in quadrant A | 2,804,622 | 405,308 |
| Events in quadrant B | 2,751,573 | 414,138 |
| Events in quadrant C | 2,607,091 | 398,789 |
| Events in quadrant D | 5,864,427 | 345,259 |
| Mode M0 | |||
|---|---|---|---|
| Quadrant | BADHDUFLAG | Total packets | Discarded packets |
| A | 0 | 11197 | 2 |
| B | 0 | 11091 | 1 |
| C | 0 | 10700 | 1 |
| D | 0 | 20811 | 1 |
| Mode M9 | |||
|---|---|---|---|
| Quadrant | BADHDUFLAG | Total packets | Discarded packets |
| A | 0 | 21 | 0 |
| B | 0 | 21 | 0 |
| C | 0 | 21 | 0 |
| D | 0 | 21 | 0 |
| Mode SS | |||
|---|---|---|---|
| Quadrant | BADHDUFLAG | Total packets | Discarded packets |
| A | 0 | 98 | 0 |
| B | 0 | 98 | 0 |
| C | 0 | 98 | 0 |
| D | 0 | 98 | 0 |
| Quadrant | Total seconds | Saturated seconds | Saturation percentage |
|---|---|---|---|
| A | 4766 | 31 | 0.650441% |
| B | 4766 | 43 | 0.902224% |
| C | 4766 | 84 | 1.762484% |
| D | 4766 | 819 | 17.184222% |
Noise dominated data is calculated using 1-second bins in cleaned event files. If a bin has >2000 counts, and if more than 50% of those come from <1% of pixels, then it is considered to be noise-dominated and hence unusable.
| Quadrant | # 1 sec bins | Bins with >0 counts | Bins with >2000 counts | High rate bins dominated by noise | Noise dominated (total time) | Noise dominated (detector-on time) | Marked lightcurve |
|---|---|---|---|---|---|---|---|
| A | 6889 | 4767 | 30 | 30 | 0.44% | 0.63% | 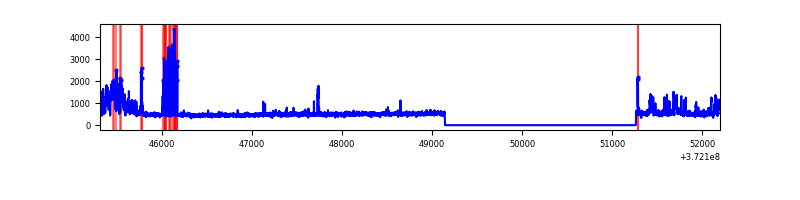 |
| B | 6889 | 4767 | 17 | 17 | 0.25% | 0.36% | 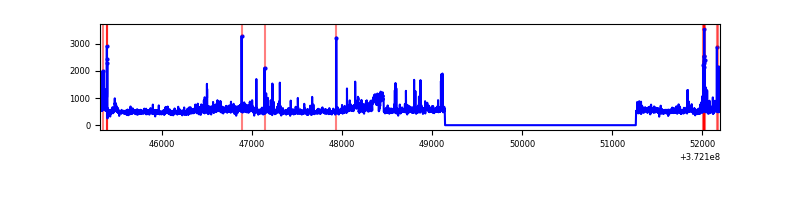 |
| C | 6889 | 4767 | 79 | 79 | 1.15% | 1.66% | 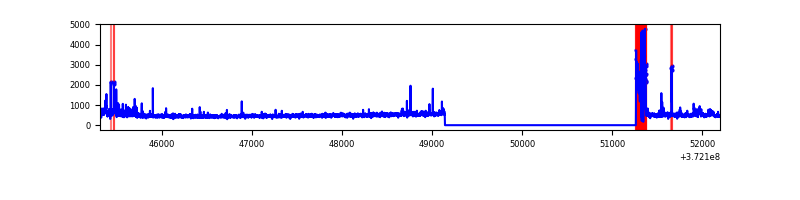 |
| D | 6889 | 4767 | 818 | 818 | 11.87% | 17.16% | 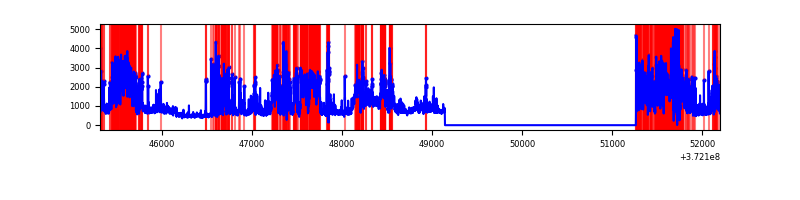 |
Top three noisy pixels from each quadrant. If the there are fewer than three noisy pixels in the level2.evt file, extra rows are filled as -1
| Pixel properties | Quadrant properties | ||||||
|---|---|---|---|---|---|---|---|
| Quadrant | DetID | PixID | Counts | Sigma | Mean | Median | Sigma |
| A | 15 | 249 | 394366 | 3372.61 | 587 | 577 | 116.8 |
| A | 10 | 228 | 130088 | 1109.2 | 587 | 577 | 116.8 |
| A | 13 | 254 | 9350 | 75.14 | 587 | 577 | 116.8 |
| B | 5 | 200 | 99867 | 904.65 | 584 | 572 | 109.8 |
| B | 0 | 197 | 90061 | 815.31 | 584 | 572 | 109.8 |
| B | 0 | 219 | 72747 | 657.57 | 584 | 572 | 109.8 |
| C | 0 | 10 | 252418 | 1967.81 | 558 | 562 | 128.0 |
| C | 6 | 96 | 39558 | 304.68 | 558 | 562 | 128.0 |
| C | 0 | 207 | 38959 | 300.0 | 558 | 562 | 128.0 |
| D | 2 | 250 | 1879264 | 15001.7 | 528 | 518 | 125.2 |
| D | 7 | 80 | 606563 | 4839.24 | 528 | 518 | 125.2 |
| D | 8 | 195 | 330998 | 2638.87 | 528 | 518 | 125.2 |
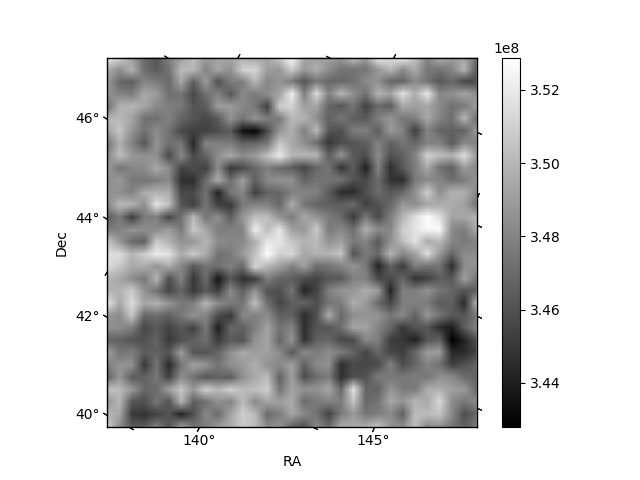
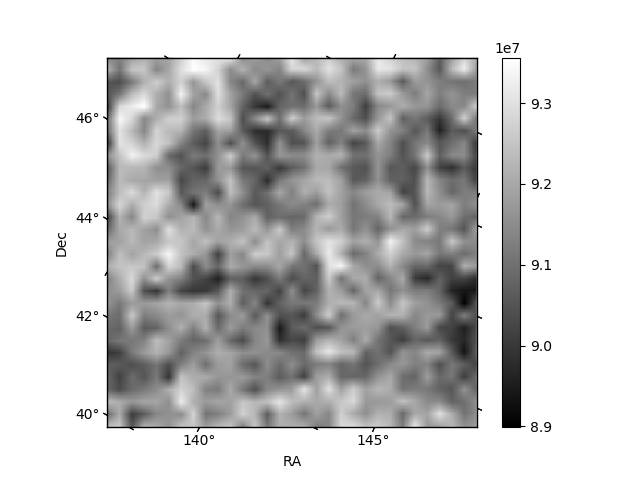
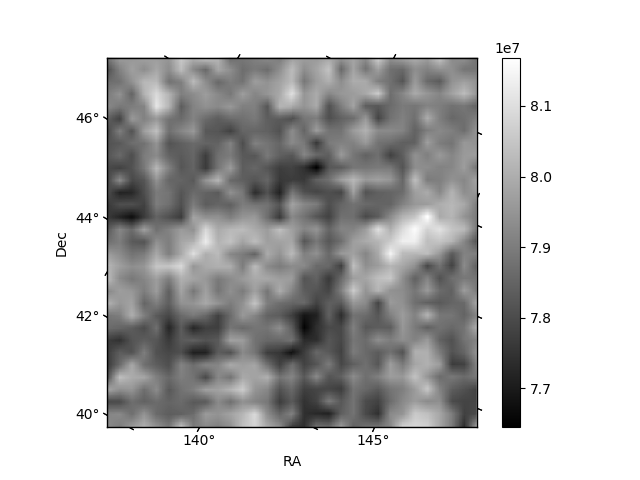
Histogram calculated using DETX and DETY for each event in the final _common_clean file
| Quadrant A | 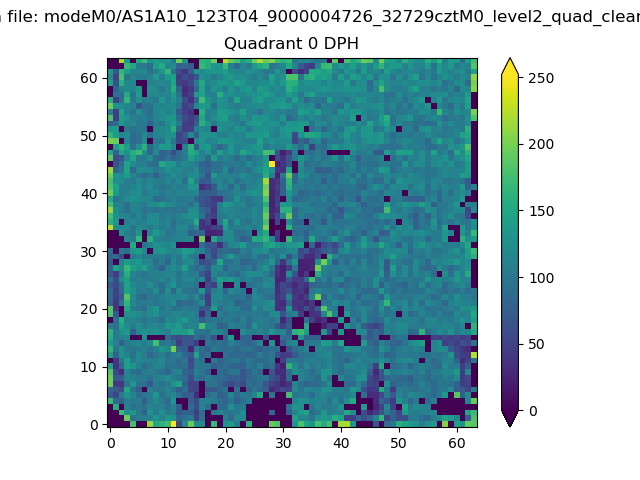 |
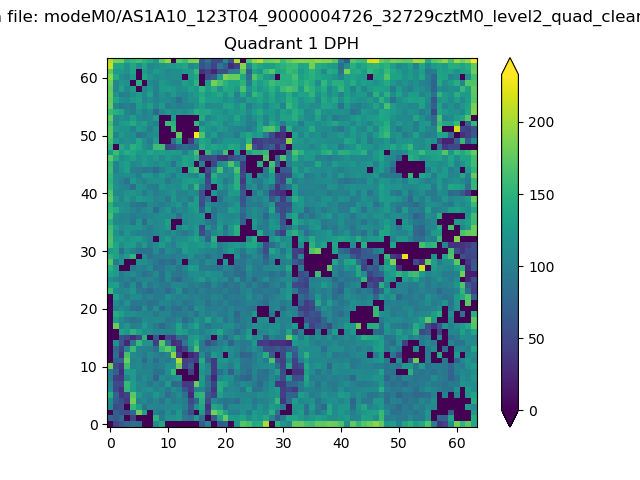 |
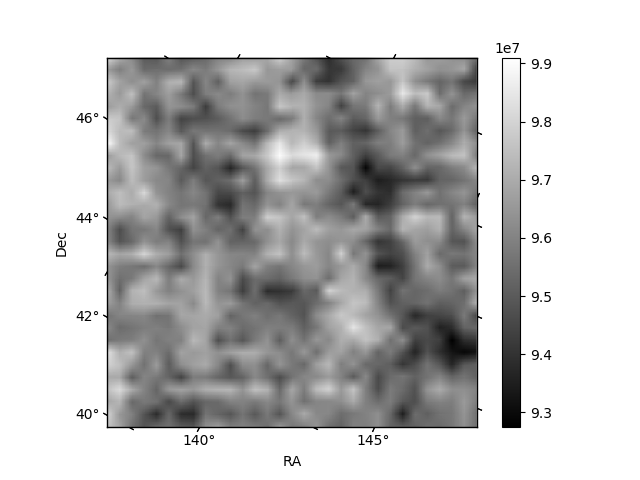
Quadrant B |
|---|---|---|---|
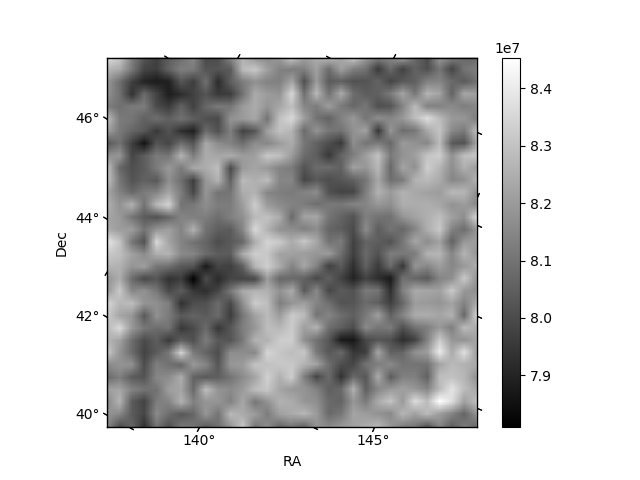
| Quadrant D | 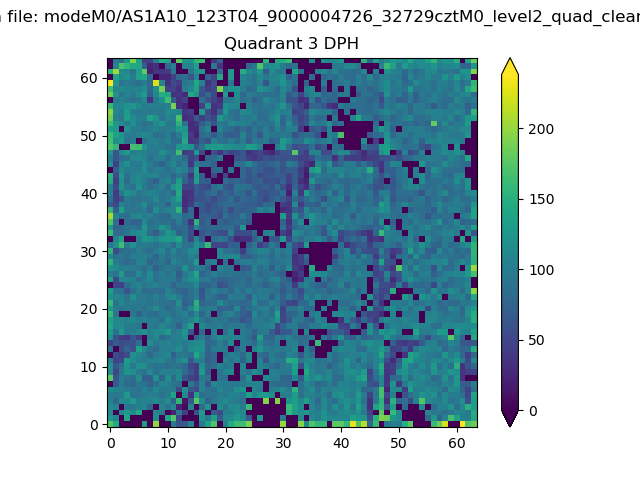 |
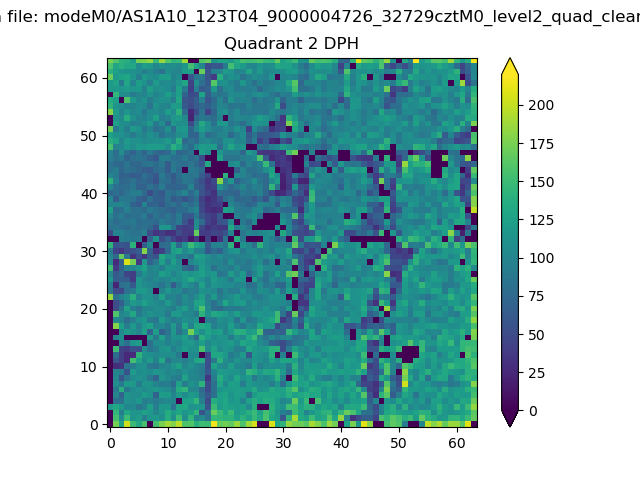 |
Quadrant C |
| Plot type | Count rate plots | Images |
|---|---|---|
| Comparison with Poisson distribution Blue bars denote a histogram of data divided into 1 sec bins. Red curve is a Poisson curve with rate = median count rate of data. |
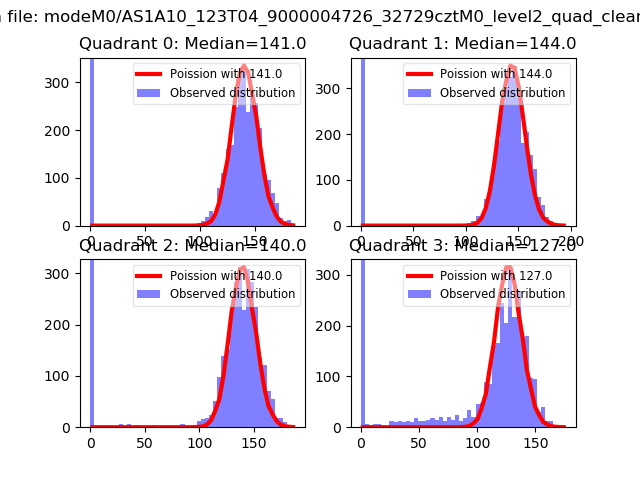 |
 |
| Quadrant-wise count rates Data is divided into 100 sec bins |
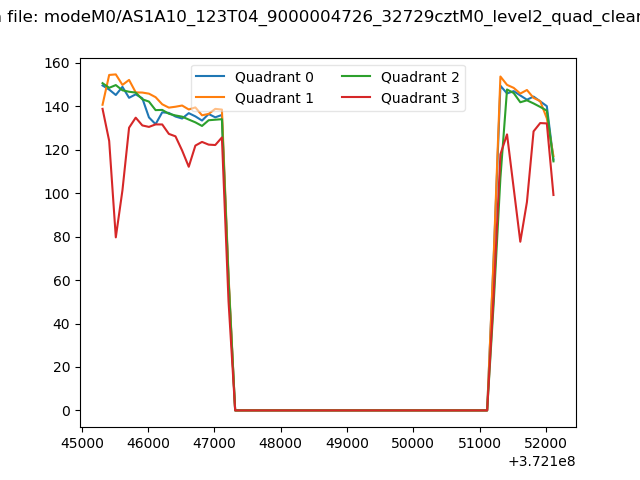 |
|
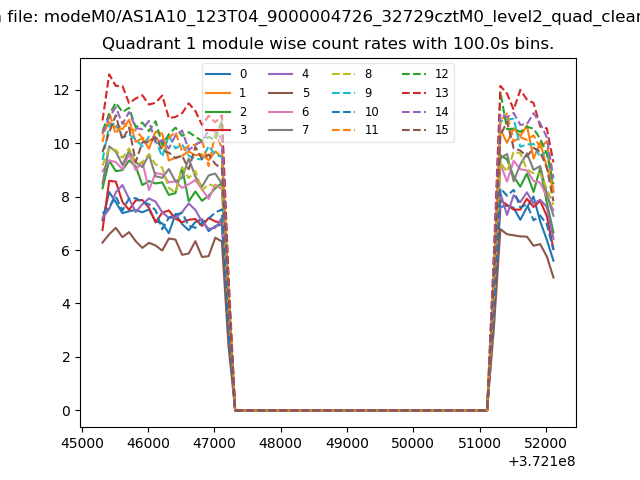
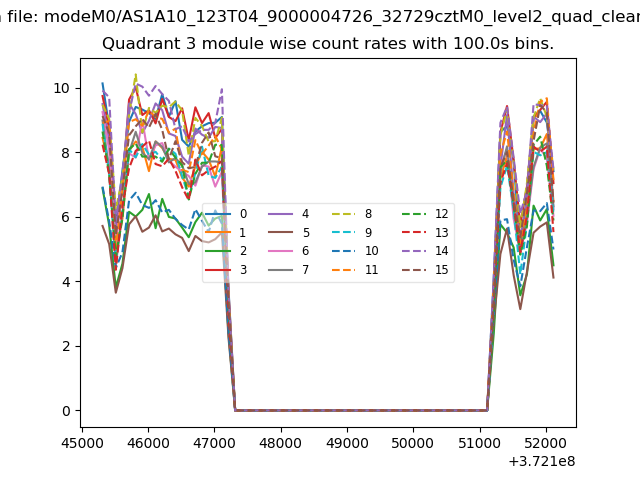
| Module-wise count rates for Quadrant A Data is divided into 100 sec bins |
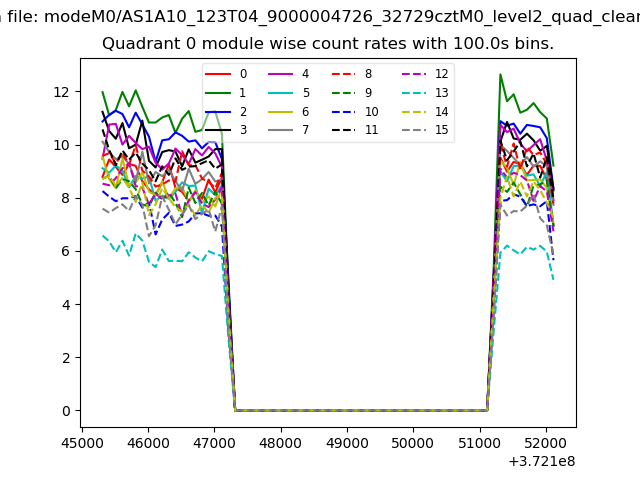 |
 |
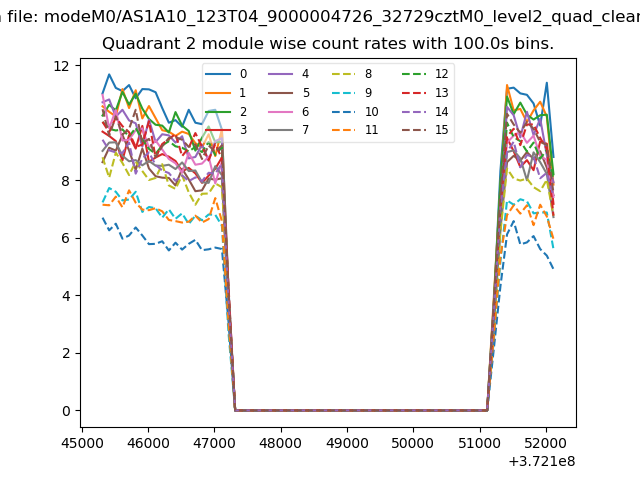
| Module-wise count rates for Quadrant B Data is divided into 100 sec bins |
 |
 |
| Module-wise count rates for Quadrant C Data is divided into 100 sec bins |
 |
 |
| Module-wise count rates for Quadrant D Data is divided into 100 sec bins |
 |
 |
| Parameter | Plot |
|---|---|
| CZT HV Monitor | 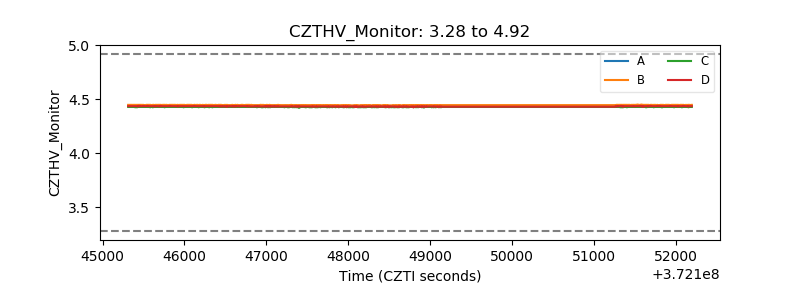 |
| D_VDD | 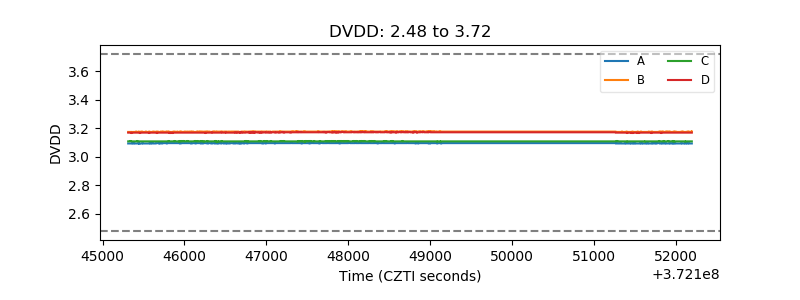 |
| Temperature 1 | 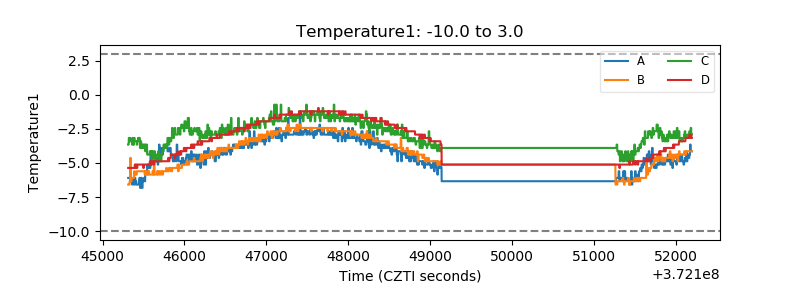 |
| Veto HV Monitor | 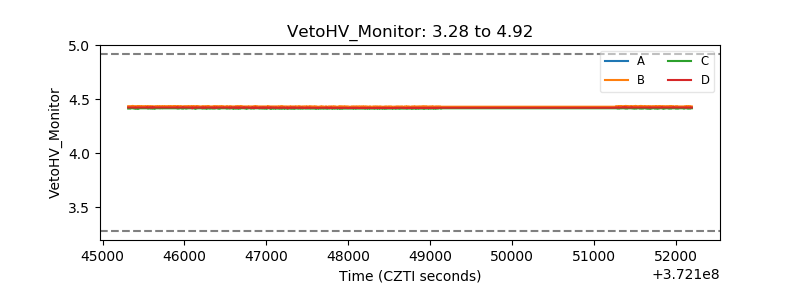 |
| Veto LLD | 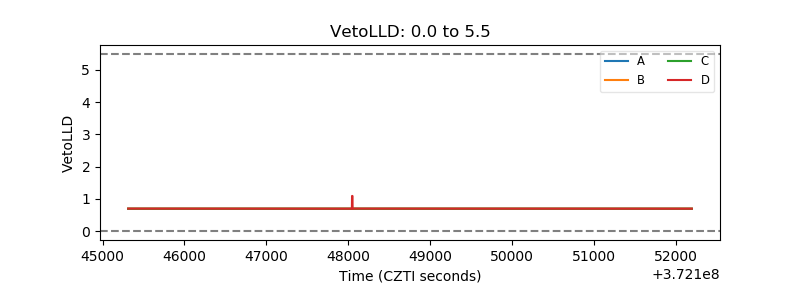 |
| Alpha Counter | 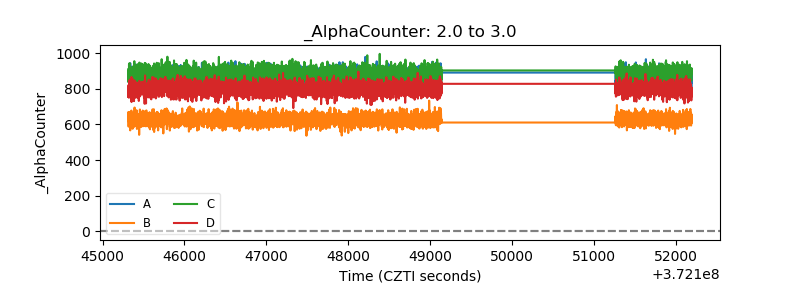 |
| _CPM_Rate | 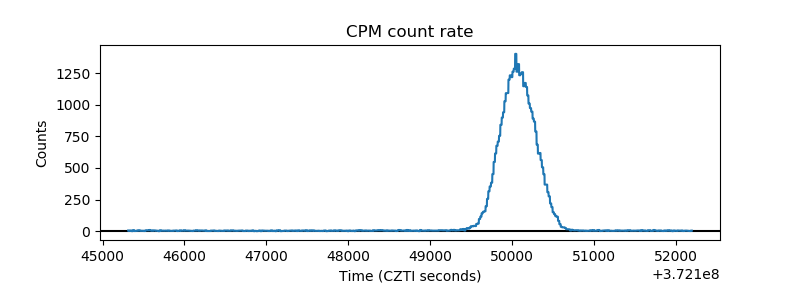 |
| CZT Counter | 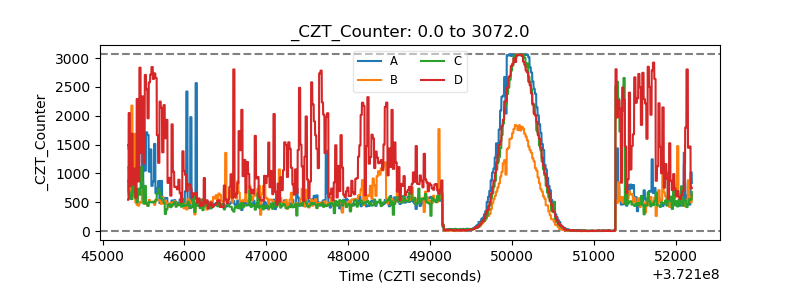 |
| +2.5 Volts monitor |  |
| +5 Volts monitor |  |
| _ROLL_ROT | 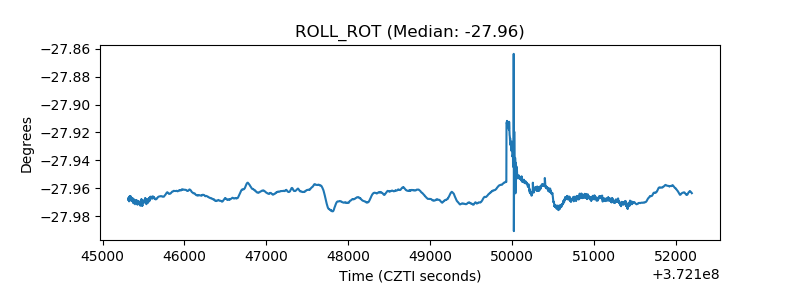 |
| _Roll_DEC | 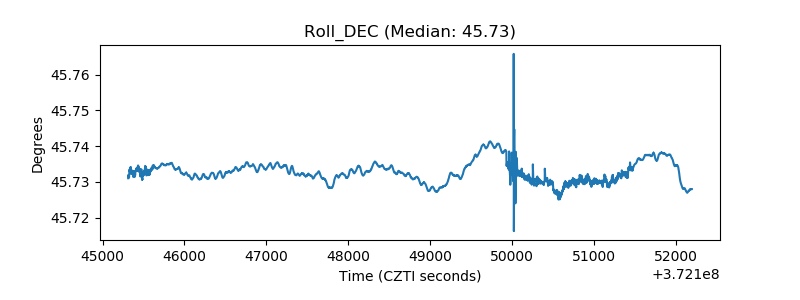 |
| _Roll_RA | 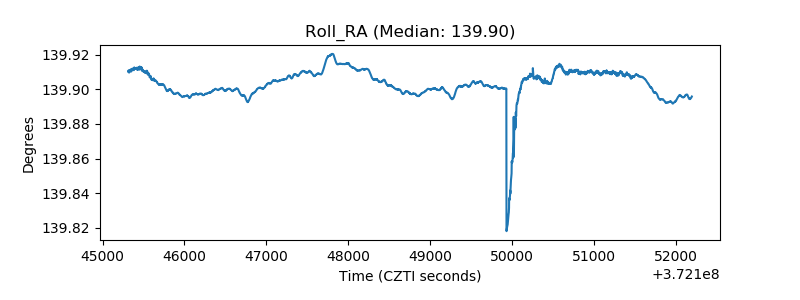 |
| Veto Counter | 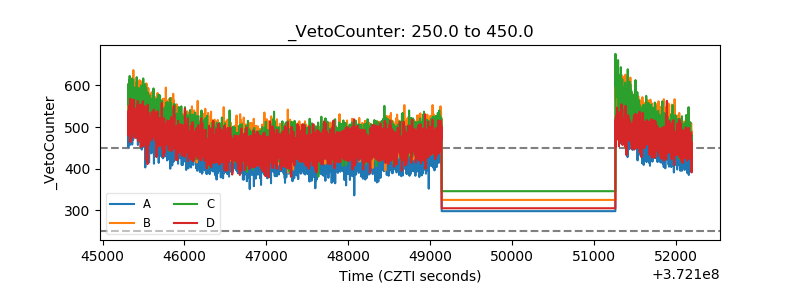 |